Golioth just rolled out a new settings service that lets you control your growing fleet of IoT devices. You can specify settings for your entire fleet, and override those global settings by individual device or for multiple devices that share the same blueprint.
Every IoT project needs some type of settings feature, from adjusting log levels and configuring the delay between sensor readings, to adjusting how frequently a cellular connection is used in order to conserve power. With the new settings service, the work is already done for you. A single settings change on the Golioth web console is applied to all devices listening for changes!
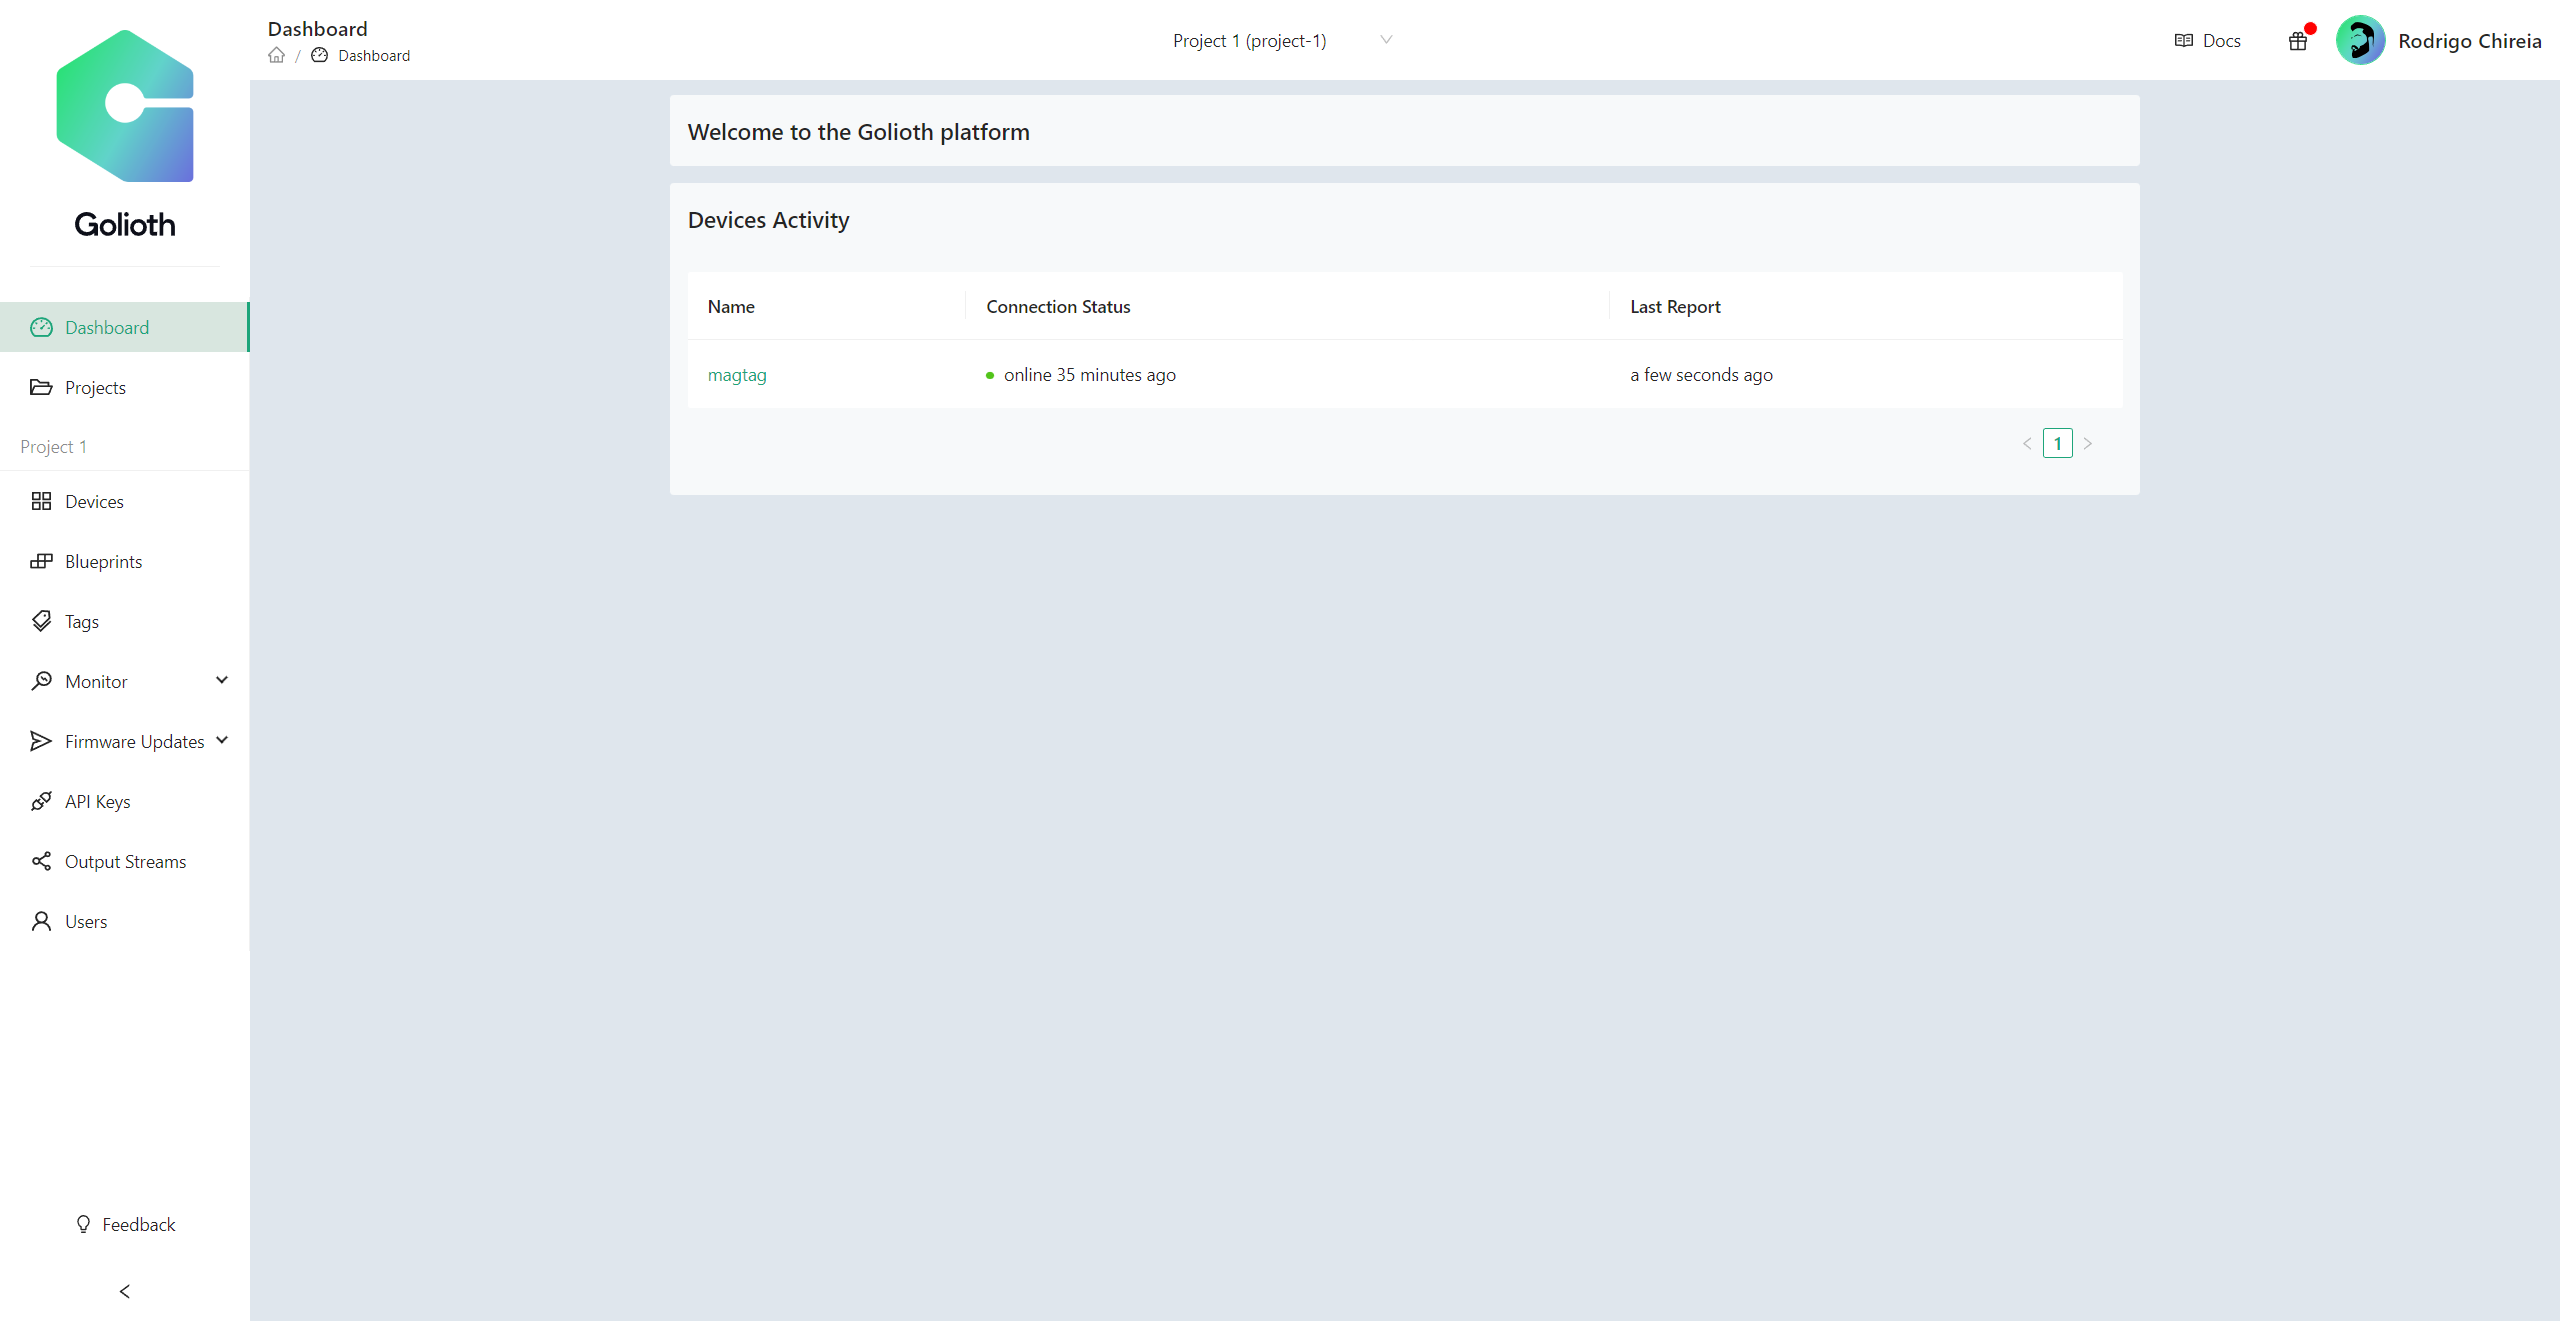
As you grow from dozens of devices to hundreds (and beyond), the Golioth settings service makes sure you can change device settings and confirm that those changes were received.
Demonstrating the settings service
The settings service is ready for you use right now. We have code samples for the Golioth Zephyr SDK and the Golioth ESP-IDF SDK. Let’s take it for a spin using the Zephyr samples.
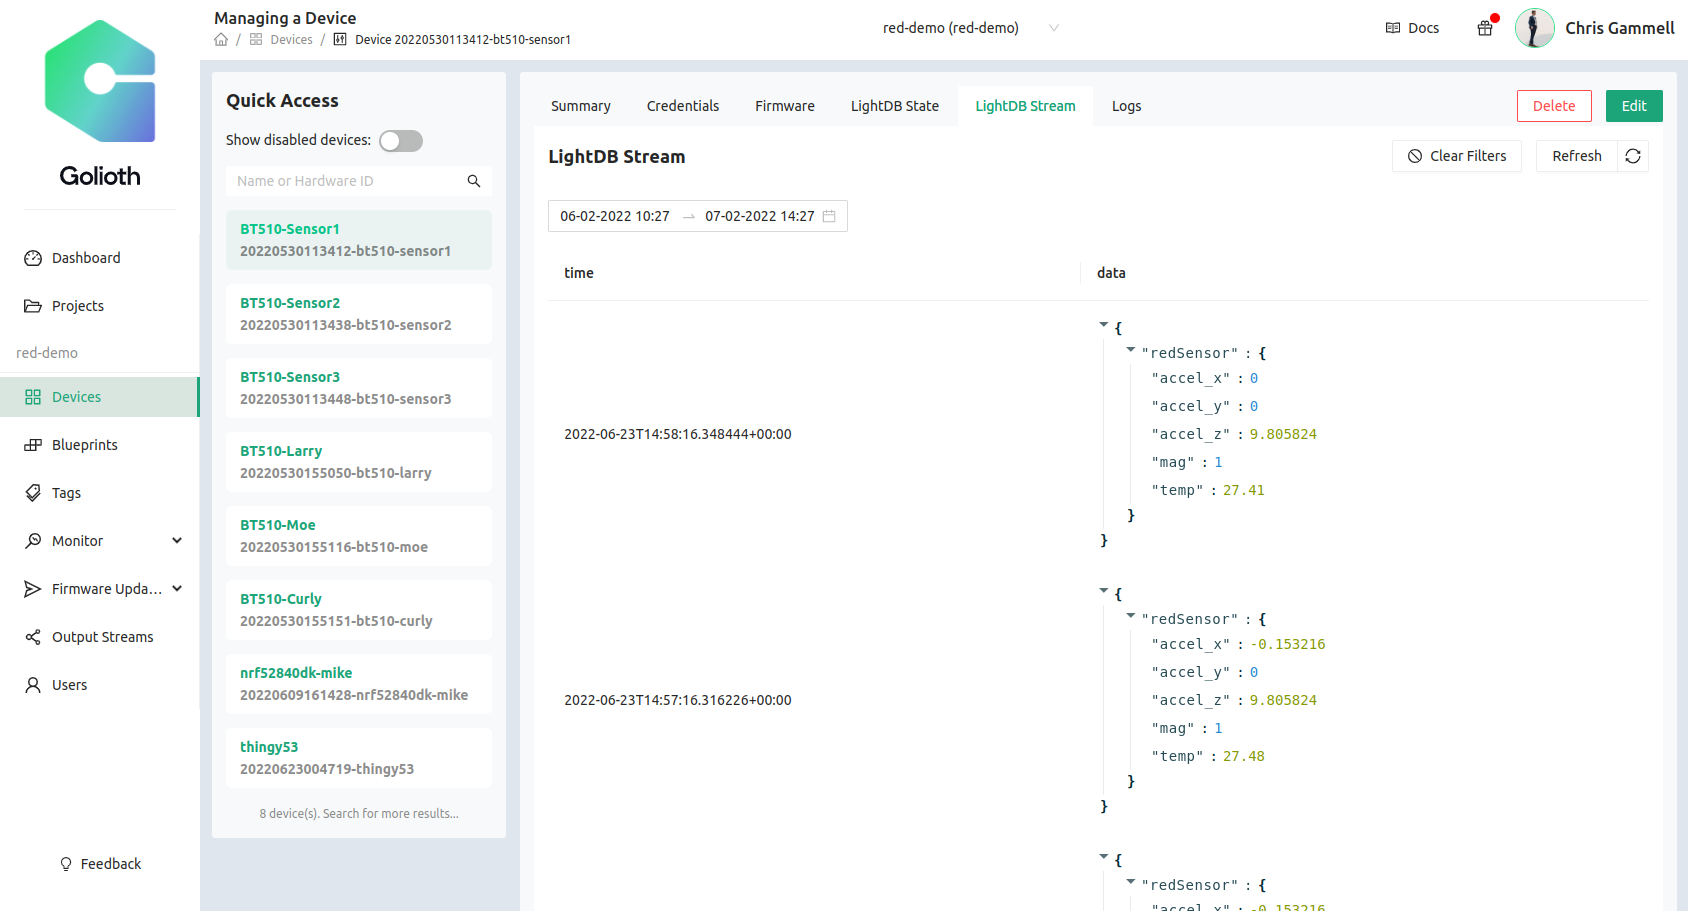
I’ve compiled and flashed the Golioth Settings sample for an ESP32 device. It observes a LOOP_DELAY_S endpoint and uses that value to decide how long to wait before sending another “Hello” log message.
Project-wide settings
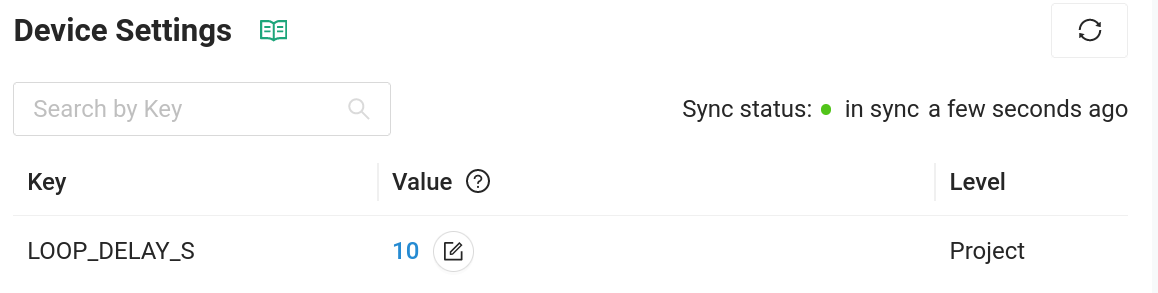
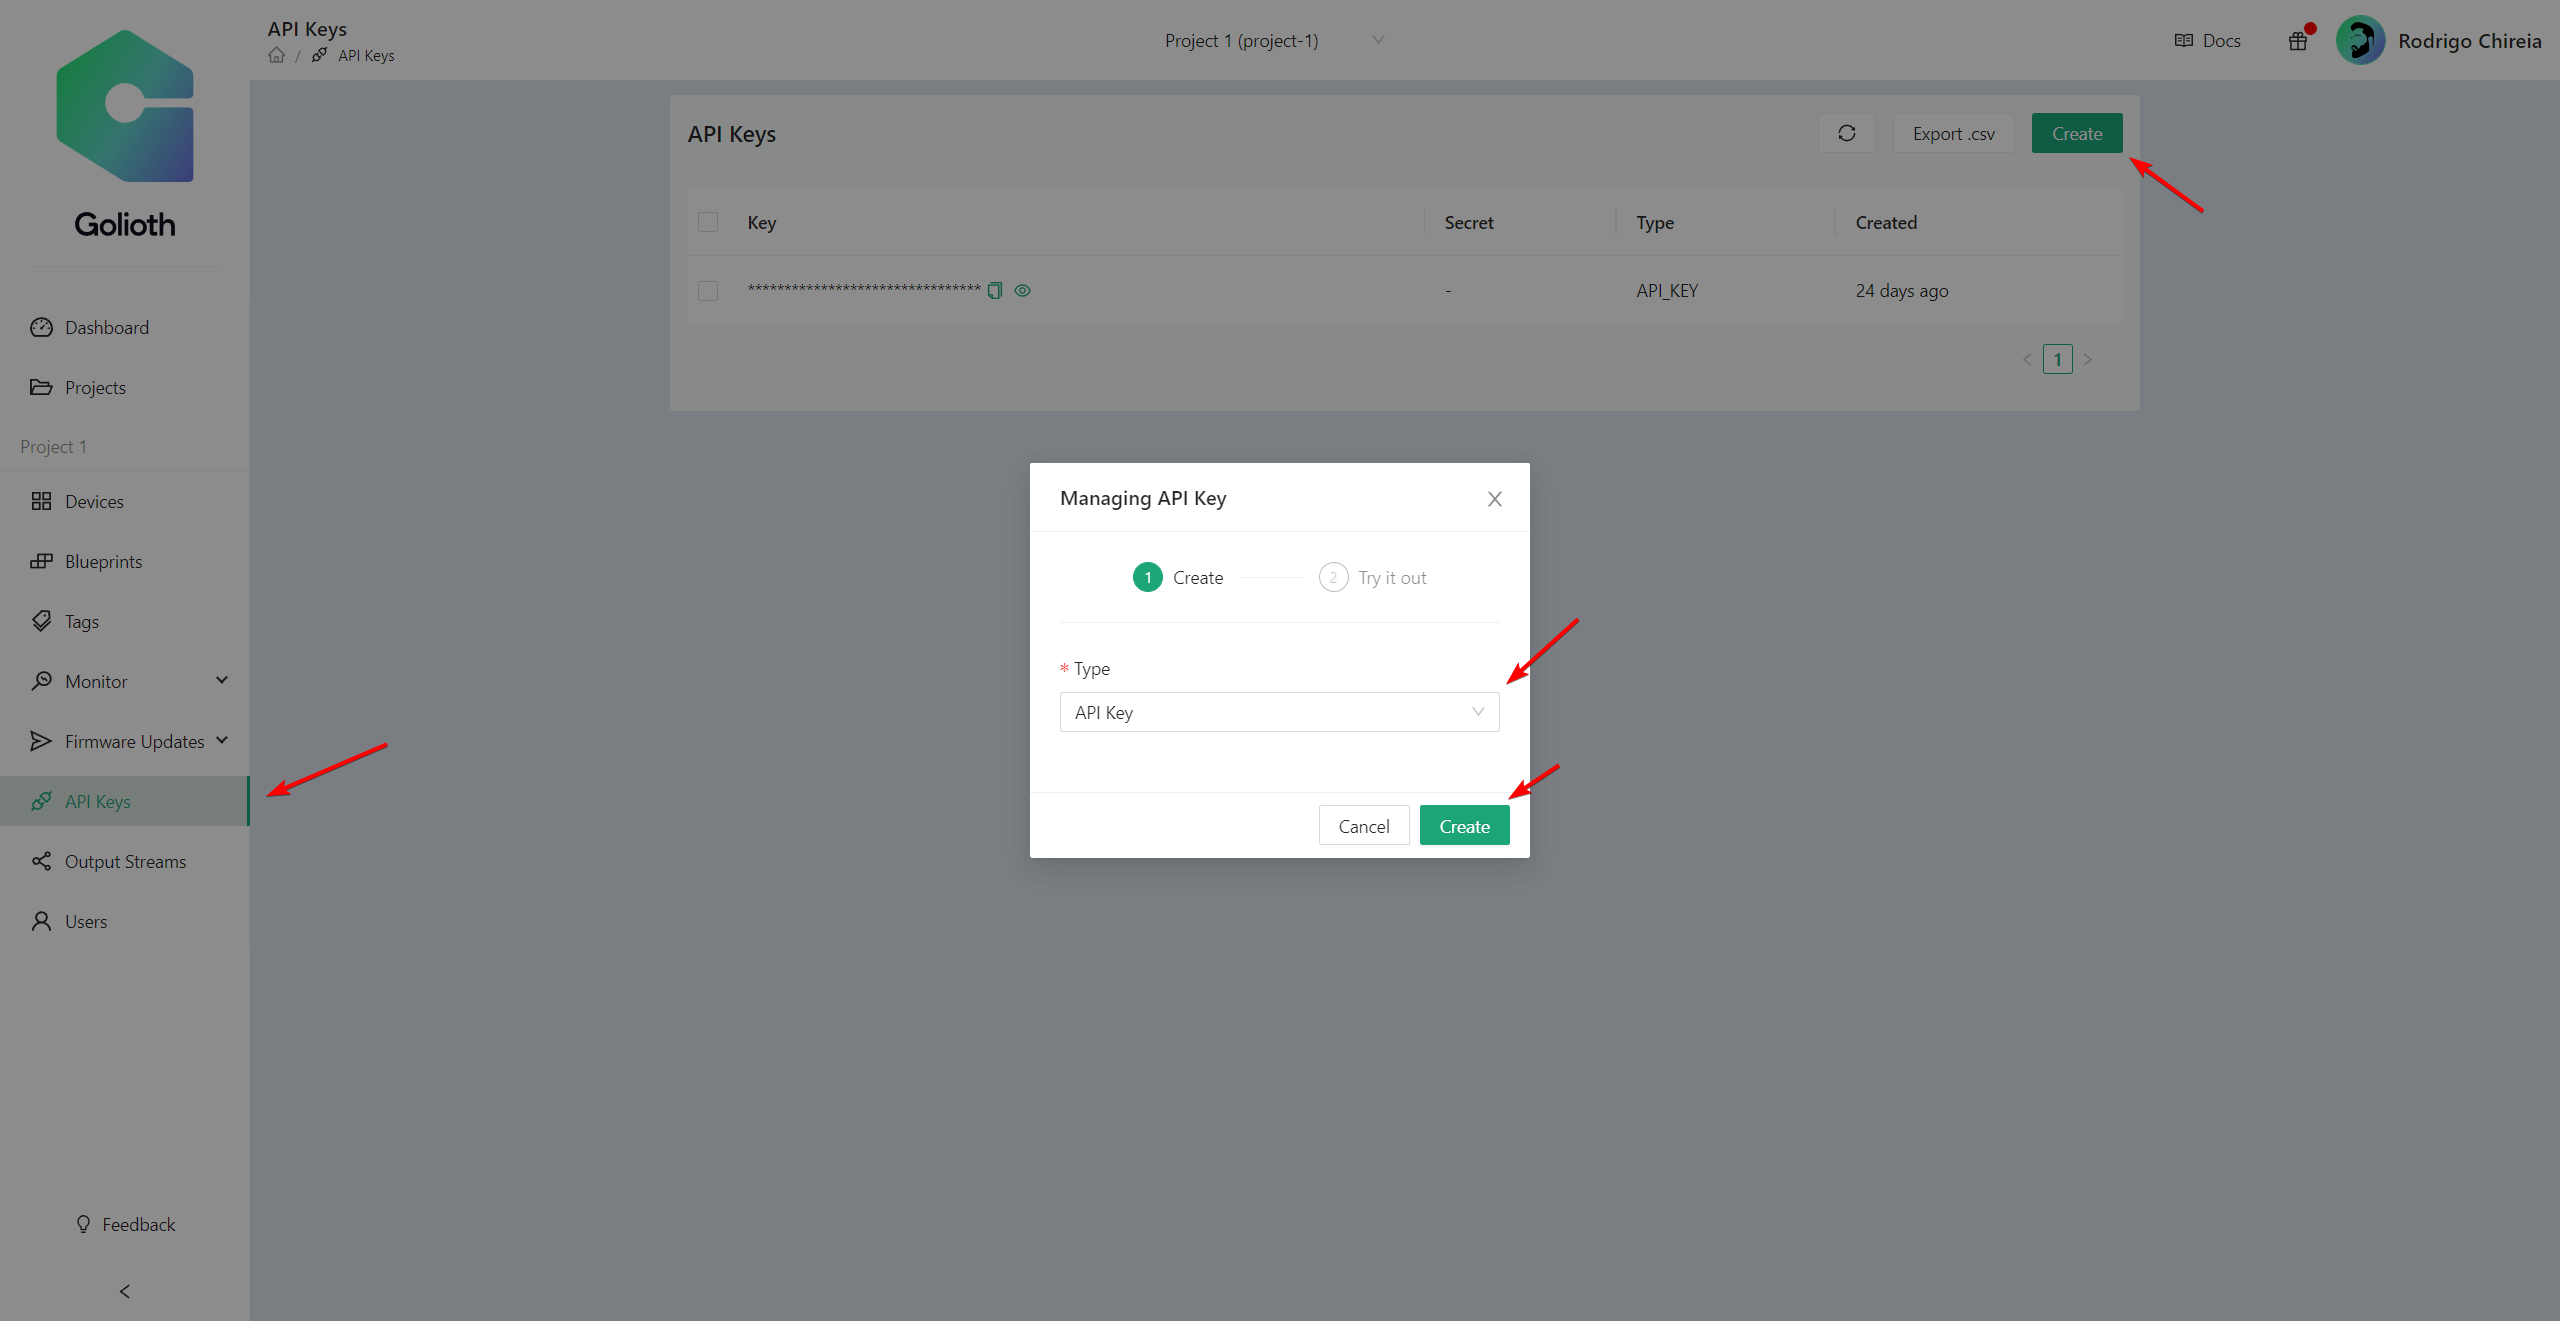
On the Golioth web console, I use the Device Settings option on the left sidebar to create the key/value pair for this setting. This is available to all devices in the project with firmware that is set up to observe the LOOP_DELAY_S settings endpoint.
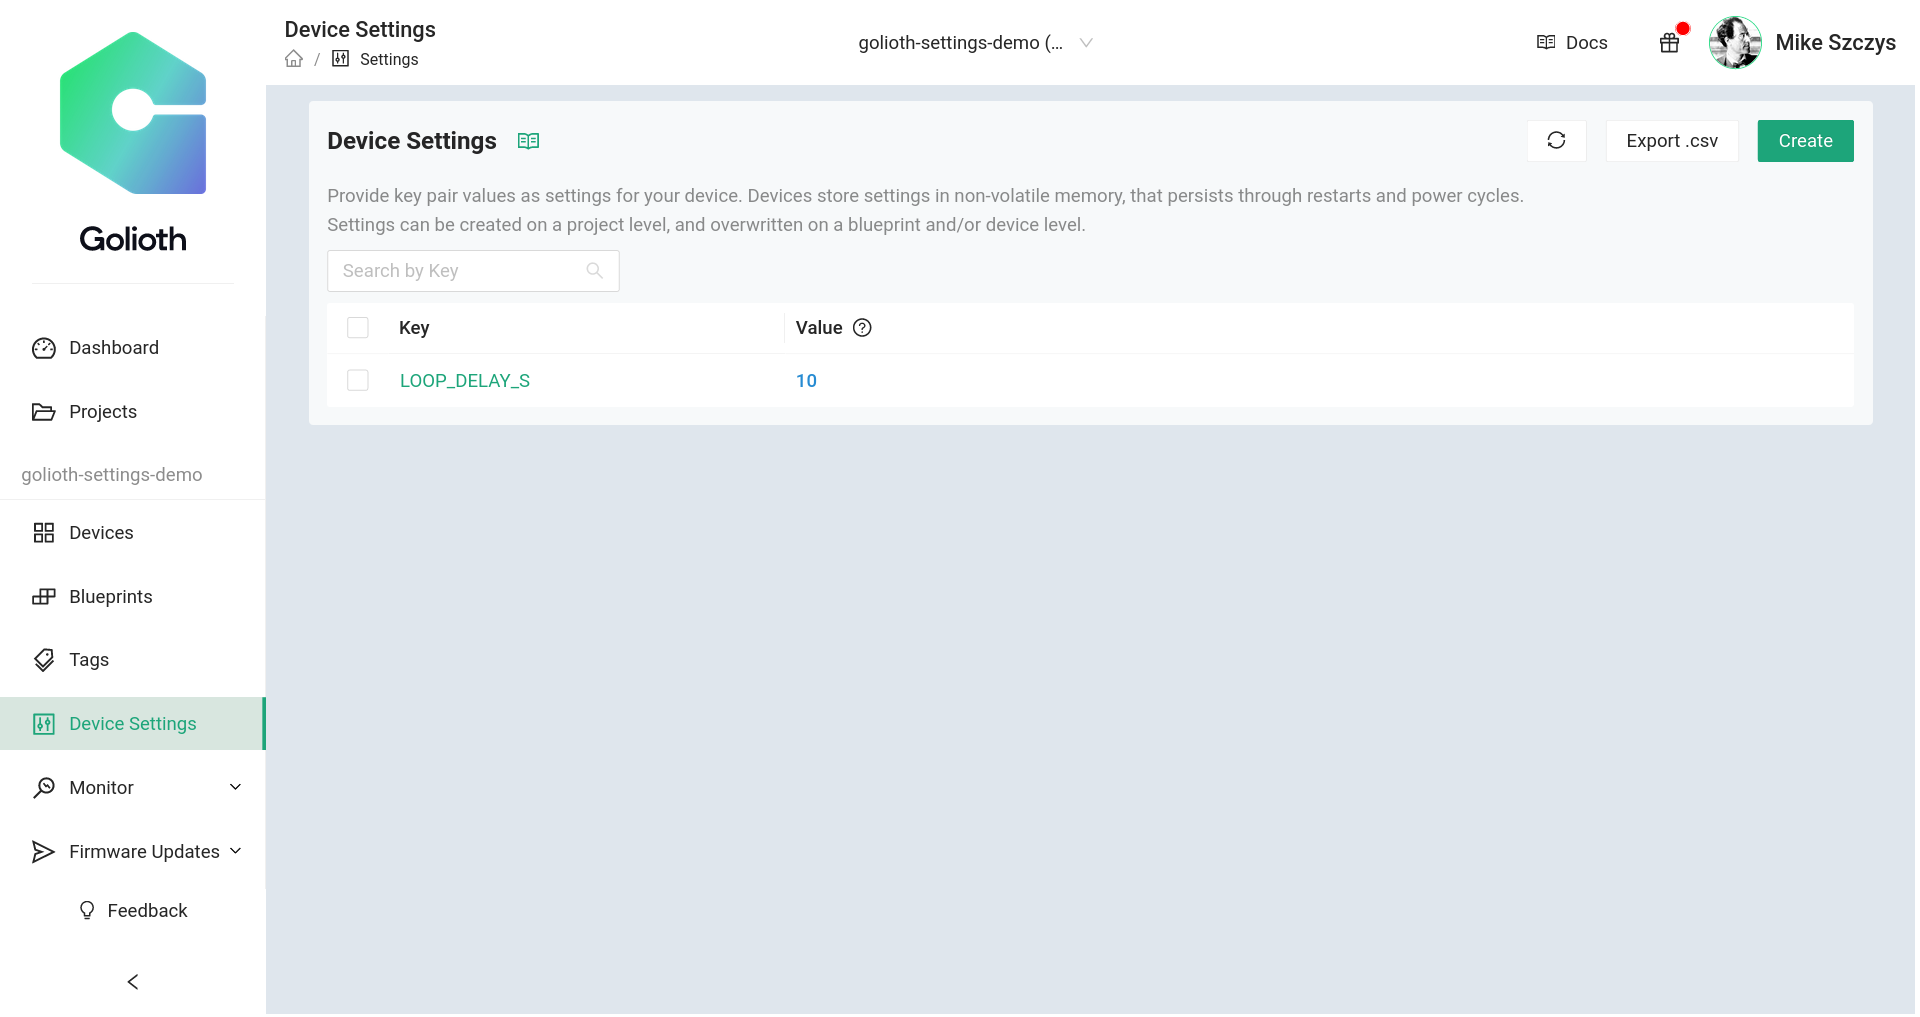
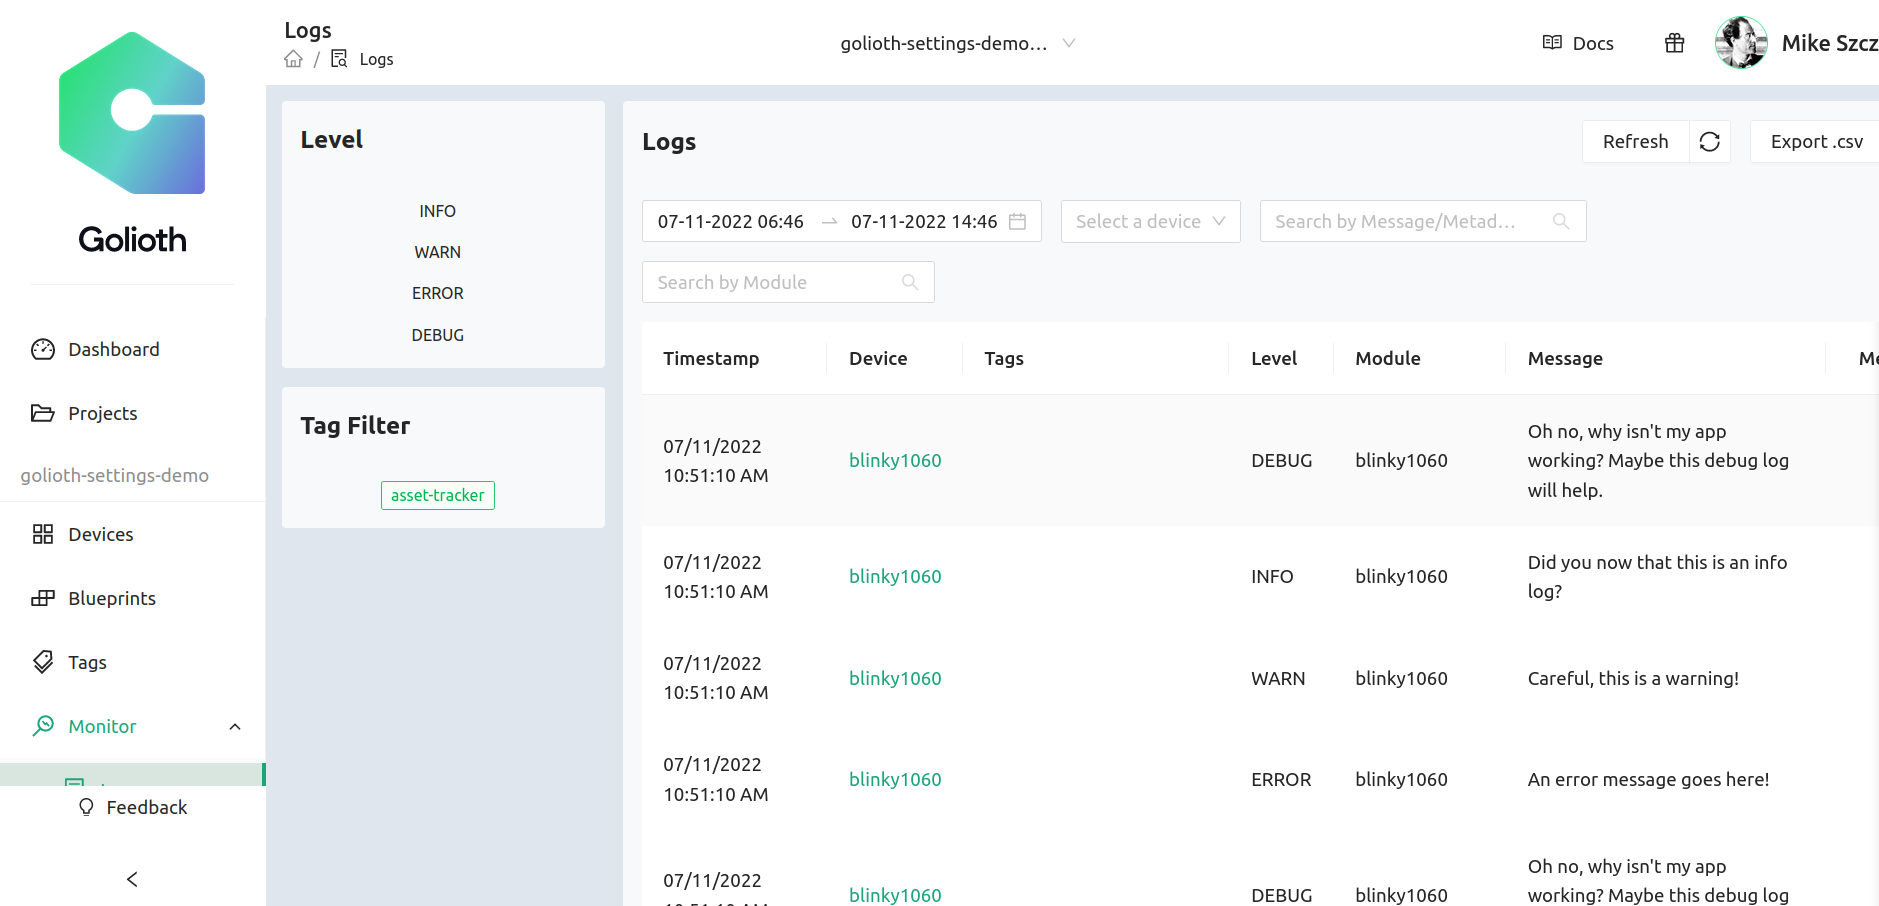
When viewing device logs, we can see the setting is observed as soon as the device connects to Golioth. The result is that the Hello messages are now issued ten seconds apart.
[00:00:19.930,000] <inf> golioth_system: Client connected!
[00:00:20.340,000] <inf> golioth: Payload
                                  a2 67 76 65 72 73 69 6f  6e 1a 62 e9 99 c4 68 73 |.gversio n.b...hs
                                  65 74 74 69 6e 67 73 a1  6c 4c 4f 4f 50 5f 44 45 |ettings. lLOOP_DE
                                  4c 41 59 5f 53 fb 40 24  00 00 00 00 00 00       |LAY_S.@$ ......
[00:00:20.341,000] <dbg> golioth_hello: on_setting: Received setting: key = LOOP_DELAY_S, type = 2
[00:00:20.341,000] <inf> golioth_hello: Set loop delay to 10 seconds
[00:00:20.390,000] <inf> golioth_hello: Sending hello! 2
[00:00:30.391,000] <inf> golioth_hello: Sending hello! 3
[00:00:40.393,000] <inf> golioth_hello: Sending hello! 4
Settings by device or by blueprint
Of course, you don’t always want to have the same settings for all devices. Consider debugging a single device. It doesn’t make much sense to turn up the logging level or frequency of sensor reads for all devices. So with Golioth it’s easy to change the setting on just a single device.

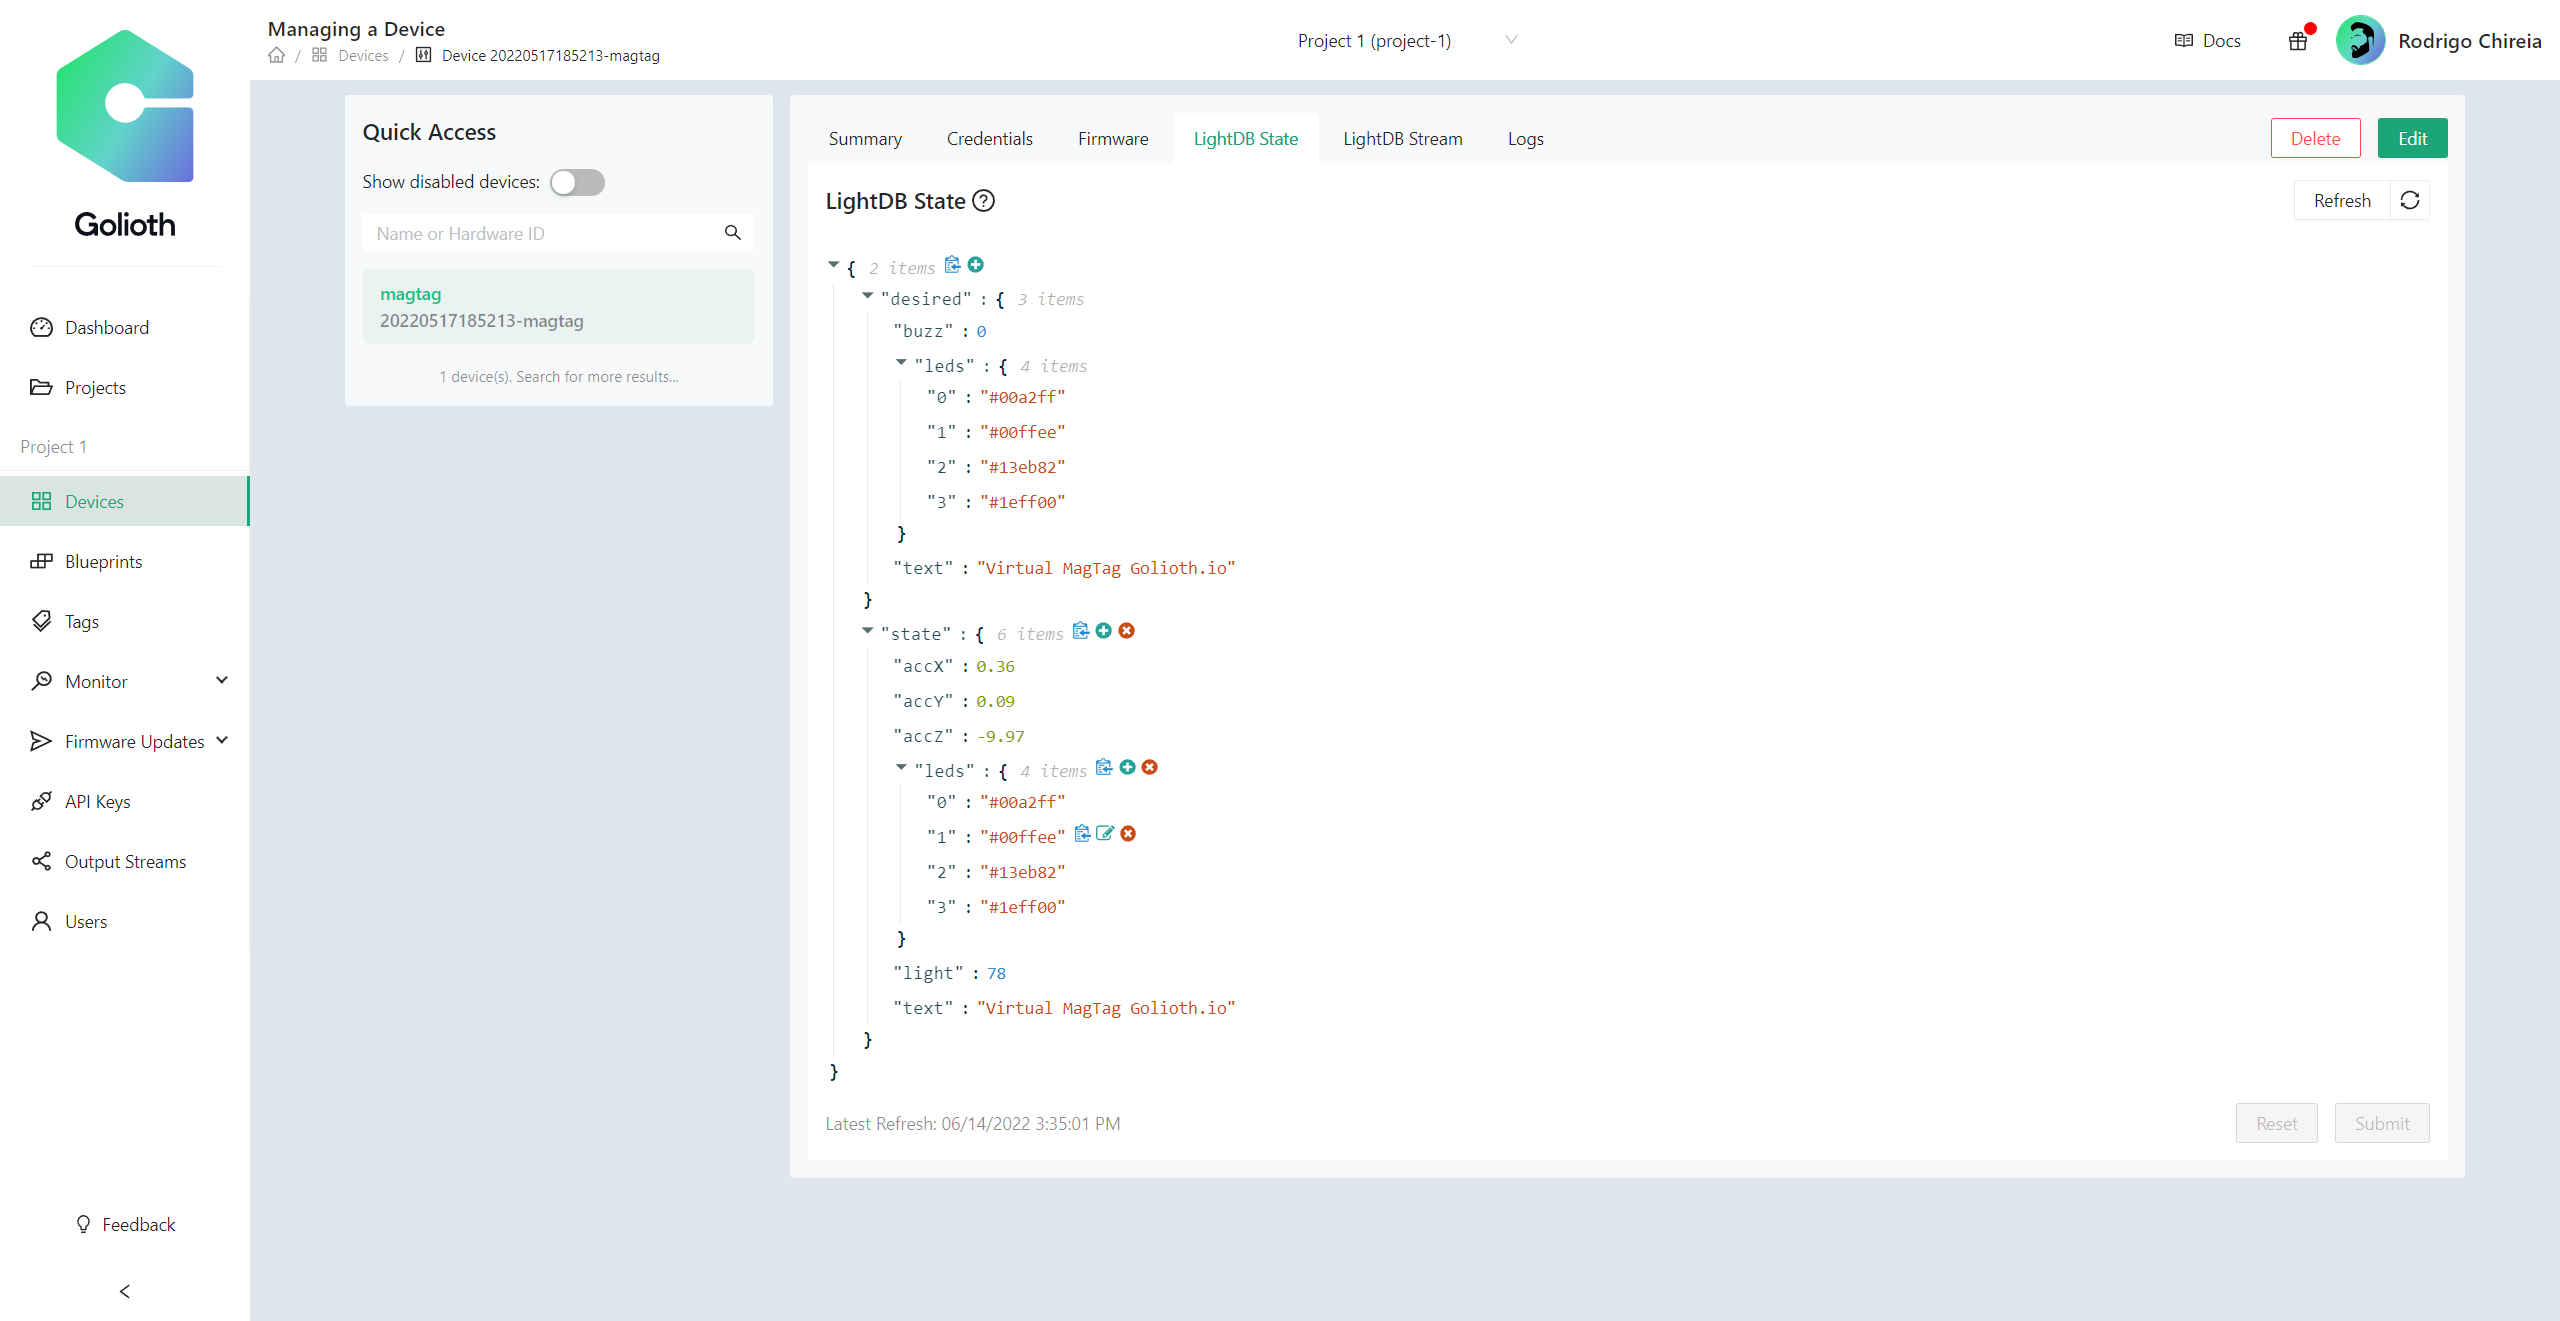
In the device view of the Golioth web console there is a settings tab. Here you can see the key, the value, and the level of the value. I have already changed the device-specific value in this screen so the level is being reported as “Device”.
[00:07:30.466,000] <inf> golioth_hello: Sending hello! 45
[00:07:40.468,000] <inf> golioth_hello: Sending hello! 46
[00:07:43.728,000] <inf> golioth: Payload
                                  a2 67 76 65 72 73 69 6f  6e 1a 62 e9 9c 17 68 73 |.gversio n.b...hs
                                  65 74 74 69 6e 67 73 a1  6c 4c 4f 4f 50 5f 44 45 |ettings. lLOOP_DE
                                  4c 41 59 5f 53 fb 40 00  00 00 00 00 00 00       |LAY_S.@. ......
[00:07:43.729,000] <dbg> golioth_hello: on_setting: Received setting: key = LOOP_DELAY_S, type = 2
[00:07:43.729,000] <inf> golioth_hello: Set loop delay to 2 seconds
[00:07:50.469,000] <inf> golioth_hello: Sending hello! 47
[00:07:52.471,000] <inf> golioth_hello: Sending hello! 48
When I made the change. the device was immediately notified and you can see from the timestamps that it began logging at a two-second cadence as expected.
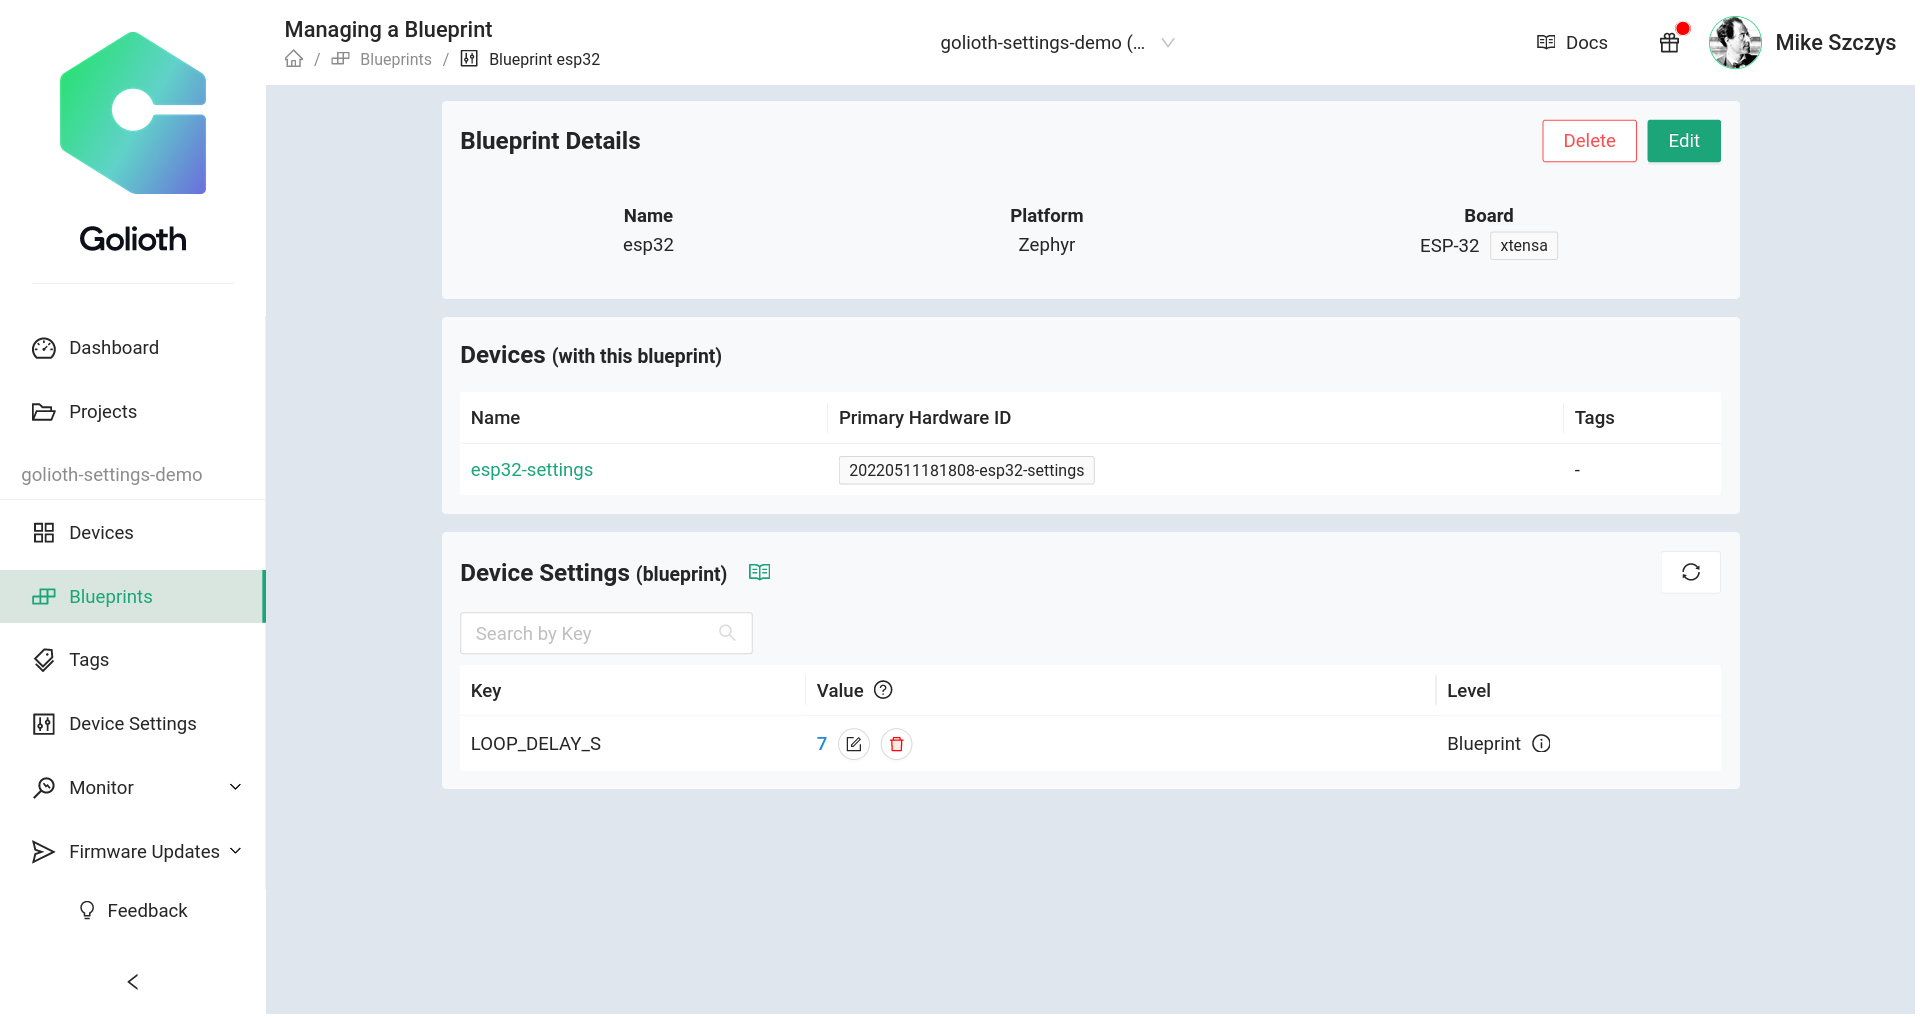
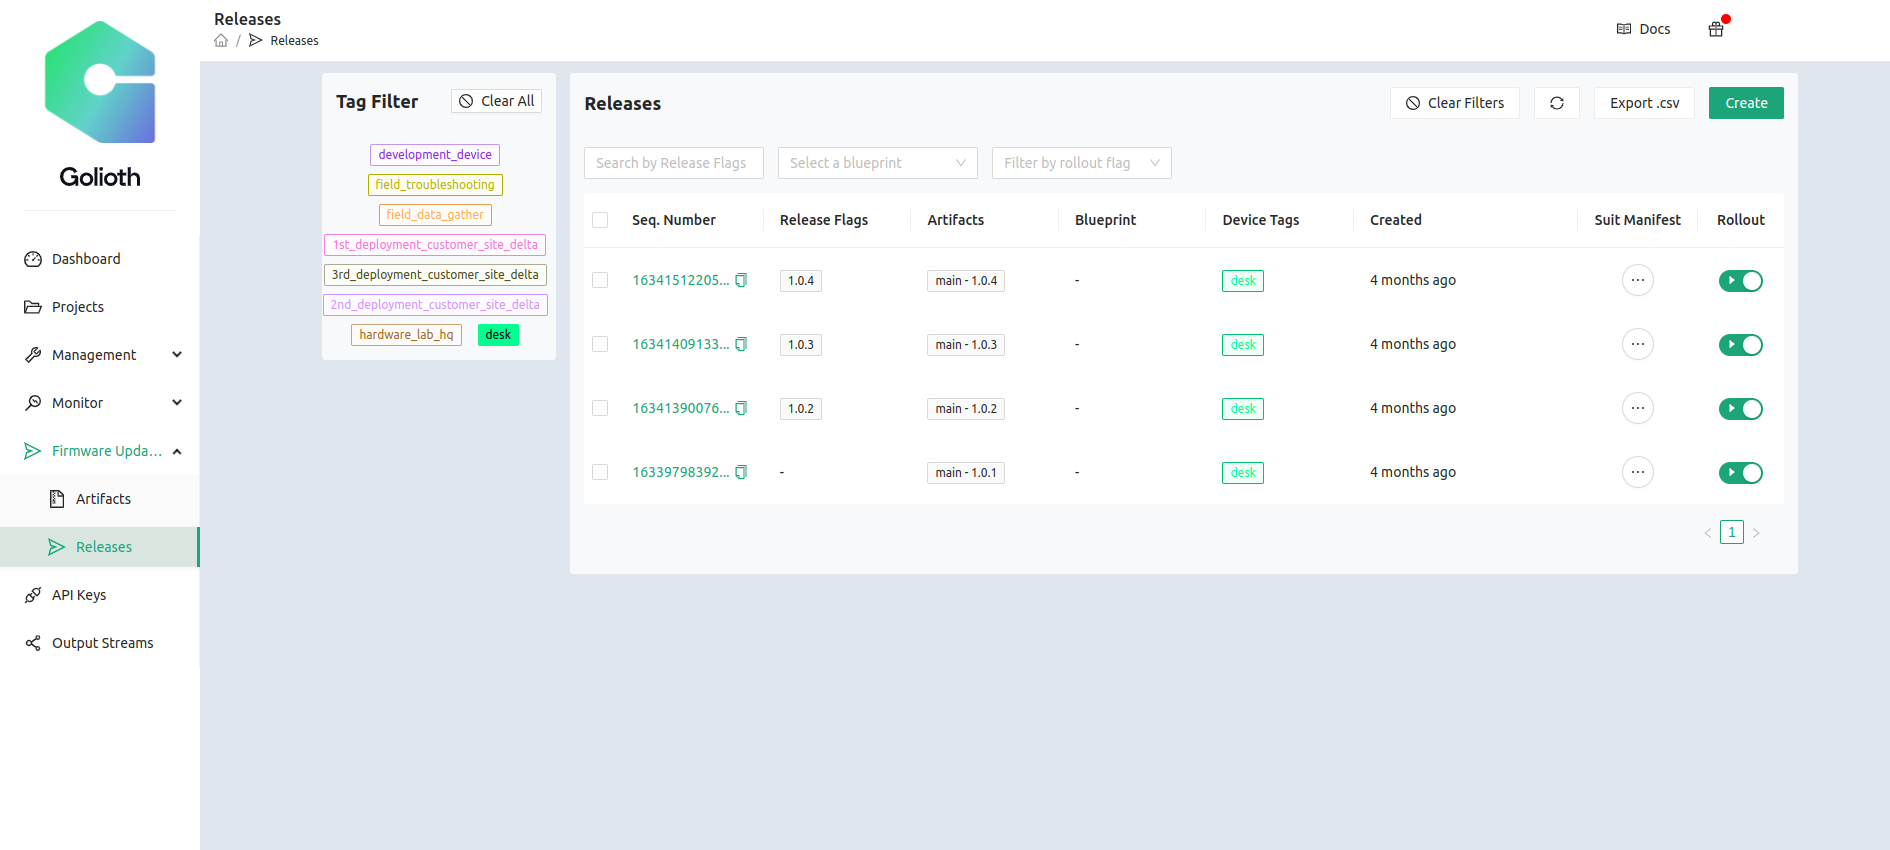
It is also possible to change settings for a group of devices that share a common blueprint. Here you will find this setting by selecting Blueprint from the left sidebar and choosing your desired blueprint.
Settings are applied based on specificity. The device-level is the most specific and will be applied first, followed by blueprint-level, and finally project-level. Blueprints may be created and applied at any time, so if you later realize you need a more specific group you can change the blueprint for those devices.
Implementation: The two parts that make up the settings service
Fundamentally, there are two parts that make our device settings system work: the Golioth cloud services running on our servers and your firmware that is running on the devices. The Golioth device SDKs allow you to register a callback function that receives settings values each time a change is made to the settings on the cloud. You choose how the device should react to these settings, like updating a delay value, enabling/disabling features, changing log output levels, really anything you want to do.
Don’t worry if you already have devices in the field. You can add the settings service or make changes to how your device handles those settings, then use the Golioth OTA firmware update system to push out the new behavior.
Take control of your fleet
Scale is the hope for most IoT companies, but it’s also where the pain of IoT happens. You need to know you can control your devices, securely communicate with them, and perform updates as necessary. Golioth has you covered in all of these areas. The new settings service ensures that your ability to change how your fleet is performing doesn’t become outpaced by your growth.


 Royalty free structured beams image source: https://pixabay.com/photos/structure-beams-engineering-839656/