Golioth is all about sharing ideas and knowledge. This now includes our hardware, which today has been released as open source under the CERN OHL-P license. The Aludel Elixir and Ostentus are available on GitHub as KiCad projects and you can use them to start building your own designs.
The Aludel Platform
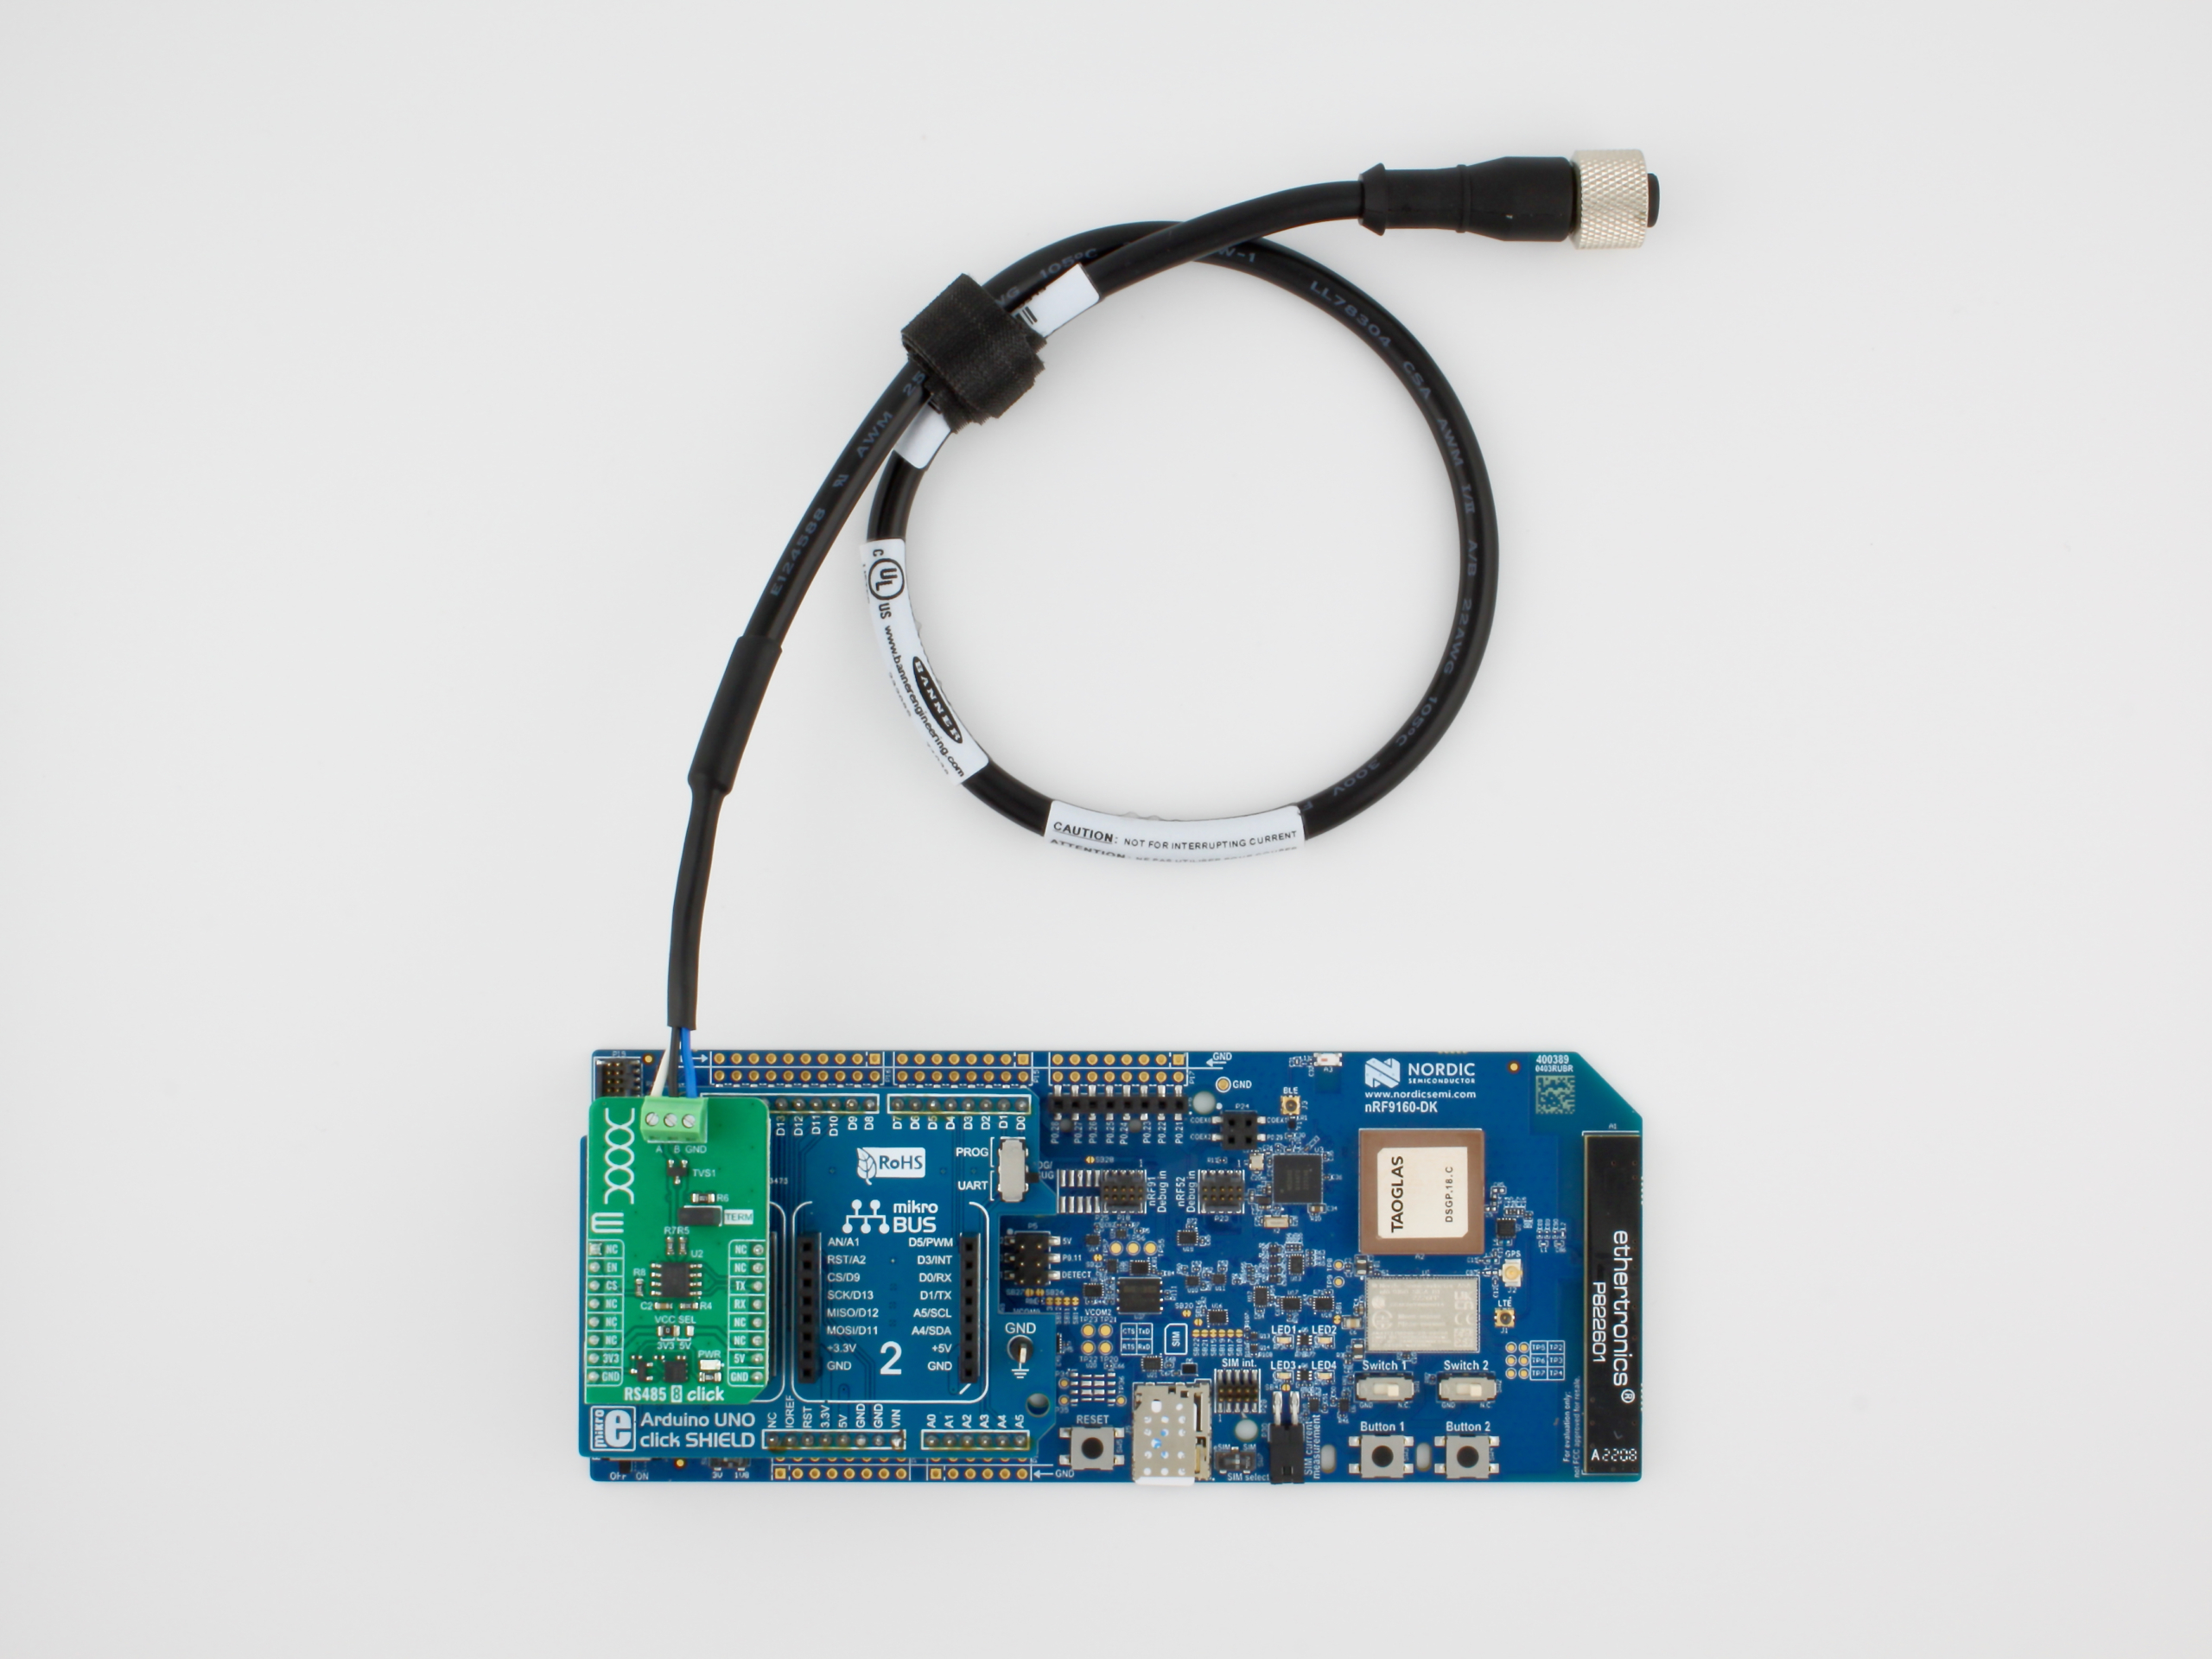
As an IoT platform that doesn’t build or sell commercial hardware, we still need to find ways to highlight the capabilities our platform offers. This often includes building on top of development boards from our various partners. Engineers are used to starting from well known vendor platforms, like some of our favorites which are in the list of Continuously Verified Boards (CVBs) on the Golioth platform:
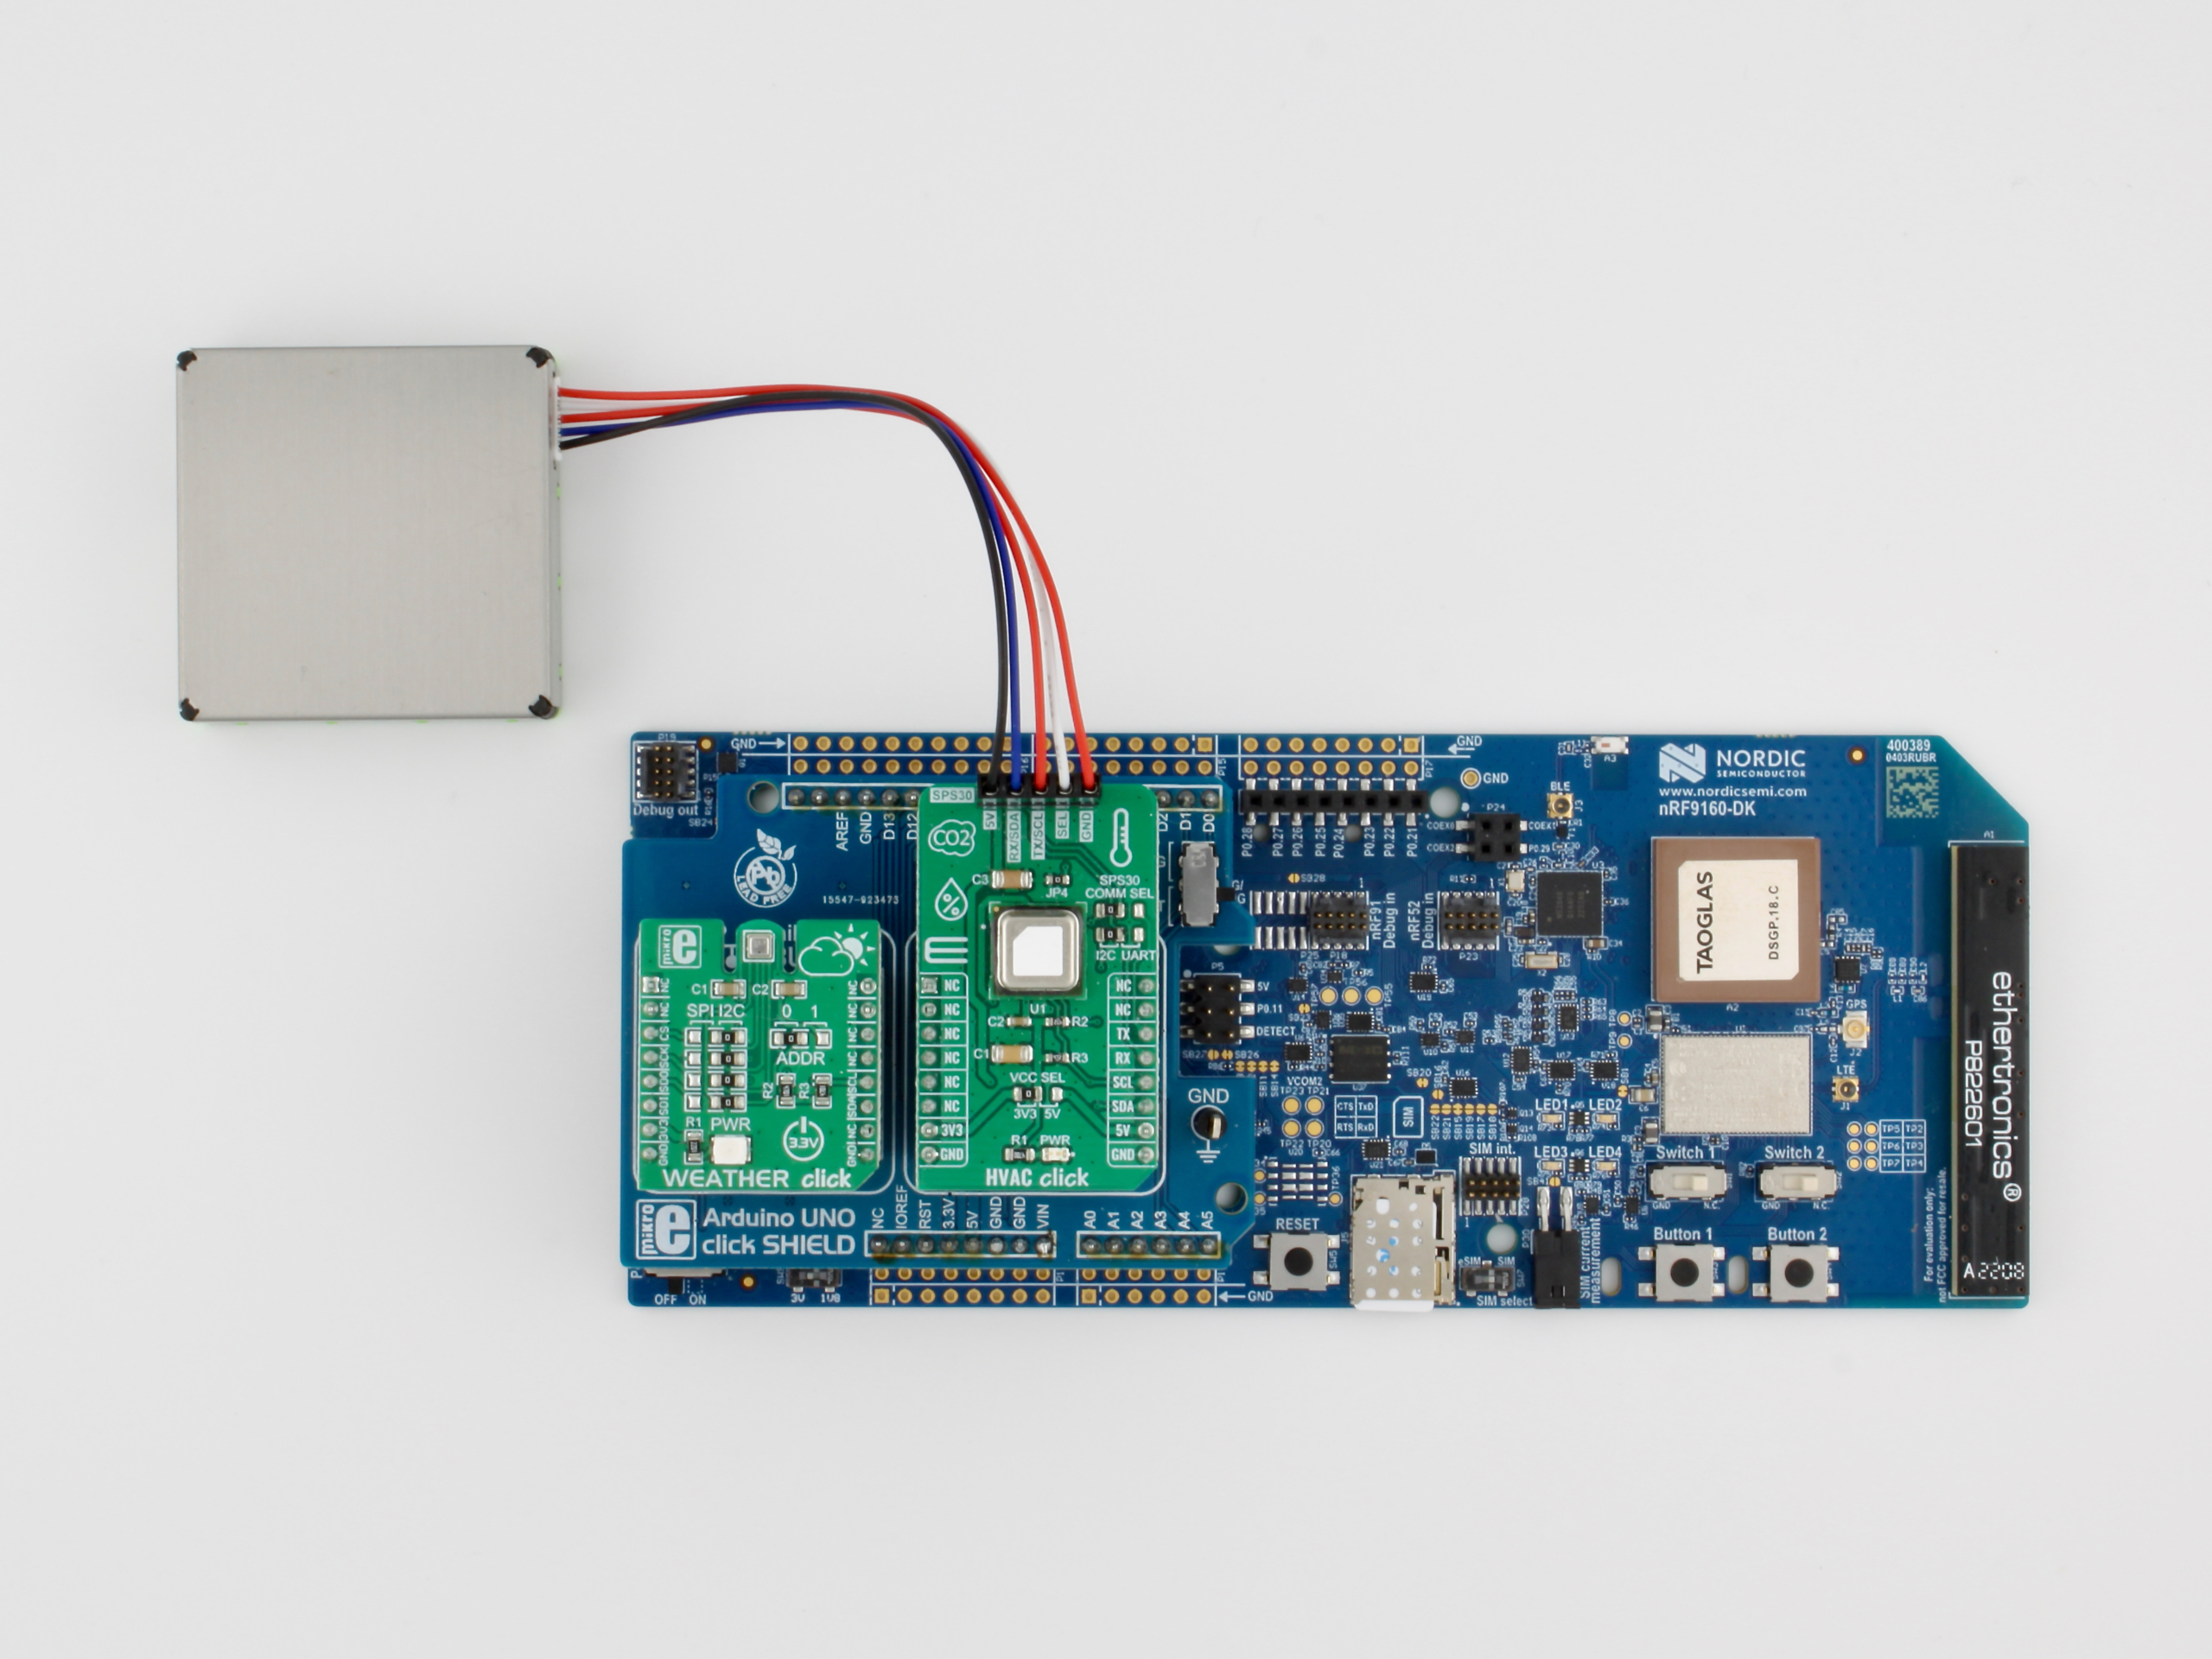
- Nordic Semiconductor nRF9160-DK
- NXP i.MX RT1024-EVK
- Espressif ESP32
- Quectel / RAK Wireless RAK5010
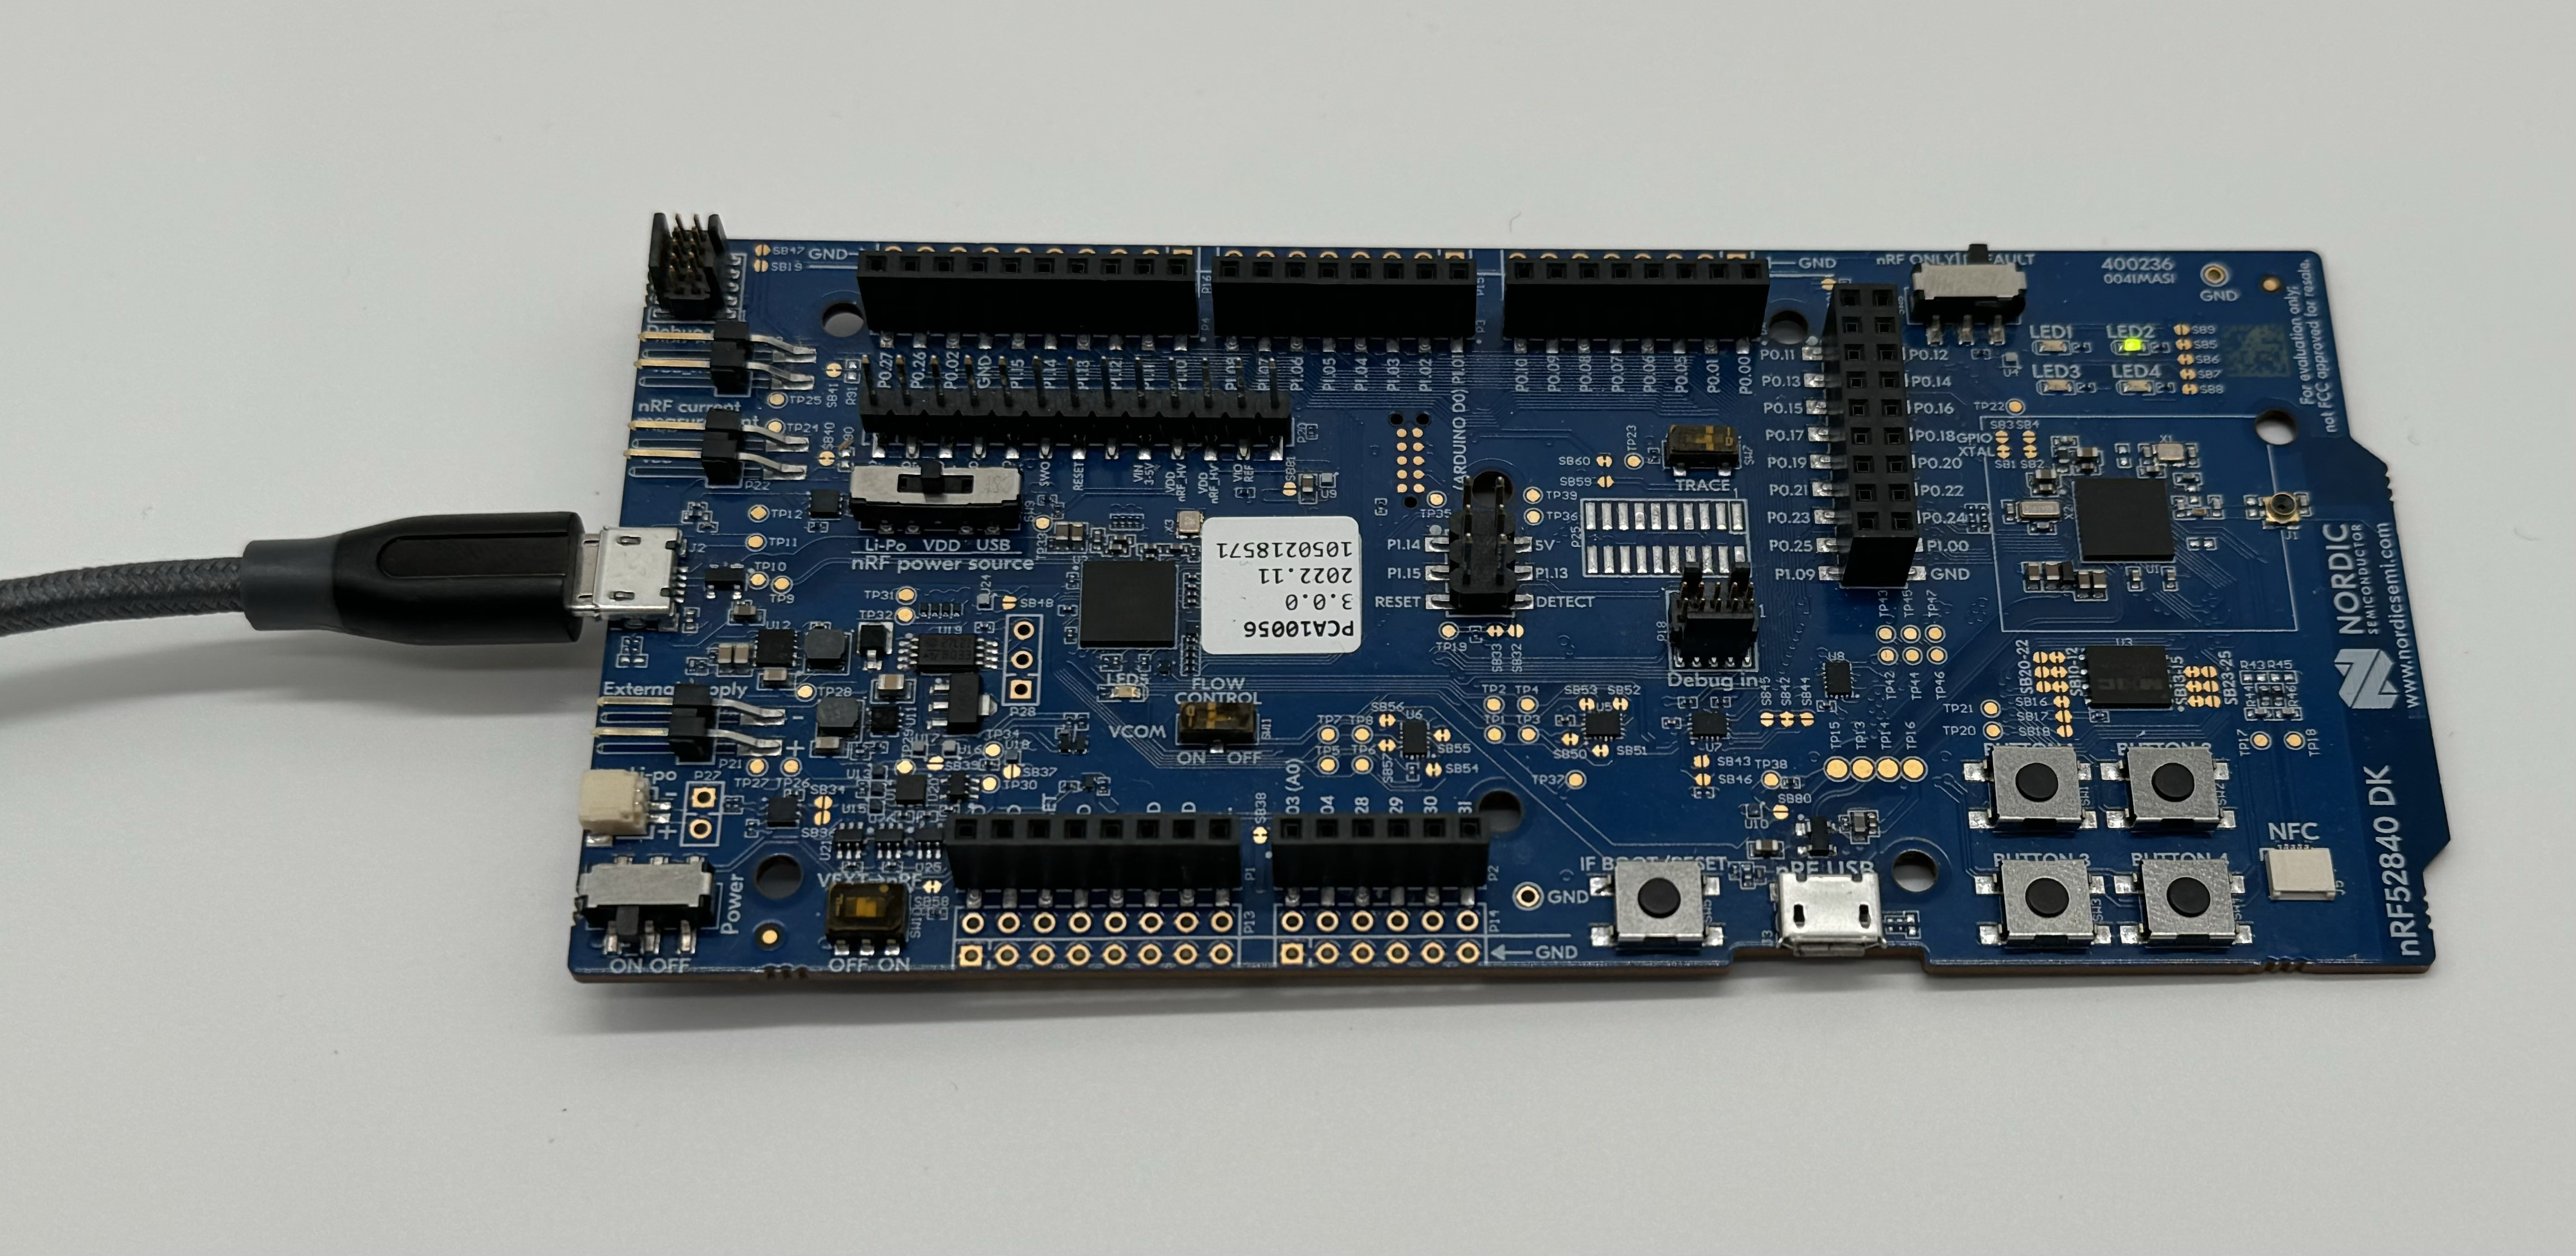
- Nordic Semiconductor nRF52840-DK (with ESP32 modem offload)
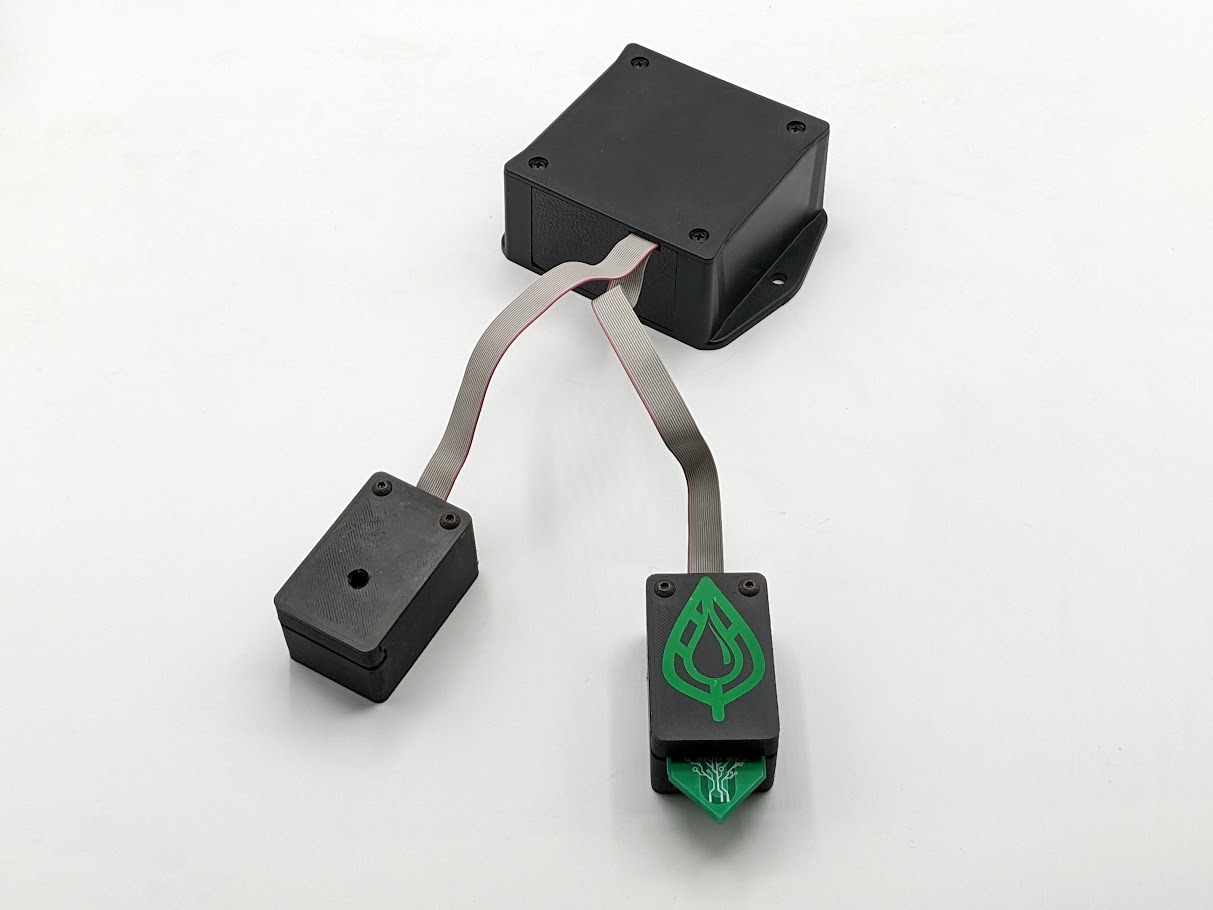
When you’re ready to start building devices that look more like real-world products, however, it becomes a bit bulky to use the easy-to-access development platforms. We knew we wanted to capture this “magic in a box”, which was the genesis of the name — an “aludel” was a sublimating pot in alchemy.
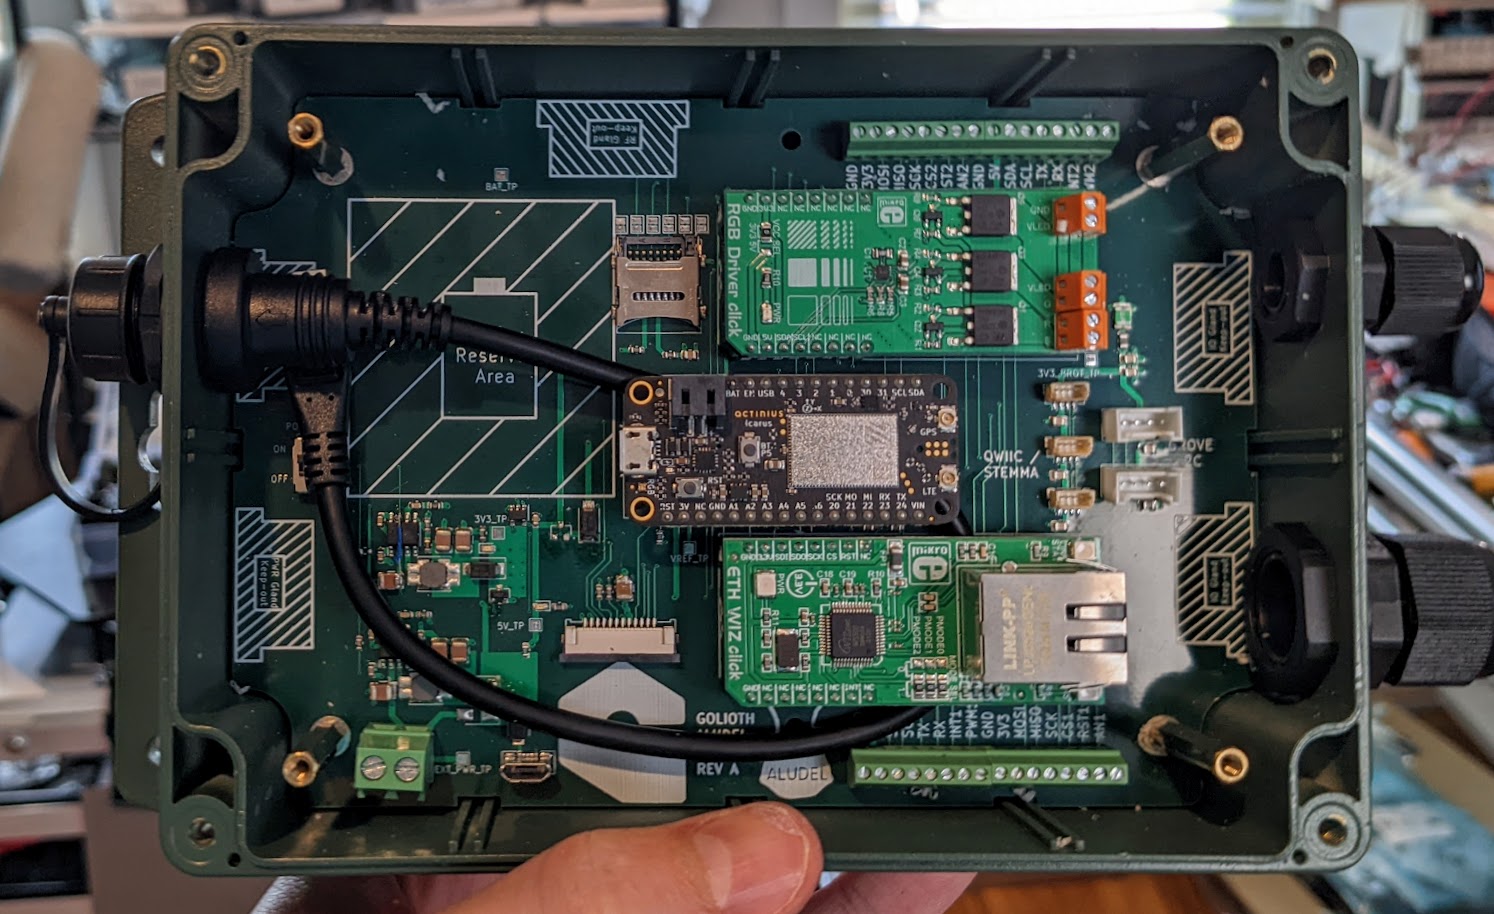
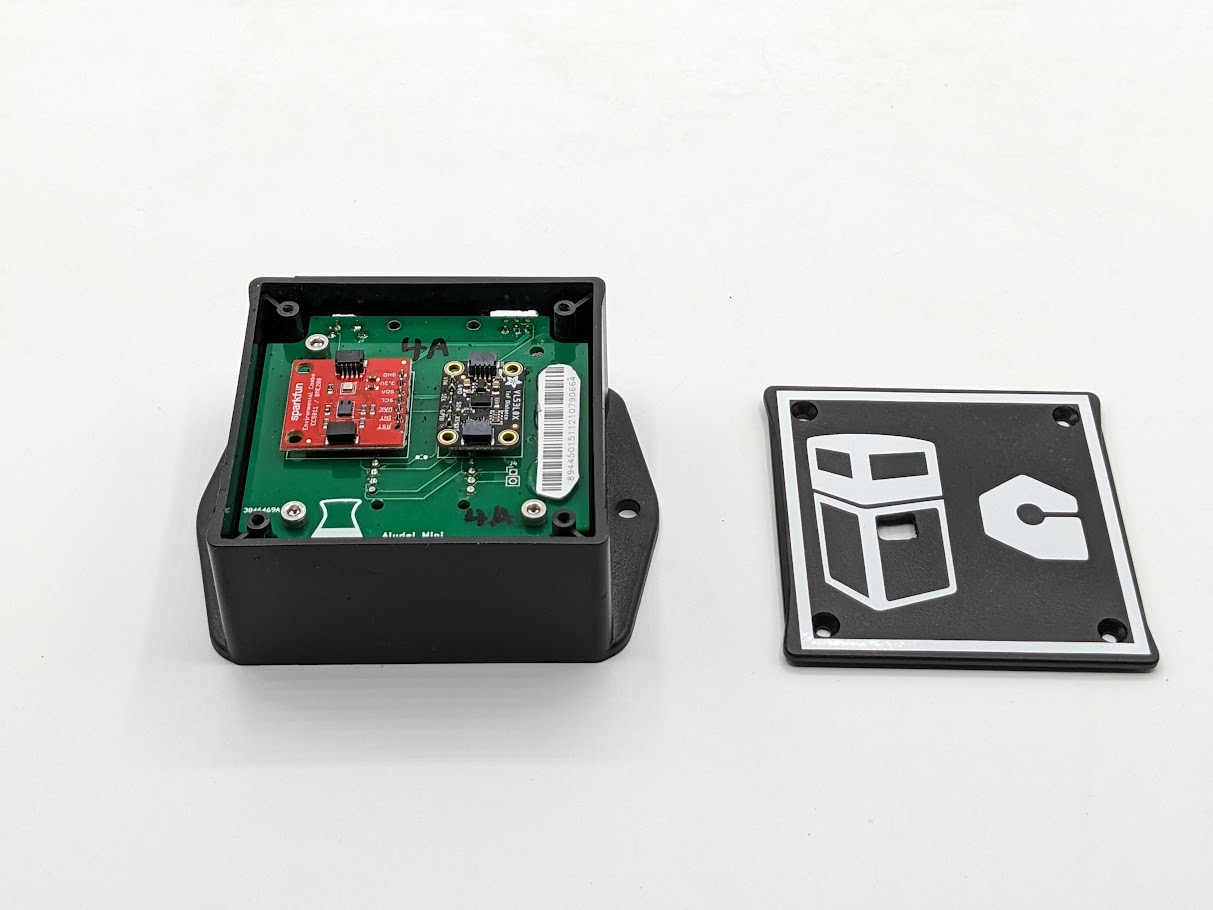
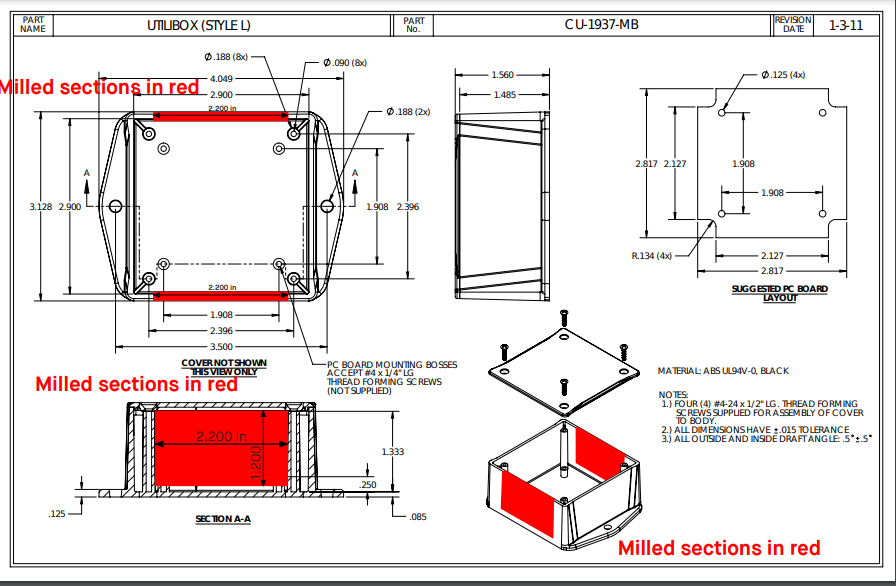
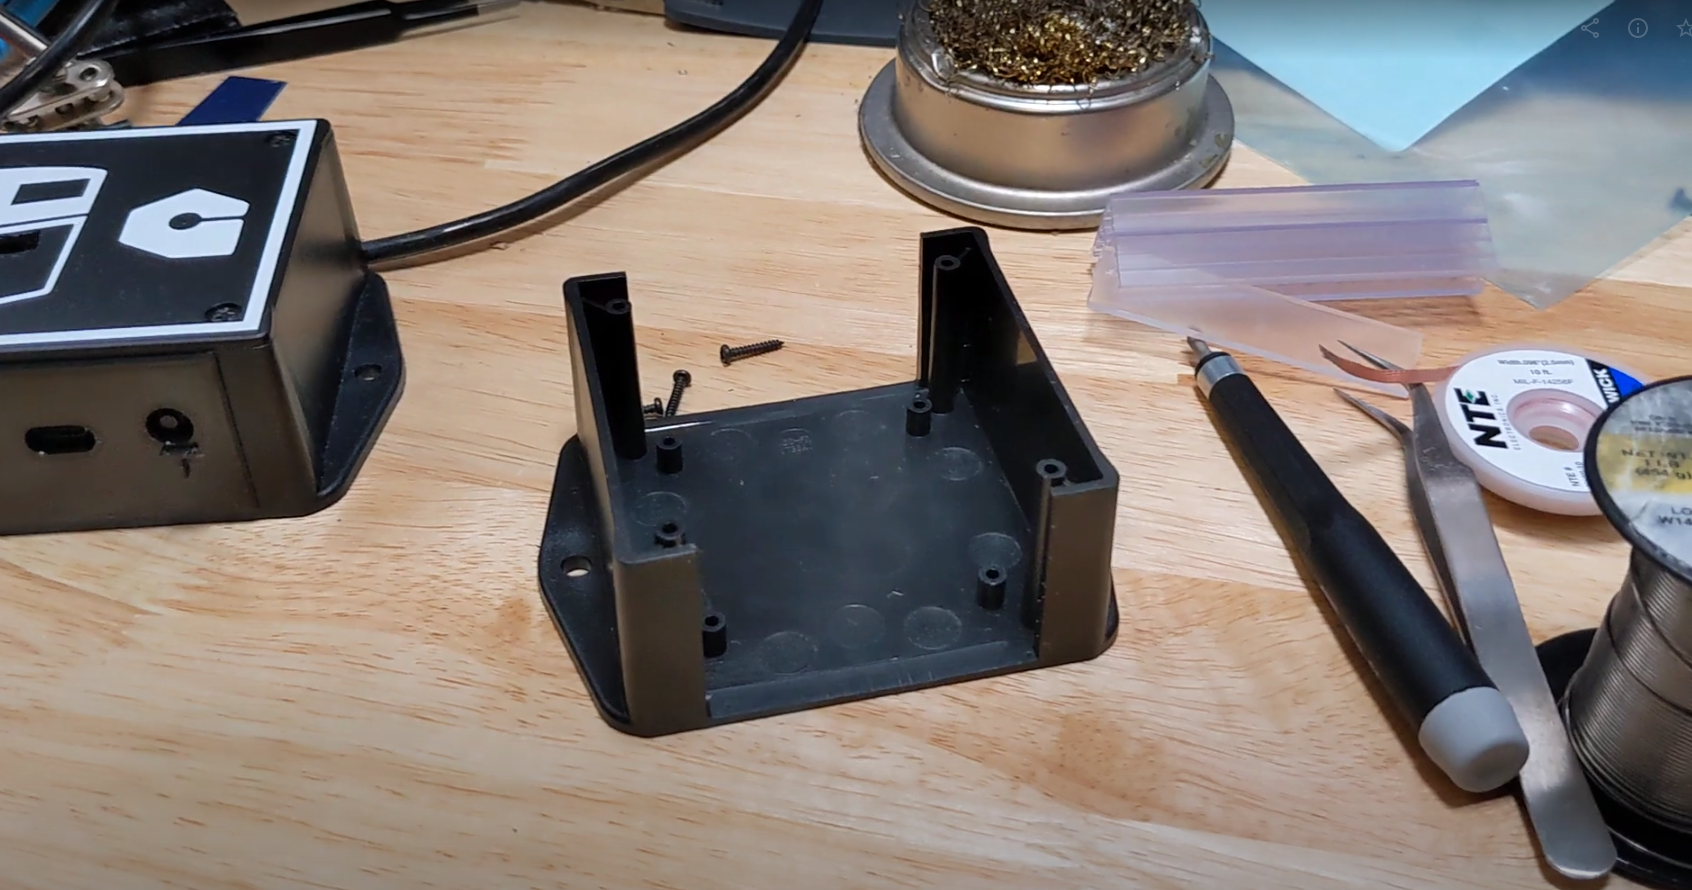
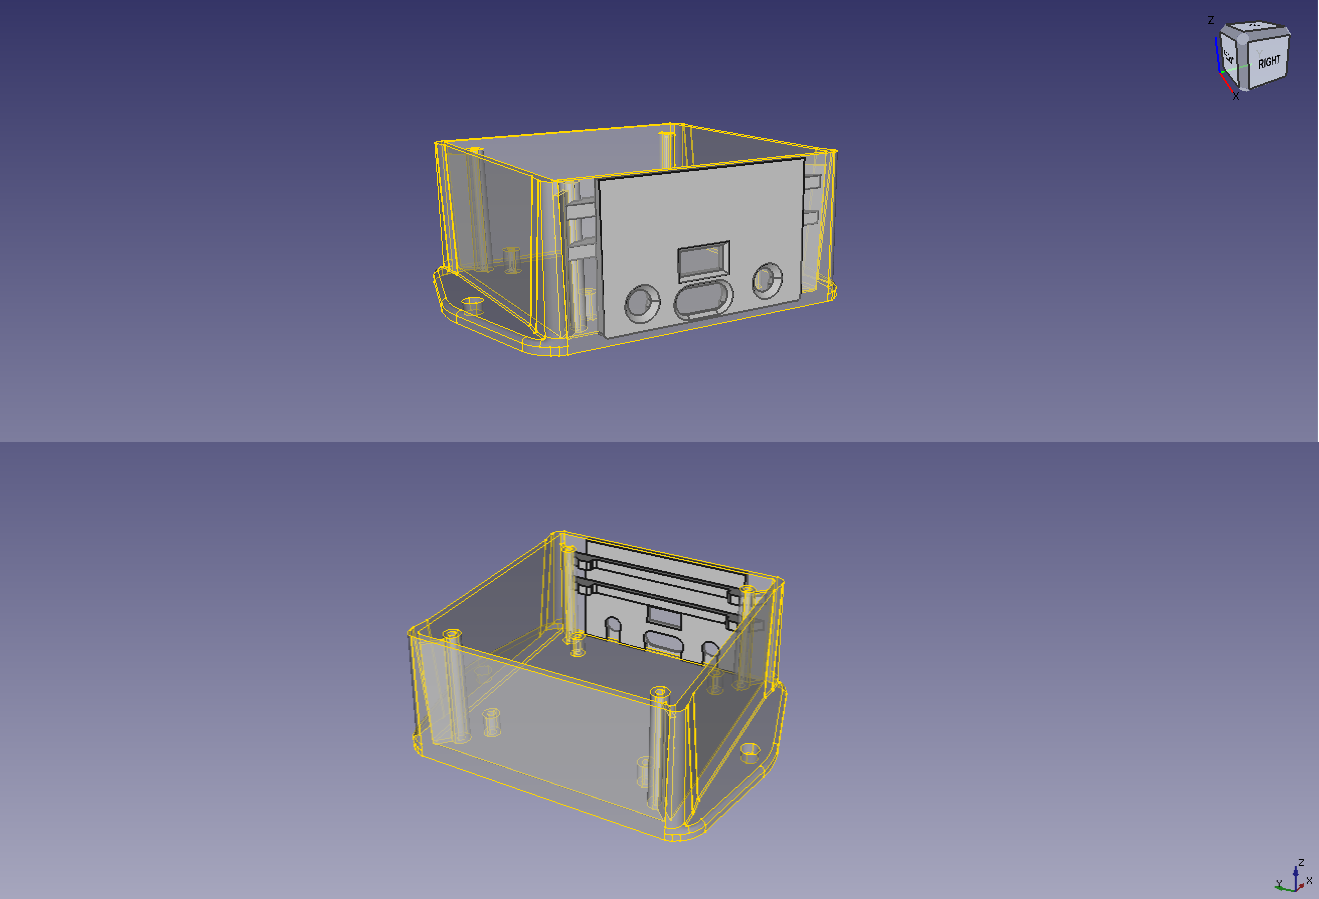
We started using alternative boards like the nRF9160 Feather from Circuit Dojo and encapsulating the Feather form factor in a box. The early Aludel boxes were much larger and included headers to plug in different boards. Over time, we knew we wanted to more closely approximate designs that will go out into the field, so we downsized to the current ‘Mini’ version that utilizes the Bud Industries CU-1937-MB Utilibox and then we started modifying it and adding 3D printing elements. That formed the basis of the new Aludel platform, which includes two boards we’re releasing today.
Elixir
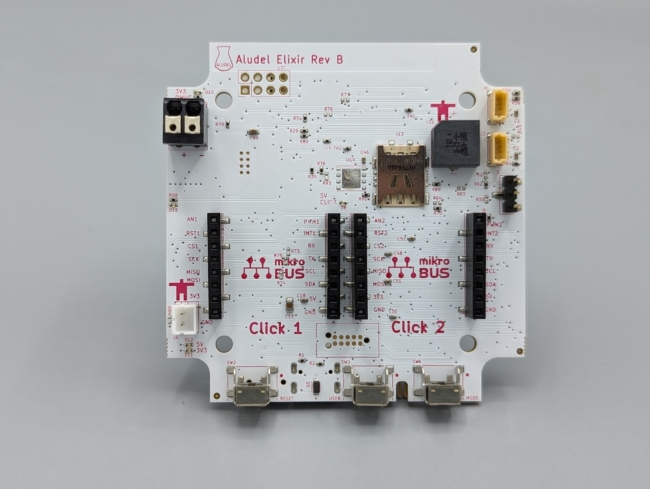
The Elixir Hardware Repository is now open source on GitHub
The Elixir board is a natural offshoot of the Aludel Mini form factor, including the new case we adopted. We had first created a board called the aludel-mini which you’ll see mentioned in some of our reference design repositories. This was an interposer board between a soldered down nRF9160 Feather and some mikroBUS Click headers. However, we started to experience some limitations with how the board operated and wanting to add other features. This is when we planned to build the Elixir.
The Elixir has many of the same elements from the OSHW Feather board, and adds on new capabilities that are common to many of our designs:
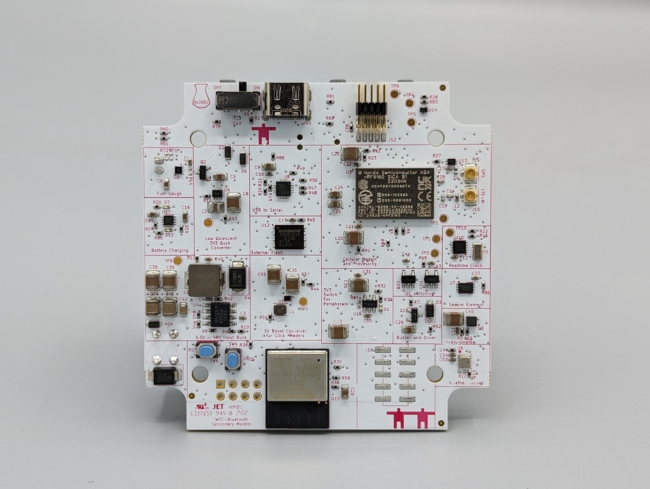
- nRF9160 – Cat M1 / NB-IOT / GPS chip with dual core Cortex M33 processing
- ESP32-C3 – Running ESP-AT firmware, interfaced to the nRF9160 over UART
- BME280 – Weather sensor from Bosch, common to many Golioth designs
- Power
- Low quiescent buck circuit, inherited from Feather Board
- 5V boost to service the 5V output on the mikroBUS
- Battery charging
- Fuel gauge
- High voltage input (5.5V to 48V) for powering from things like OBD-II and industrial supplies
- LIS2DH – Accelerometer, inherited from Feather board
- PWM Buzzer – Allow audible indication similar to the Thingy91
- Real Time Clock
- Secure Element (ATECC608B)
- Power Switching – Power switch of 3V3 for sensor nodes to shut down in low power situations
- QWIIC / STEMMA Headers – External sensors and peripherals including the Aludel Ostentus
- mikroBUS headers
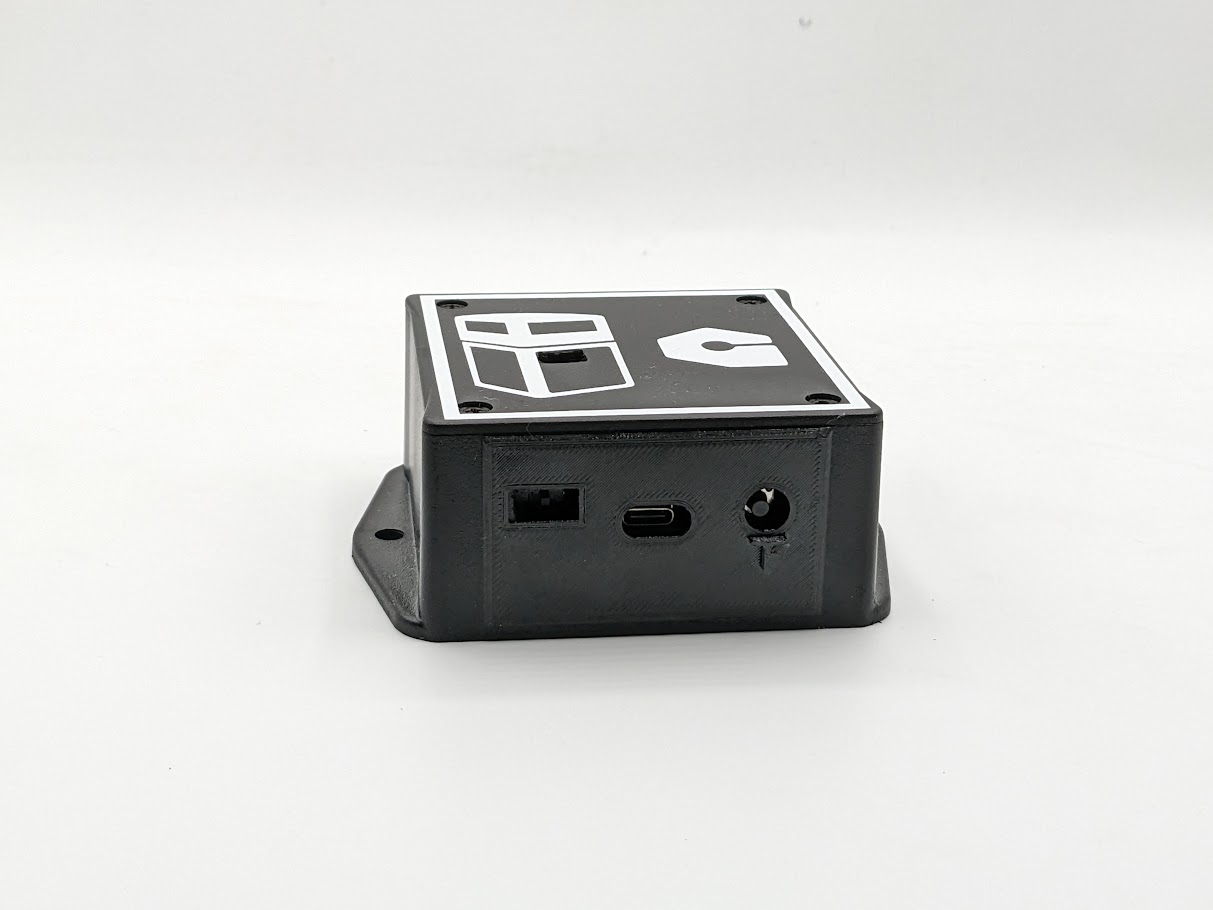
- USB C interface and power
- External SIM connector
- Multiple programming interfaces
- 10 pin SWD (02×05 .127mm pitch), accessible from outside the case
- 10 pin SWD Tag-Connect (accessible from the top side of the board)
- USB using the serial bootloader / MCUBoot
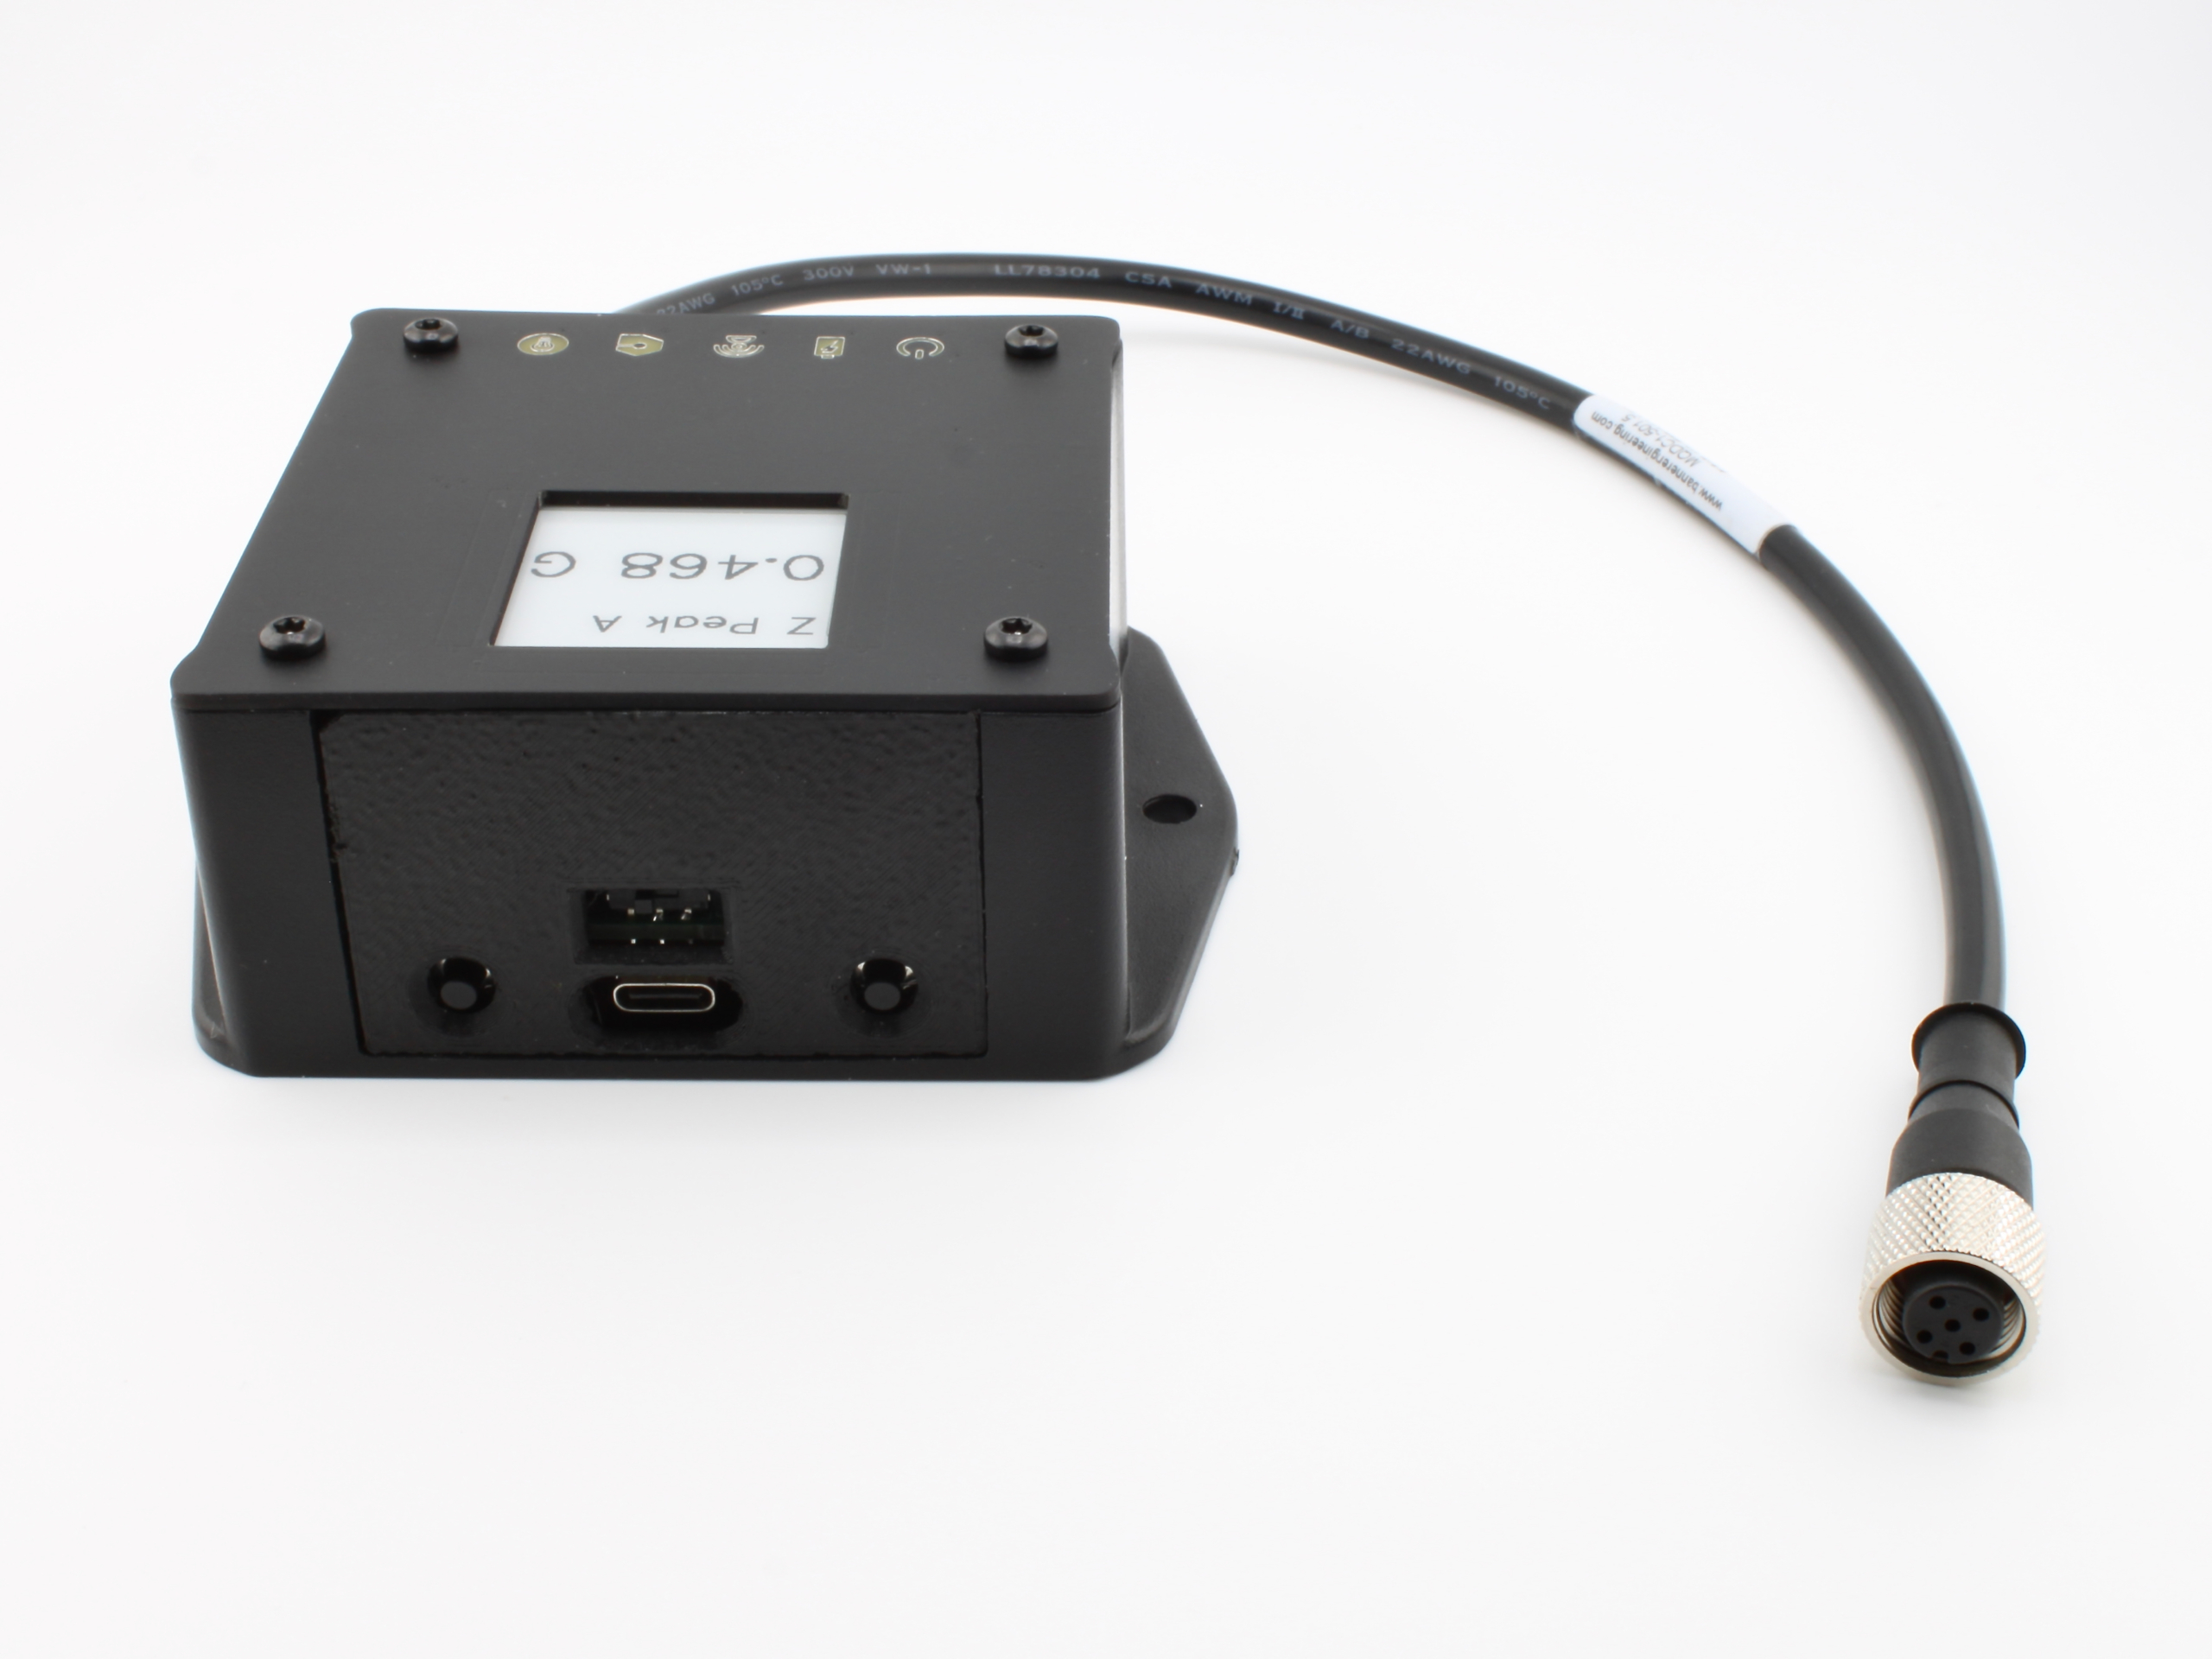
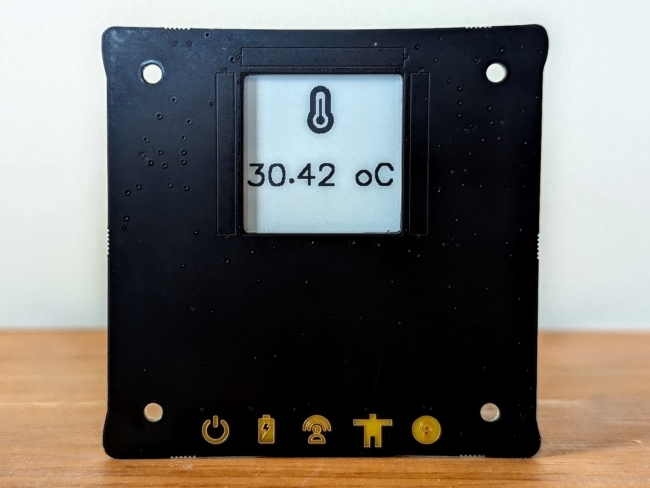
Ostentus
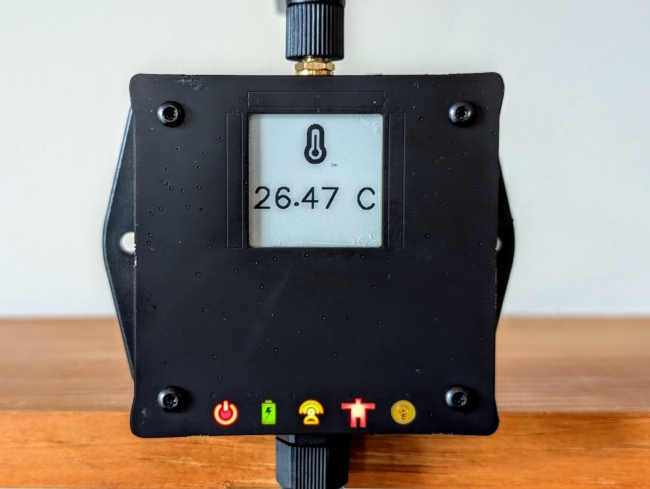
The Ostentus Hardware Repository is now open source on GitHub
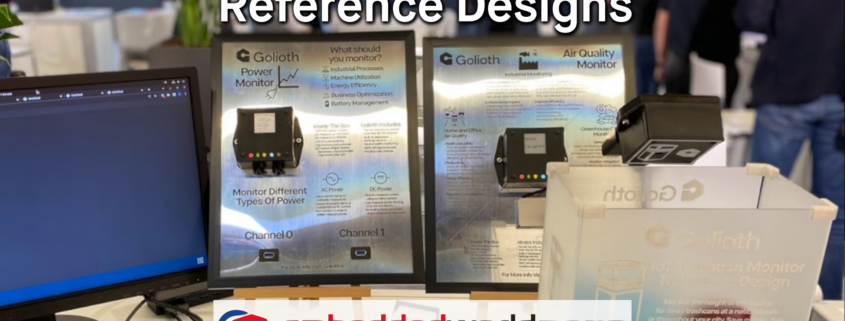
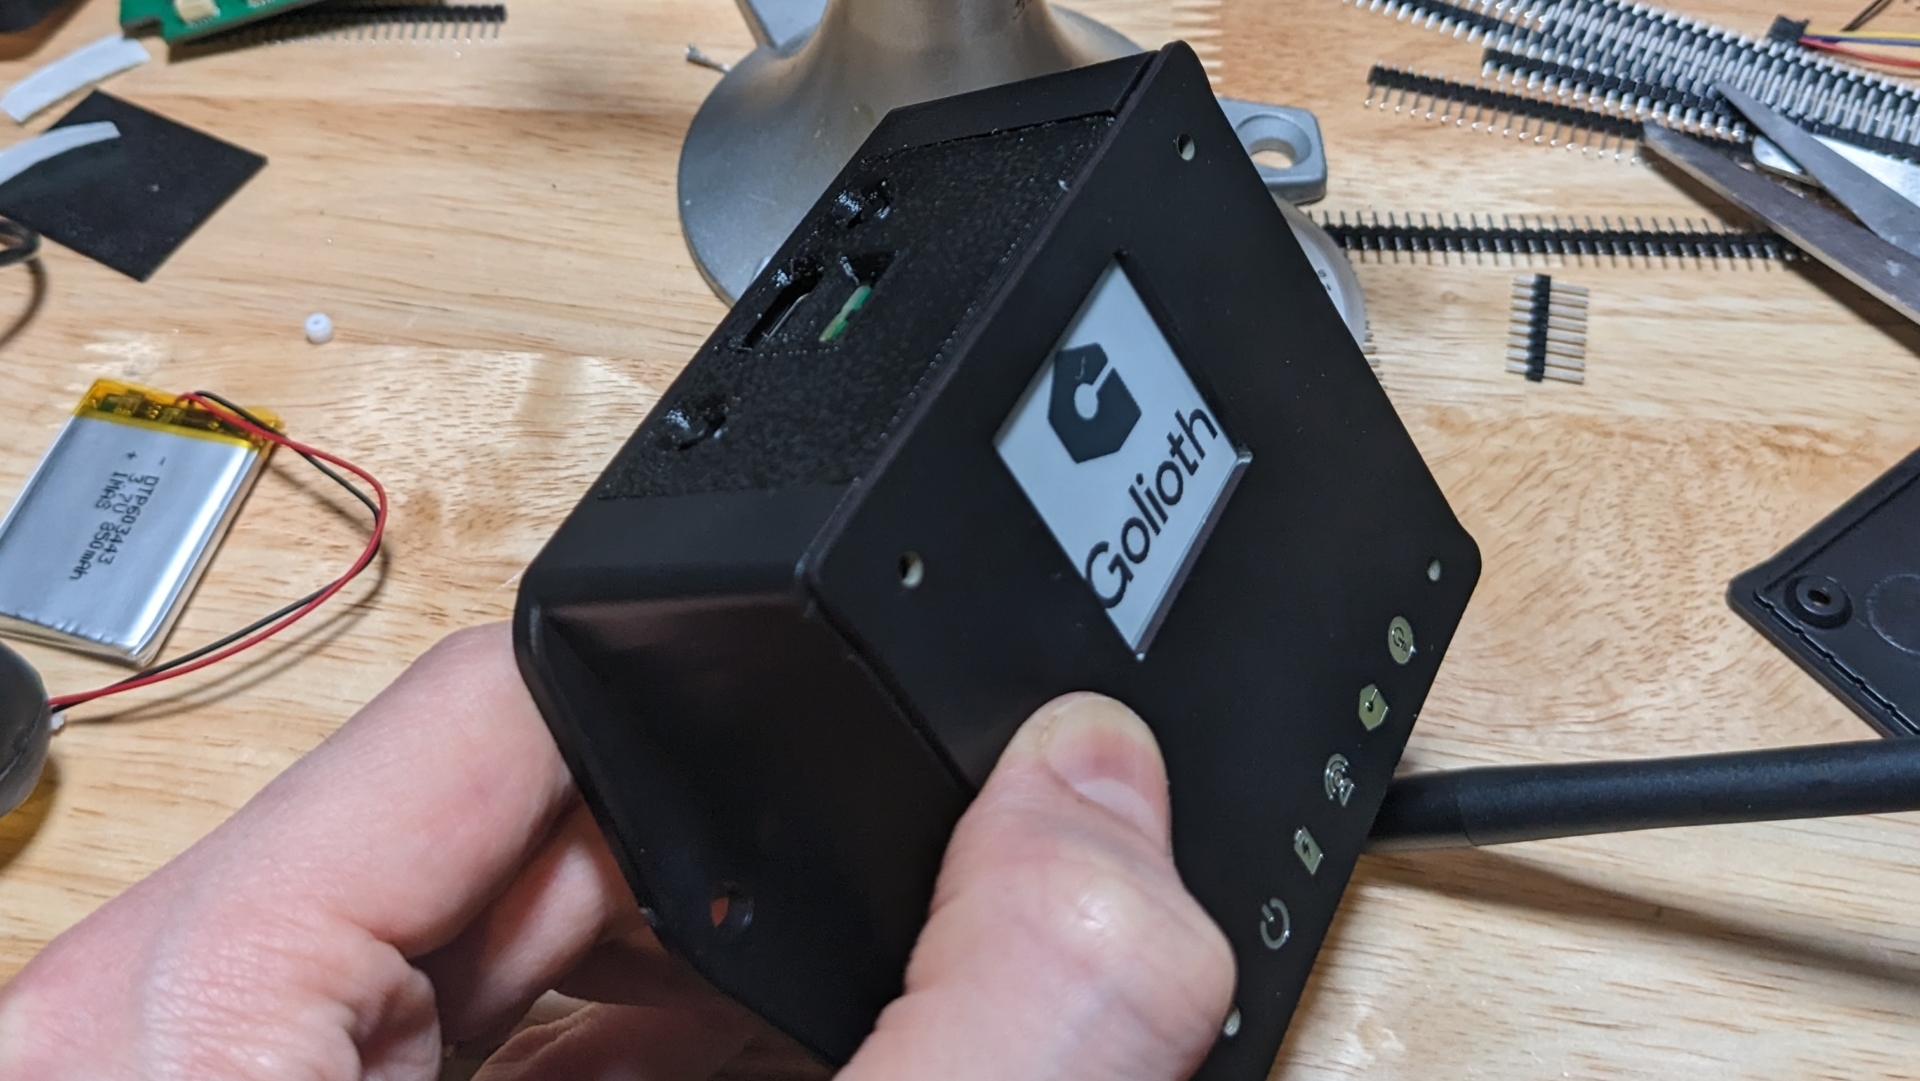
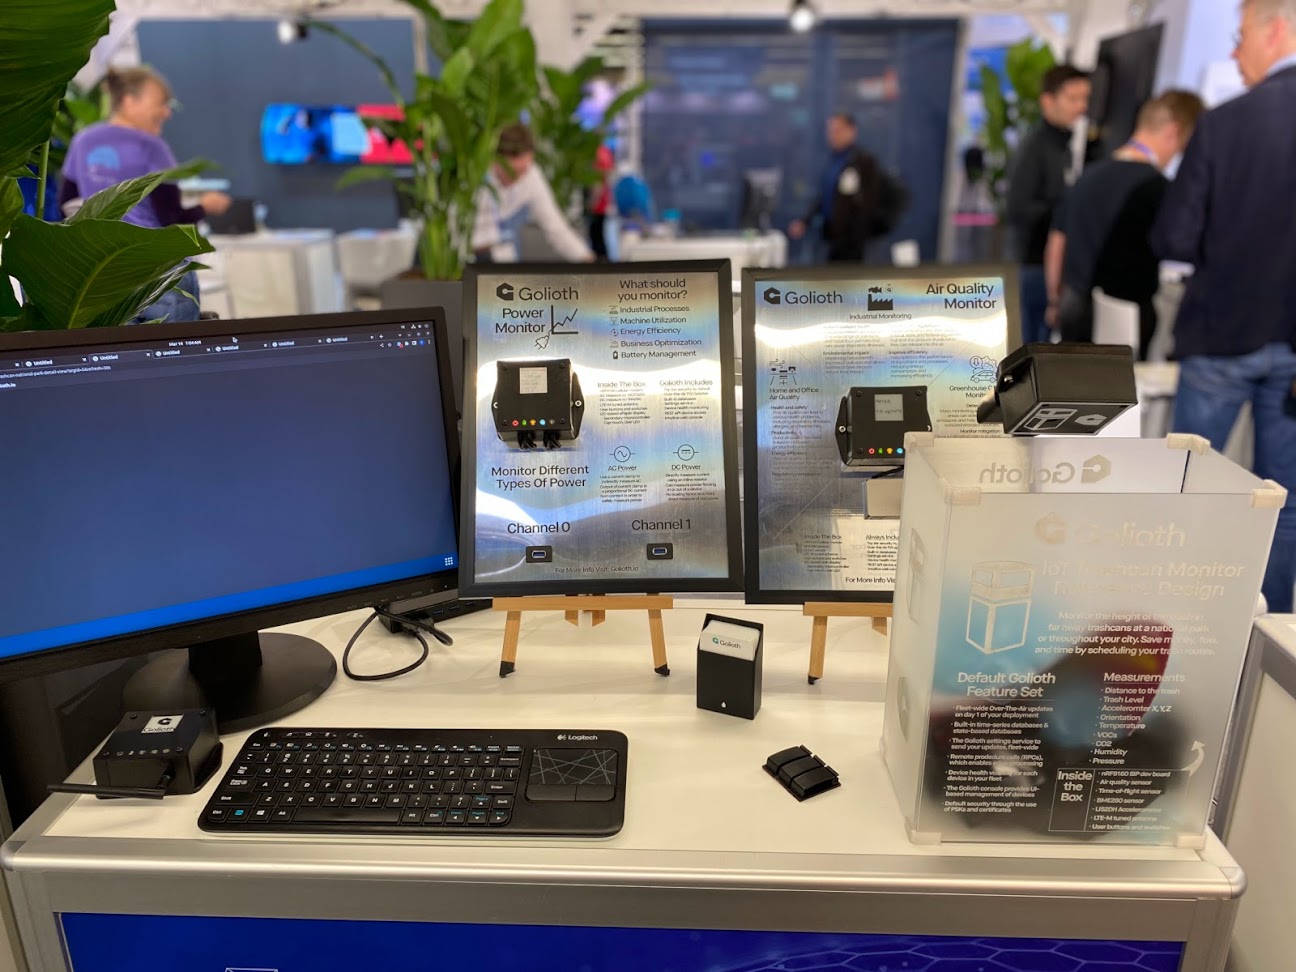
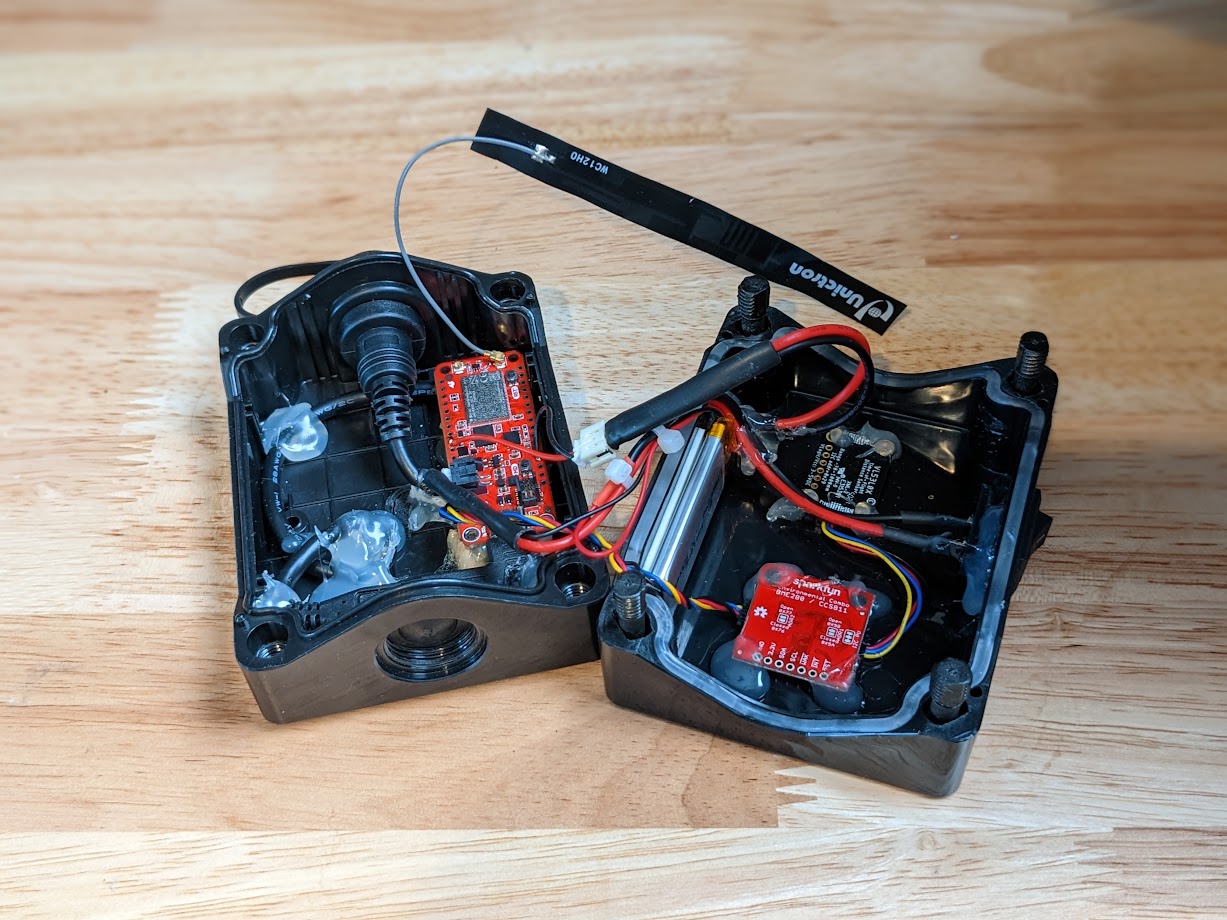
Early Reference Designs were simply aludel-mini boards in the Utilicase. We utilized vinyl stickers to differentiate between designs, but this didn’t have the impact we were looking for when we went to tradeshows or shared photos on our projects site. What’s more, it didn’t represent a product that might be on-site at an industrial facility (more on the ‘field readiness’ in a bit).
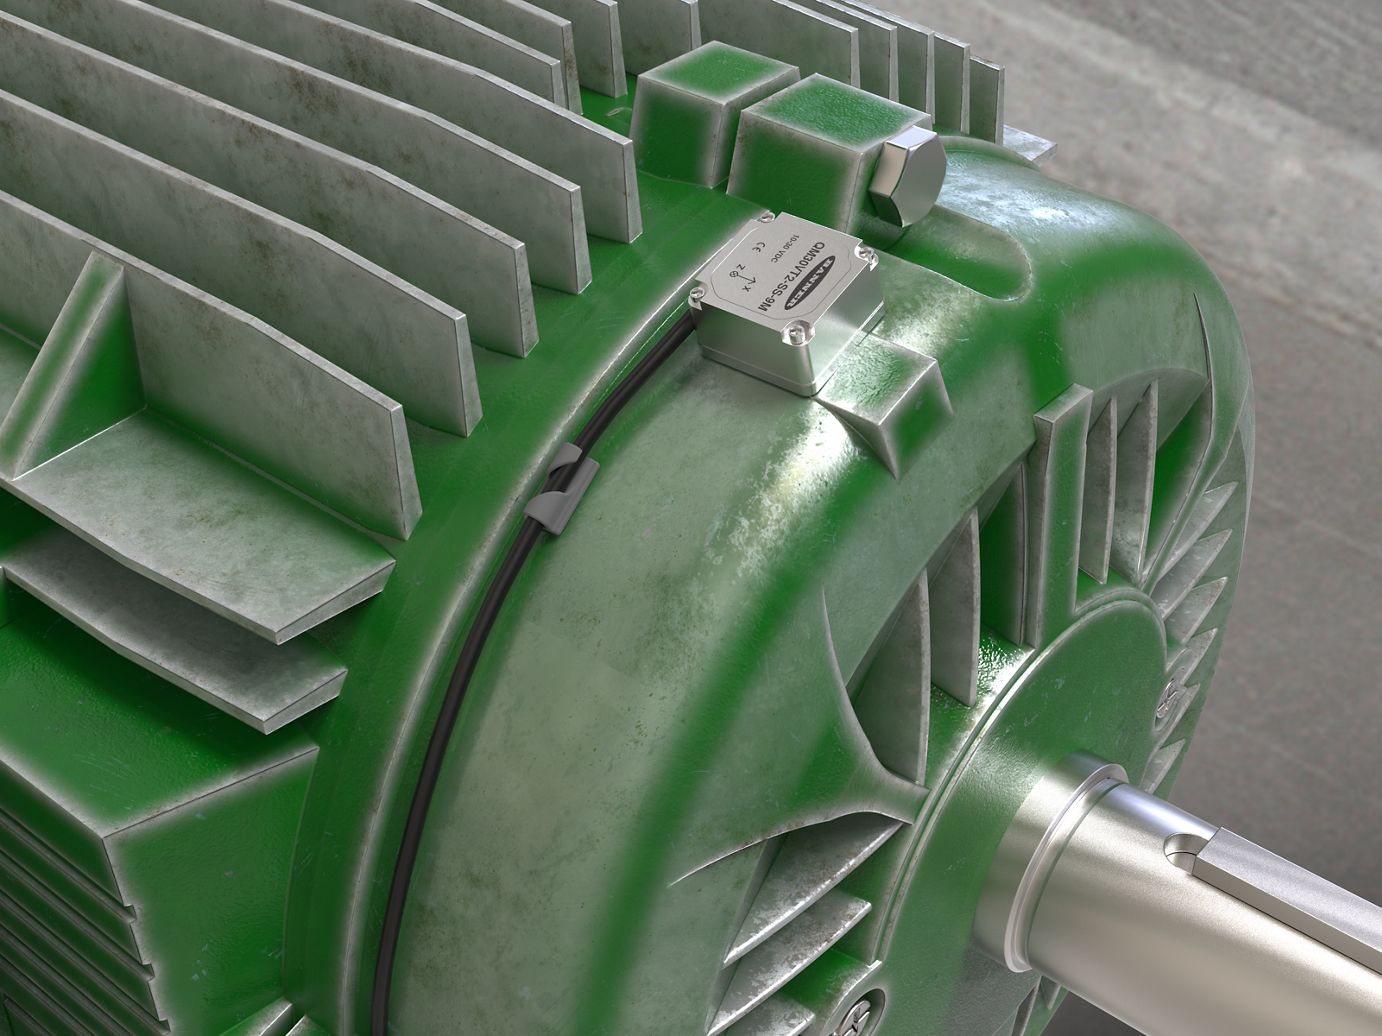
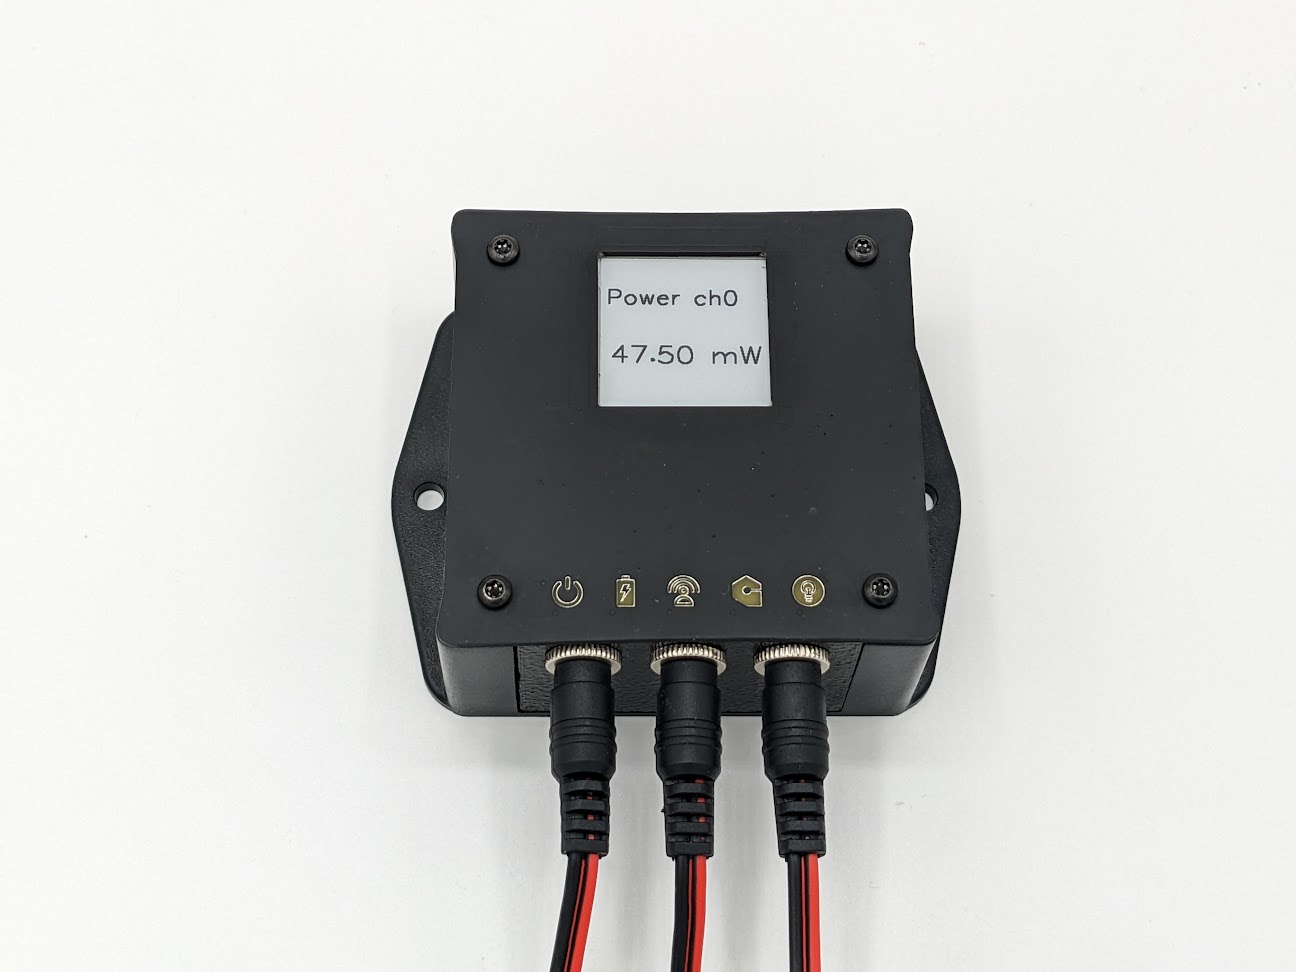
If you walk up to a sensor monitor at a plant, you likely don’t want to pull out a phone and require a network in order to interact with the device in front of you. Having a simple, power efficient, persistent display that is visible in high brightness environments felt really useful. In fact, our early design hypothesis is that you’d still want to have readings on the screen, which is why the Ostentus continues displaying data even when the QWIIC header has been powered down from the main board (in low power modes). That trick is handles using ePaper displays.
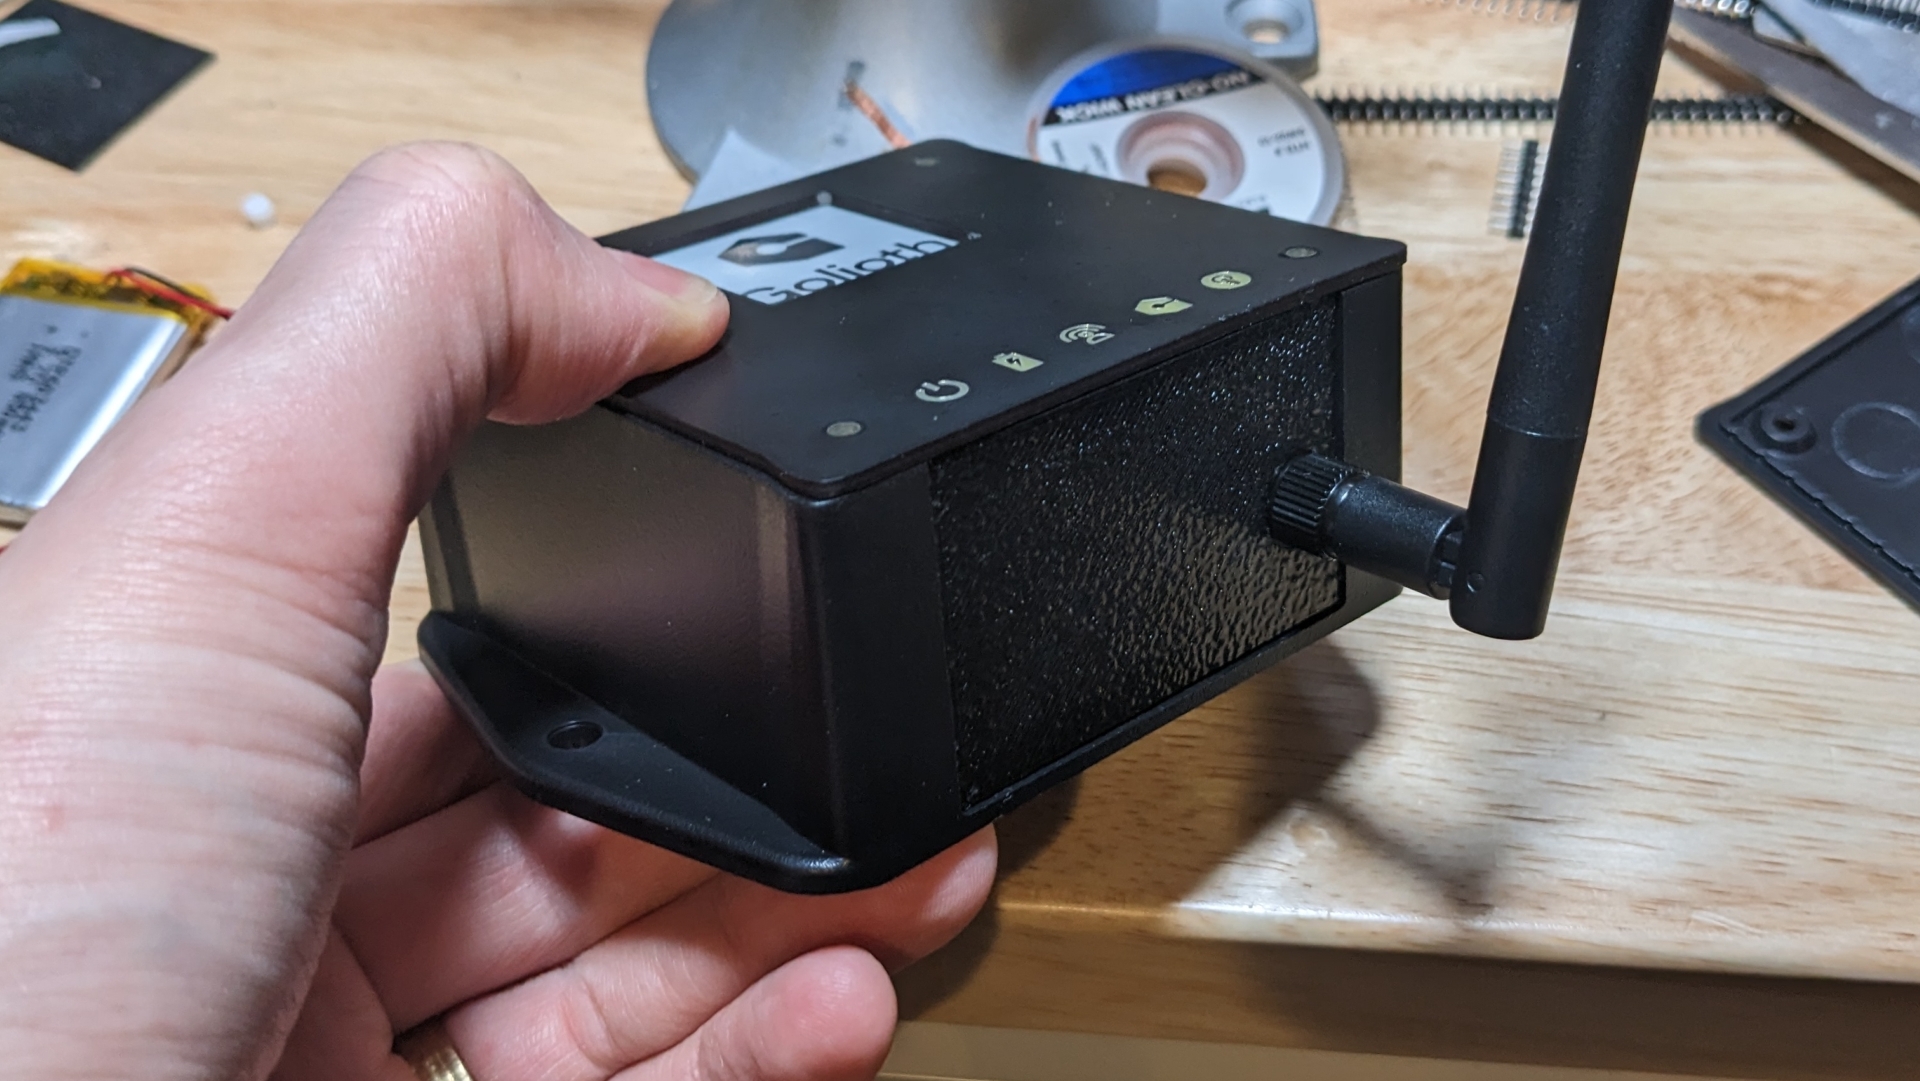
Over different iterations we added other capabilities to allow user interactivity. Capacitive touch buttons around the bezel of the screen and an accelerometer for sensing double tap actions through the case deliver user input in the field.
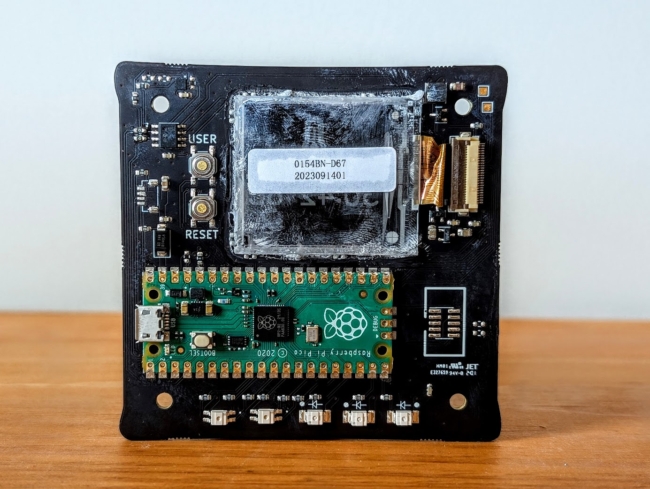
- Raspberry Pi Pico – Originally chosen during the part shortages of 2022-23, the RP2040 on the Pico provides a low cost solution including a programming interface over the USB port + MicroPython ease-of-use
- ePaper interface – This design was derived from the Pimoroni Badger 2040 and that had a reference circuit for interfacing to a Good Display 1.54in square ePaper display (not cheap!)
- Accelerometer (LIS2DH12) — Currently unimplemented but targeting “double tap” behaviors in the future
- 3 button capacitive touch controller (CAP-1203-1)
- QWIIC header for incoming power and i2c
- Downward firing LEDs
Two critical pieces of firmware power this part of the platform. We utilized i2c in order to cut down on the number of I/O required on the main board (in this case the Elixir) and also to abstract it for future boards that might differ from the Elixir:
- A firmware image for the Pico (
ostentus)- This contains C and Micropython elements to process incoming i2c commands and control elements on the Ostentus like the ePaper and LEDs
- There is a binary available as a release for easy loading onto the board.
- A helper library for Zephyr (
libostentus)- This includes commands and hooks for using i2c to communicate from a main board like the Elixir up to the Ostentus
- Currently only Zephyr is supported but it should be portable to FreeRTOS or bare metal by reimplementing a handful of i2c functions.
License and certification
These designs are being released under the CERN Open Hardware License – Permissive, version 2. This is one of the most permissive hardware licenses available. This board has not yet been certified by OSHWA, but we believe the hardware and files comply with the OHSWA definition. No FCC, CE, or cellular carrier certification is guaranteed with these boards and users should expect to take any resulting product through the proper regulatory channels.
Field Readiness
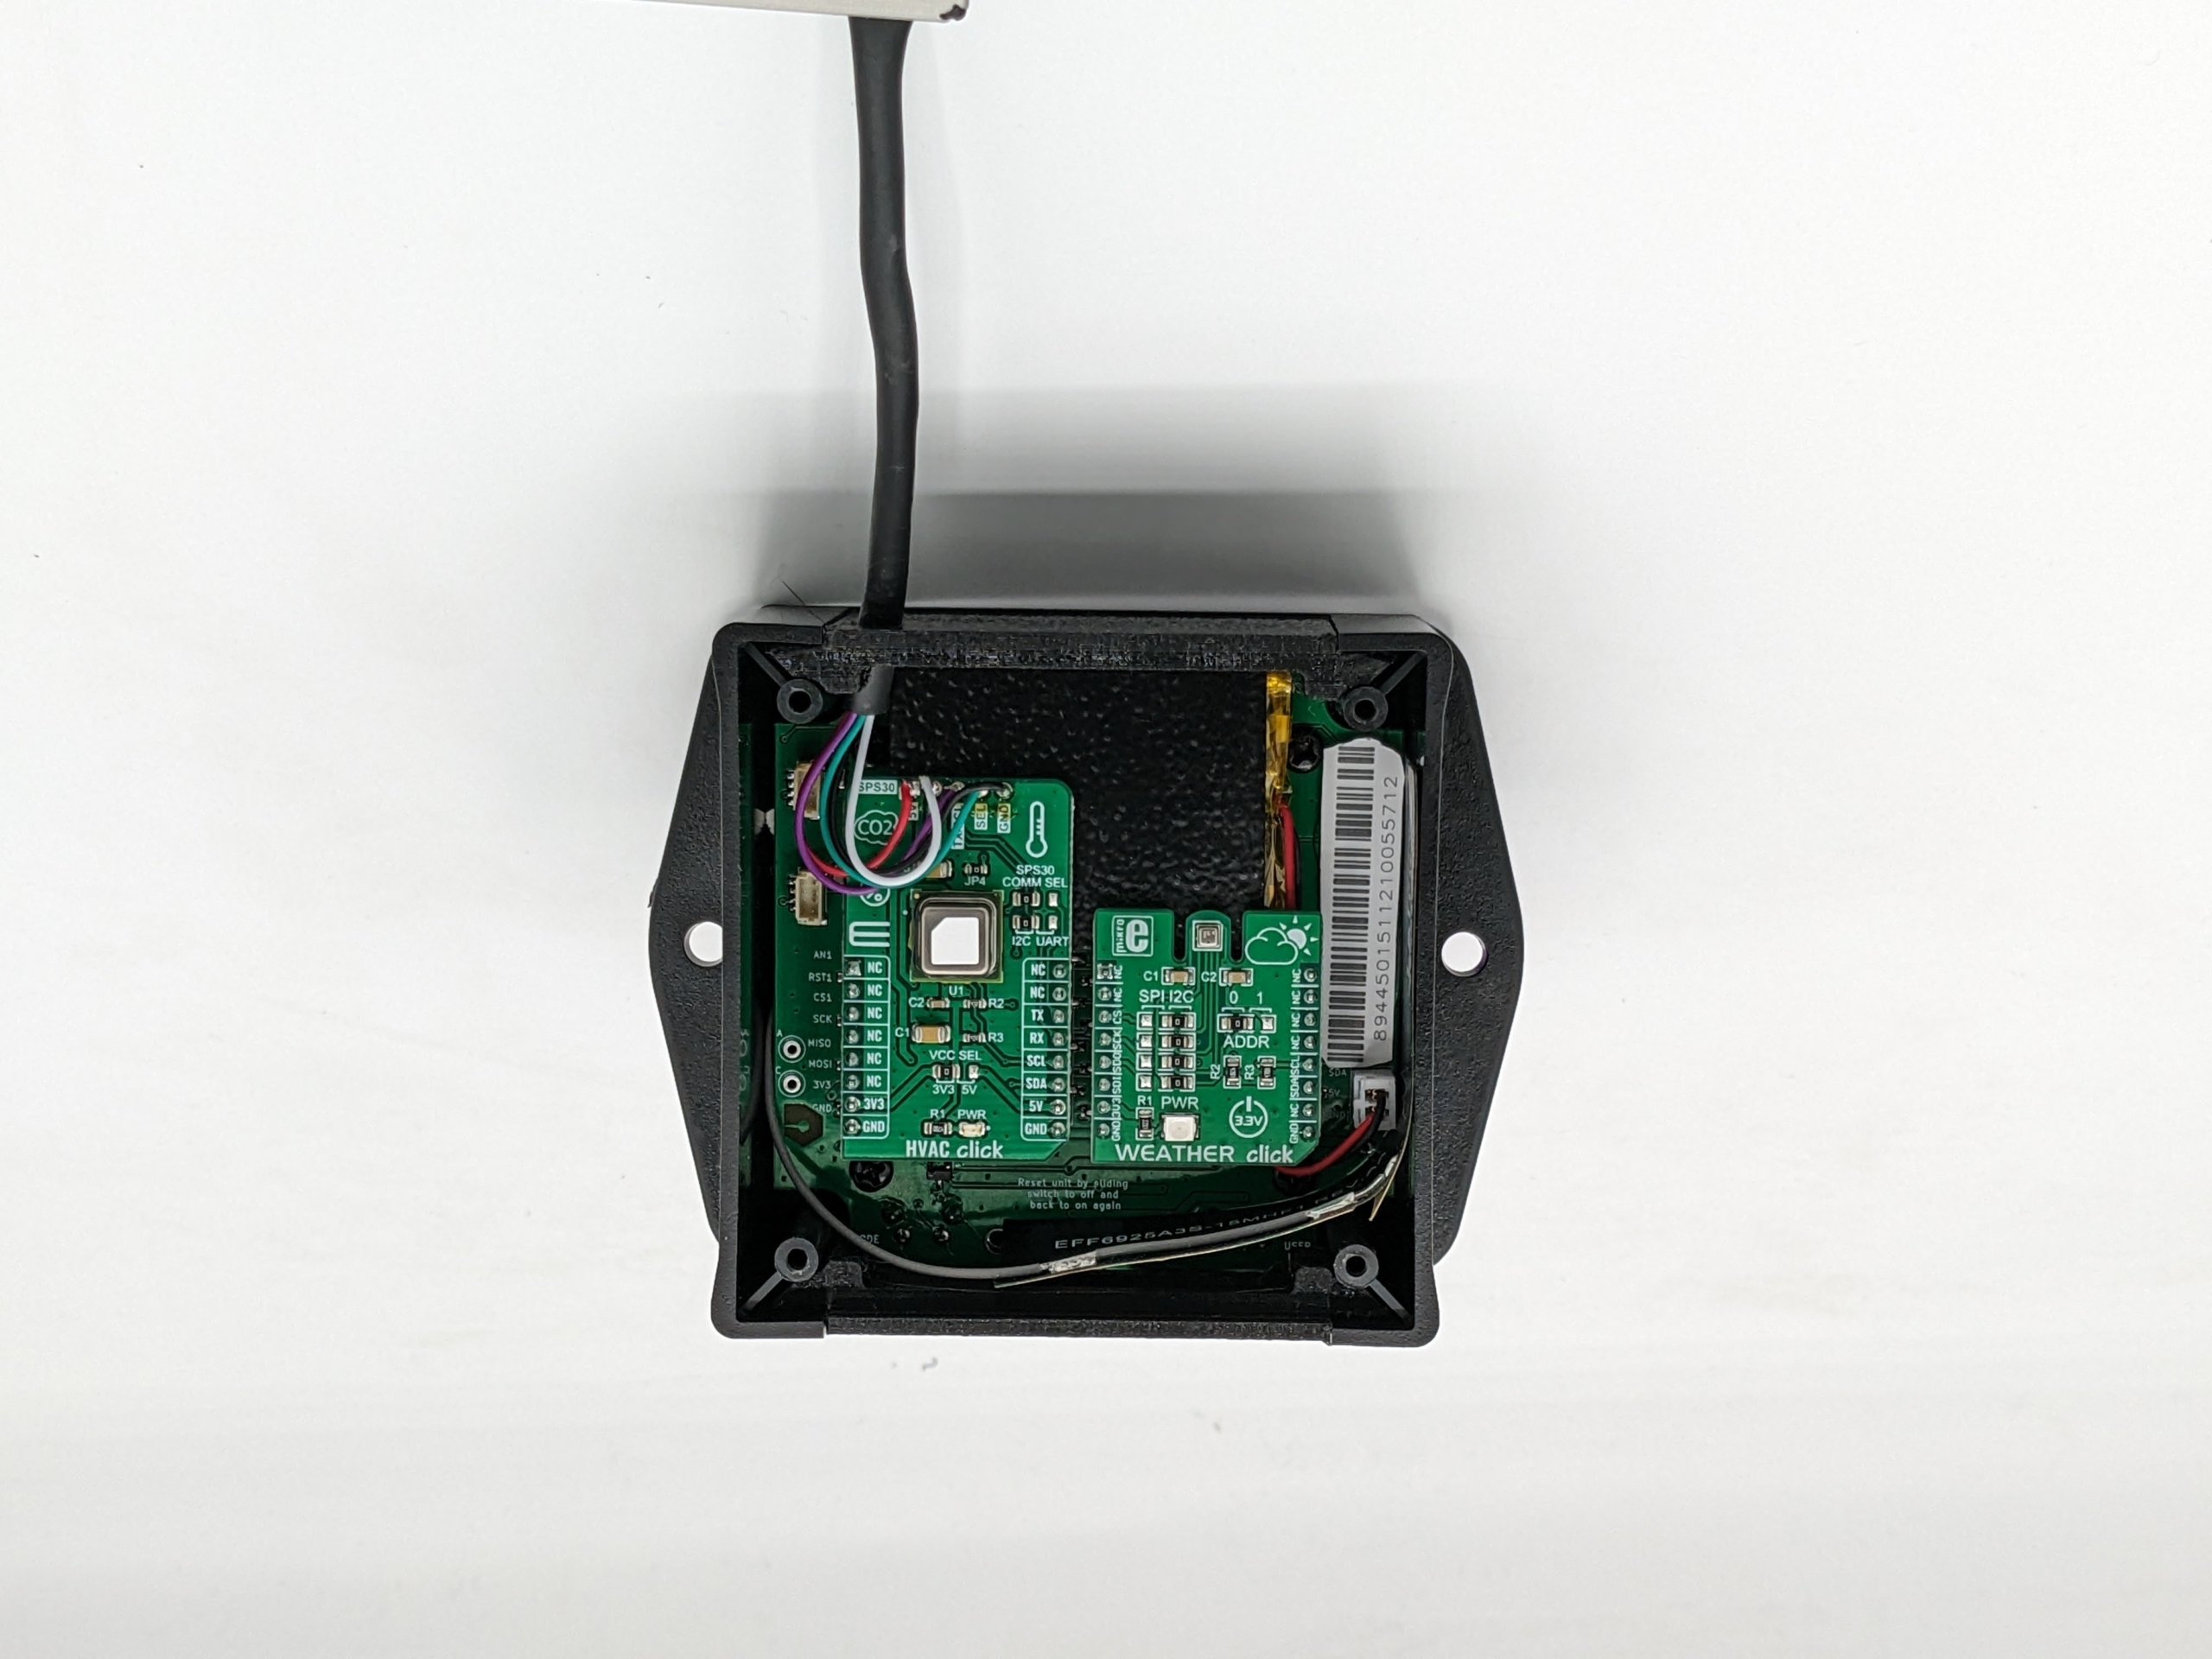
One thing to note is that the Ostentus plus the cut-out version of the Bud Industries case results in an unrealistic deployment option for the platform. I would never feel comfortable sending these boards out into a harsh environment, let alone a slightly damp one, due to the fact that there are gaps in the case and there is no IP rating. However, we didn’t design it for high reliability or even production: the Aludel platform is truly to showcase the widest variety of use cases and maximum flexibility.
This is why you’ll often hear us discussing how this is an “80% done design”. We expect our users to take these designs and shrink them, harden them for environments, and extend them for specific use cases. This could also include doing rounds of Design for Manufacturing (DfM), doing cost optimization, and improving testing for high volume production. Also important are taking the designs through FCC Part 15B certification and any required cellular carrier certification (which depends on which carrier you use and their requirements).
All of those things are left to you, dear reader. We followed the best design practices that we know, though we are always open to learning more and receiving feedback on our forum and issues filed on our GitHub repositories. You can start to evaluate whether this custom hardware is the right path by starting from our range of Follow-Along Hardware and open source firmware on the Golioth Reference Design Project site.