As we previously wrote about, we attended the first Embedded World North America, held in Austin, Texas on October 8-10th, 2024. Part of our time there was to showcase Golioth’s Cloud + low power capabilities at the Joulescope booth. In this post and video, we’ll explain how to trigger different low power modes and how we measured the output.

Goals for the demo

When we were invited to showcase alongside Joulescope, I knew I wanted to be able to turn off elements of the PCB that I believed consumed power. This meant two things:

  1. Reviewing how Golioth can trigger actions from the cloud
  2. Calling the appropriate APIs from Zephyr

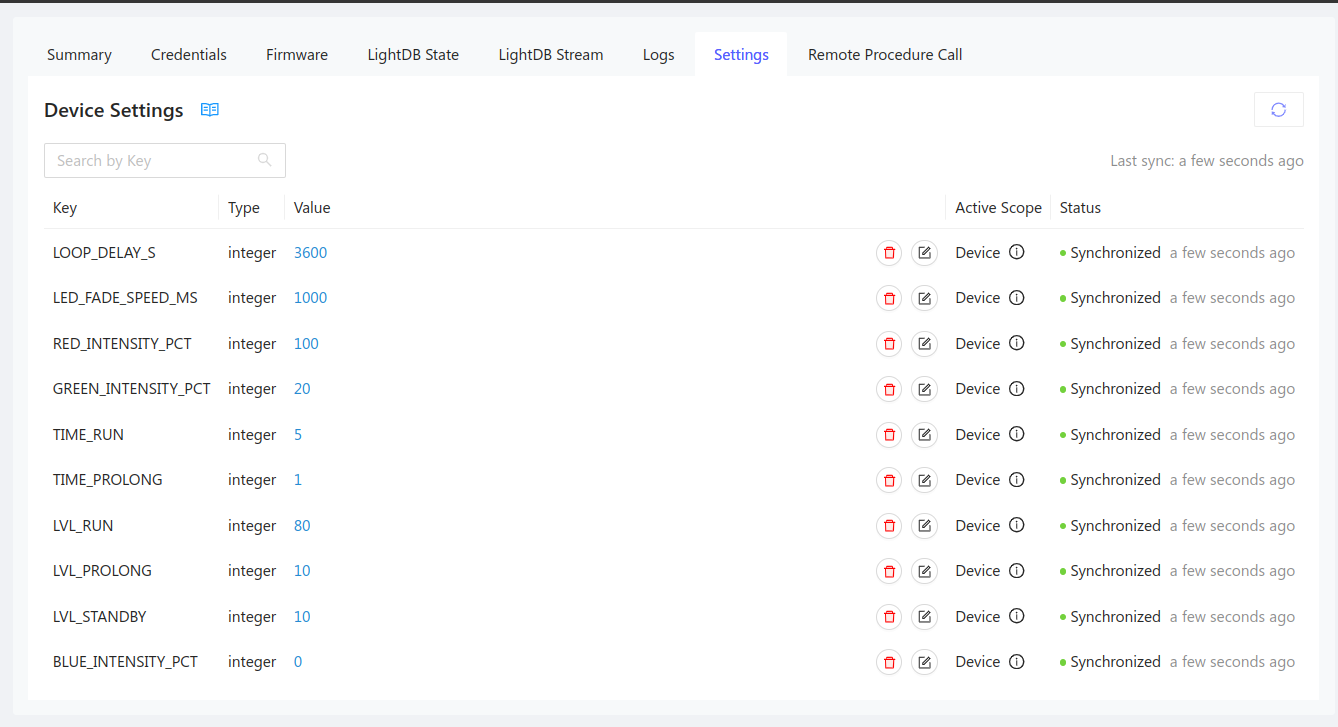
The first part I have done many times before. I targeted using Remote Procedure Calls (RPCs) and Settings to push information to the device. However, I could have also used LightDB State. Each has their place in different IoT setups, but as I’ll explain later, Settings seemed to work best for low power contexts. I wrote a Guide on how to add a new setting to a Golioth project a couple days ago.

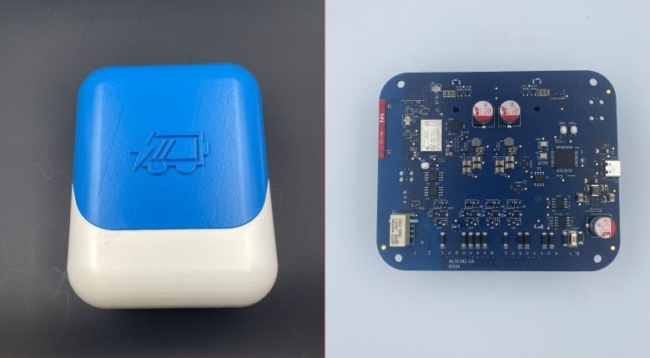
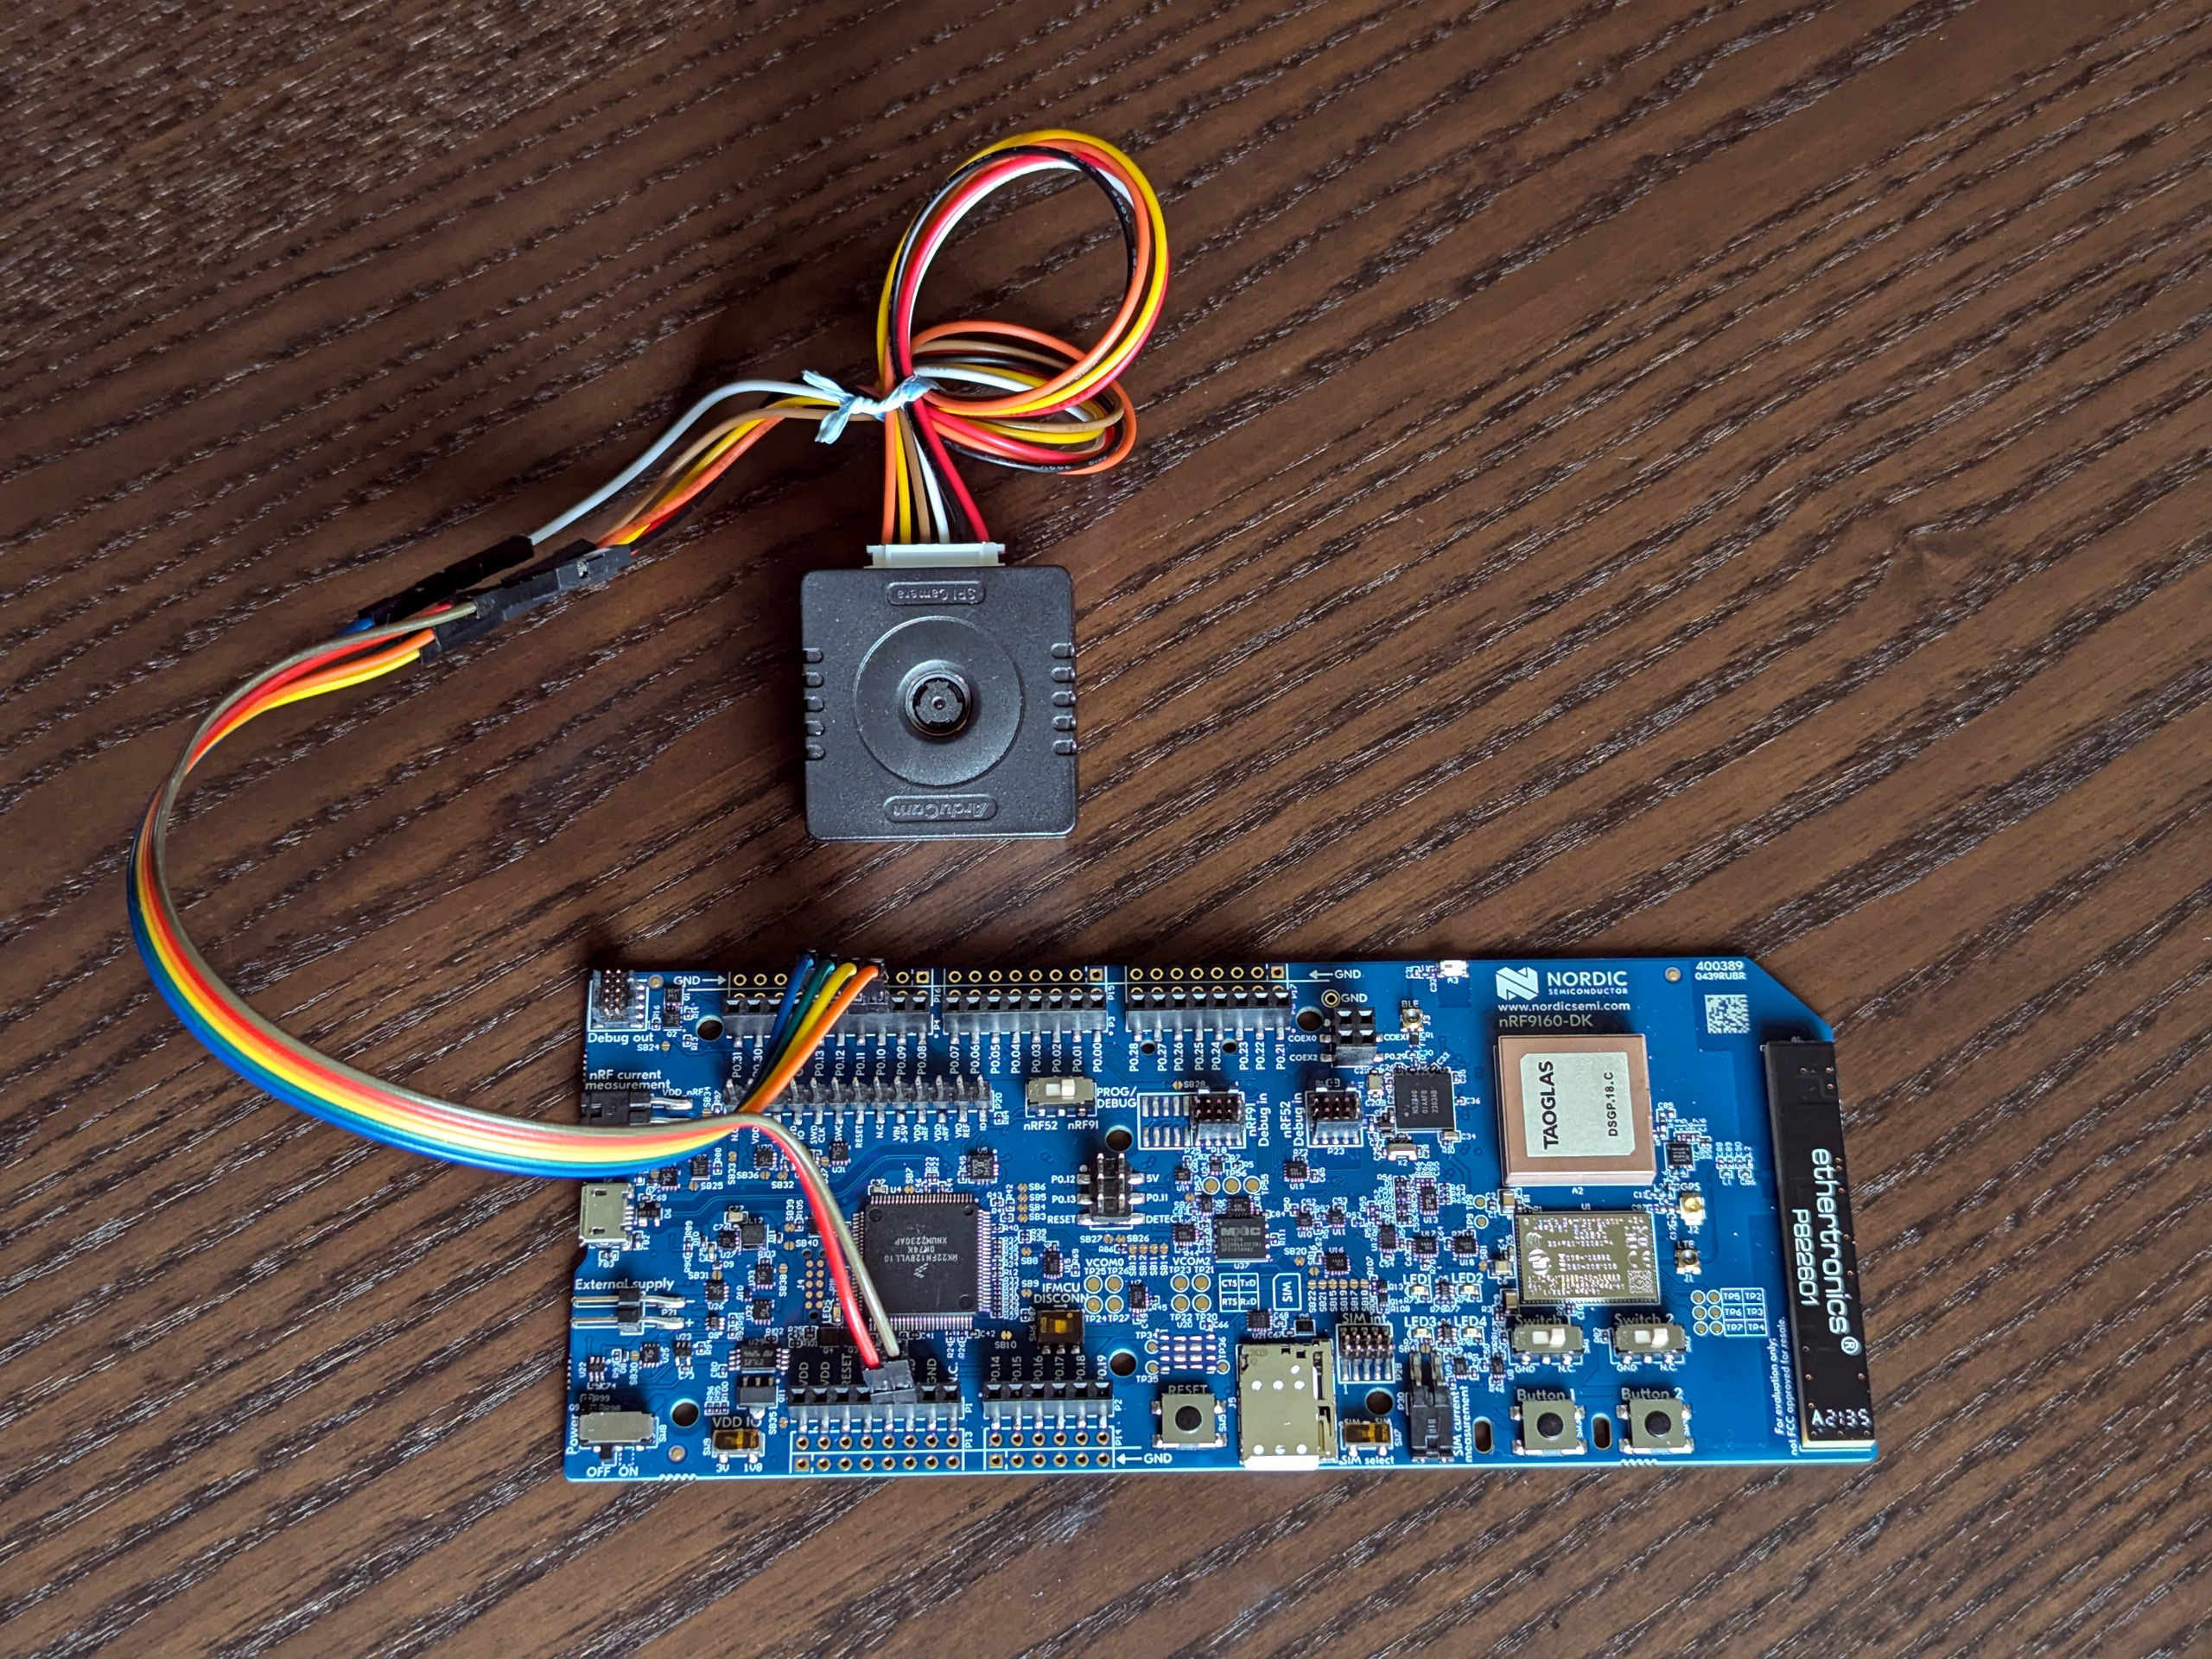
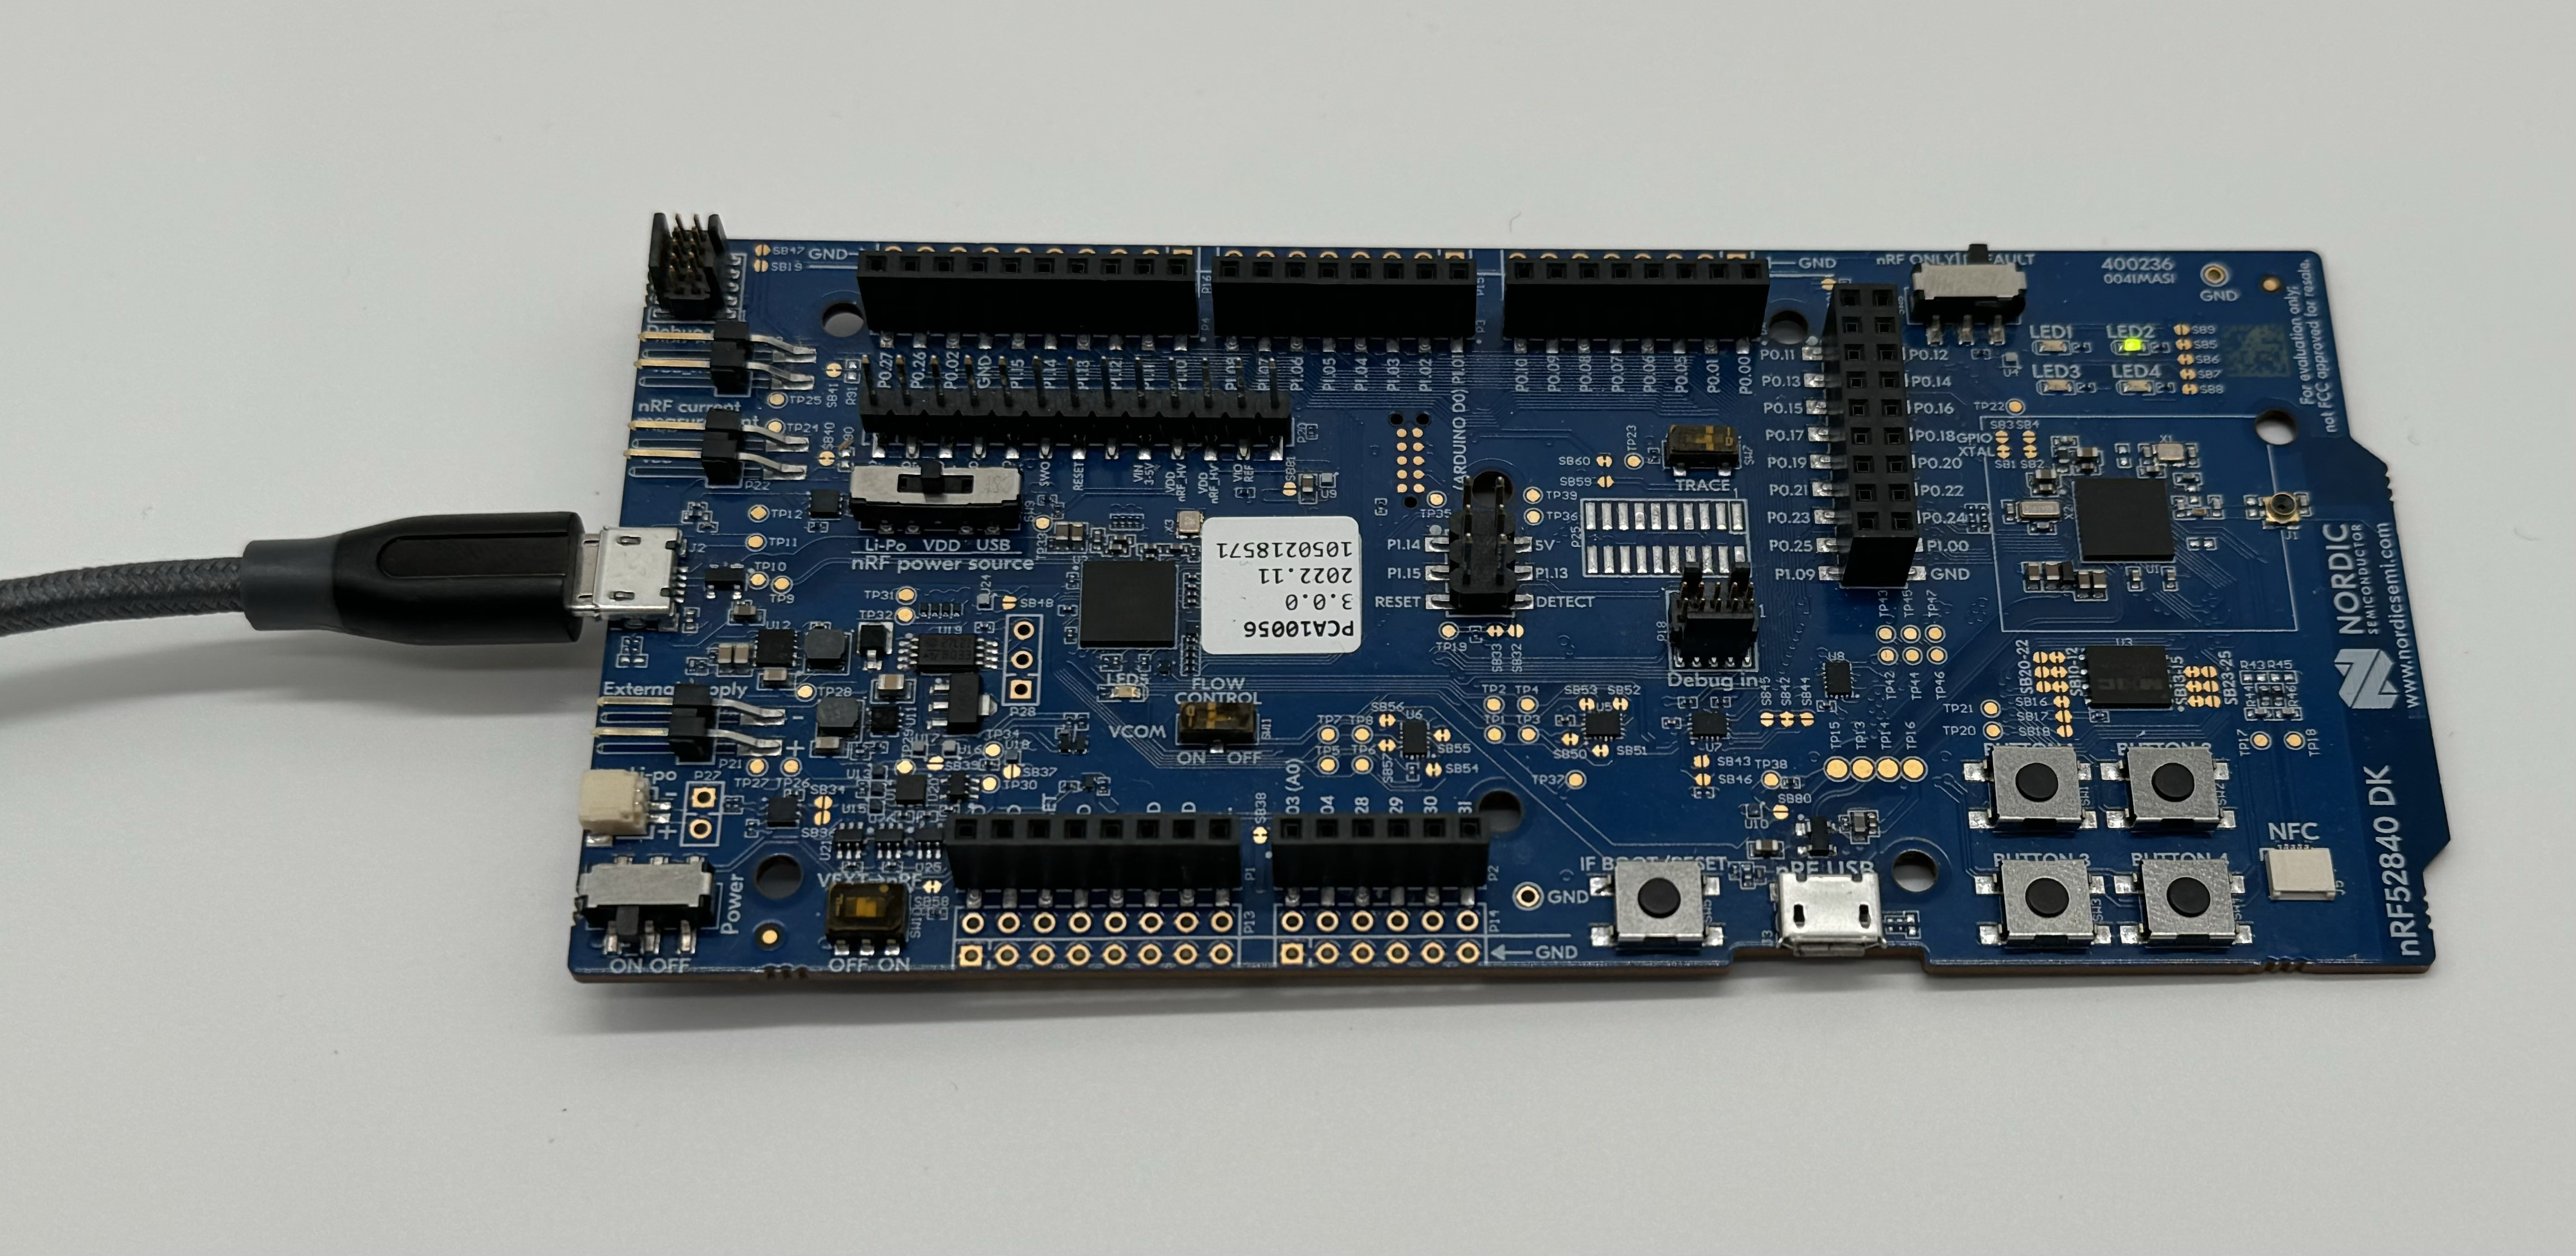
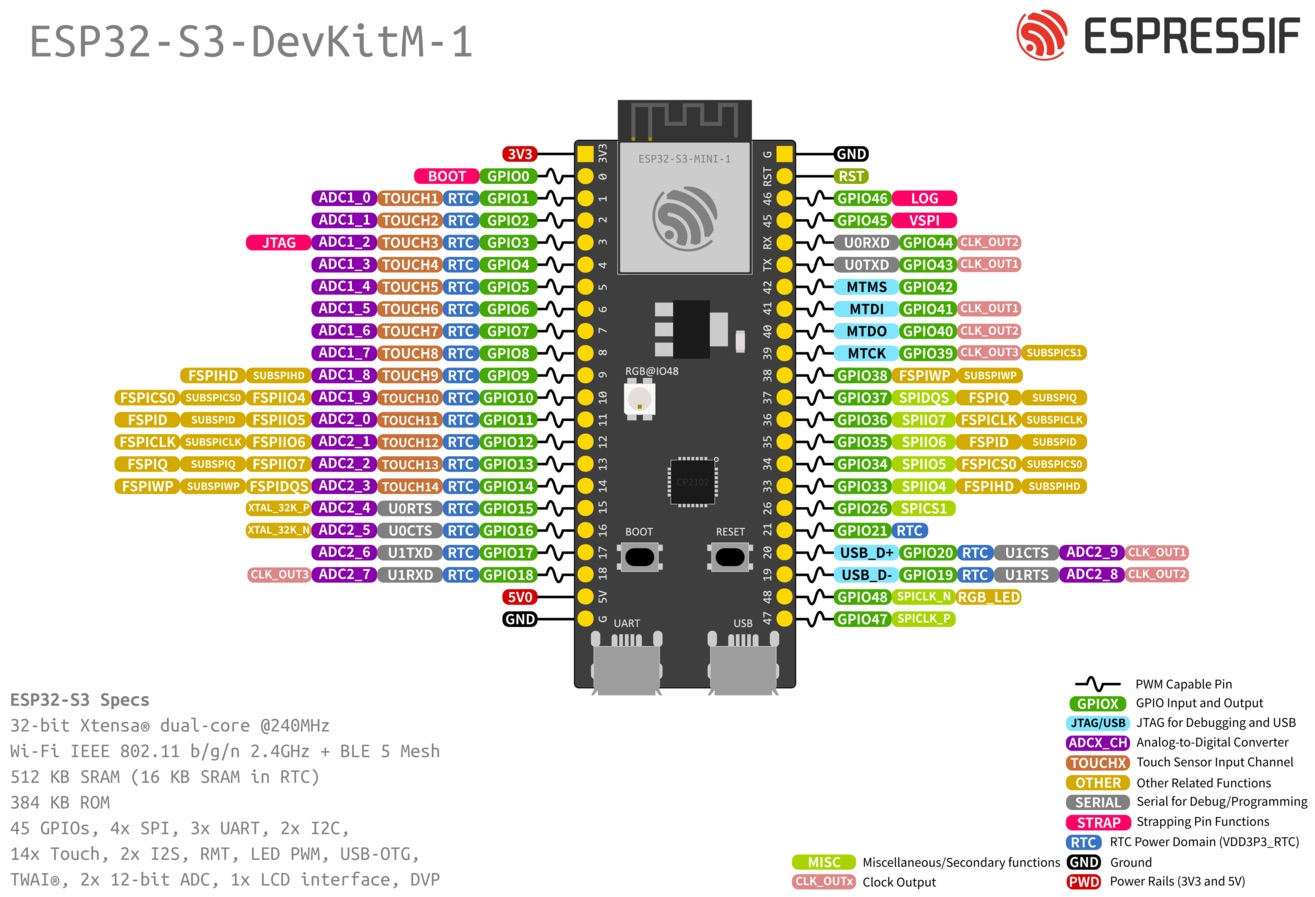
All of the code mentioned here is targeted at our Aludel Elixir board. The basis for the code is our Reference Design Template, which also targets the nRF9160-DK, but that is off-the-shelf hardware that already has the kinks figured out (thanks Nordic!), so there was less interesting stuff I wanted to do. I will try to target that hardware in a future post as well.

Calling APIs to trigger lower power behavior

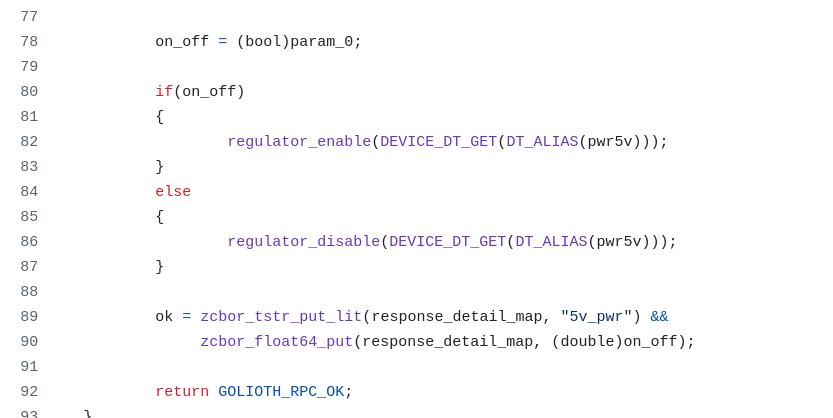
As you can see in the Golioth Joulescope demo repo on GitHub, the APIs we call are captive in app_rpc.c and app_settings.c, since that’s where we triggered these actions. I created two new RPCs to turn on rails and see what happened. The most extreme was the 3V3 rail, which controls the sensor + WiFi section of the board using a “downstream” power switch. You can see in the video that I trigger this and the power draw goes up nearly 5x. I also was able to use the same logic for the 5V rail. Both of these utilized the “Regulator” subsystem in Zephyr. I needed to modify the device tree using an overlay file to make sure these two rails were not turned on by default (an article for another day, basically the opposite behavior of this article). I triggered the behavior using these API calls:

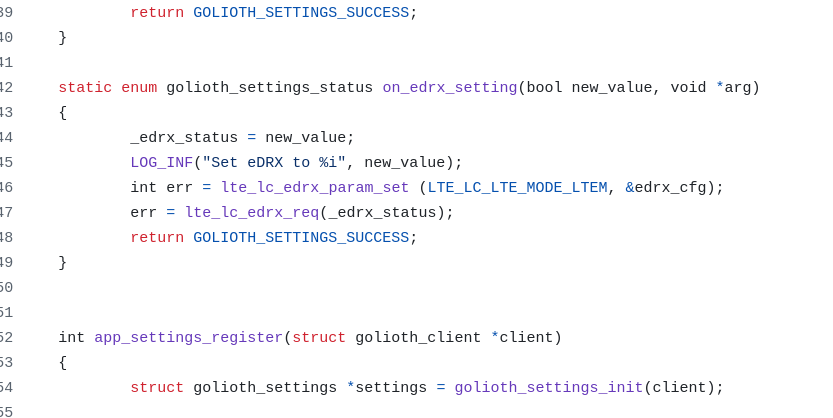
I also wanted to trigger less frequent communication with the cloud, simulating a “sleepy device”. For this, I leaned on eDRX or Extended Discontinuous Reception. I had been calling the API using an RPC, but it wasn’t super optimized for low power modes. For instance, if I have eDRX mode enabled, I won’t be checking into the tower all that often; if I call the RPC to disable eDRX, there’s a chance the RPC will timeout in our 10 second window. Interestingly, we figured out that the first call will get cached at the tower (after a 10 second timeout) and the second will often return as a failure. Either way, it’s not a super reliable way to both send a command to a device and ensure it’s properly been received (nor when it has been received).

Instead, I moved the eDRX to use the Golioth Settings Subsystem. This worked great because the change in setting is transmitted to the device and it will send a callback to the server whenever it has been received. This is purpose built for asynchronous operation in low power states. Until the server receives the GOLIOTH_SETTINGS_SUCCESS enum back from the device, the Console will show that the device as “Synchronized” or “Out of sync”. Now whenever the device in eDRX mode is checking back in with the tower, it will see that an update is available and will do the synchronization.

Other modes we enabled

In addition to triggering different APIs remotely, I also set up the board to be in a lower power state to start with. This included turning off a good portion of the peripherals that would draw power. I followed Marko’s article for optimizing power on nRF9160 boards.

I had moved the shell output from UART0 to UART1 on the Elixir board (utilizing the MikroBus headers and plugging in a USB to Serial converter) because I was not using the USB to serial chip. I didn’t want to have the 5V from the USB interfering with the measurement, nor did I want to have that chip (CP2102) siphoning power from the rest of the board unknowingly. Even after all the work that I did the move over to using UART1, it was a pretty large power hog (<500 uA – 1 mA) because it’s always listening for commands. Instead, I relied on the Golioth Logging Subsystem, so I could see what was happening on the cloud. Since we were sending on an infrequent basis, adding in a couple of logs didn’t add much to the overall power when the device woke up from “sleepy mode”. If they did, I could always turn down the logging level using our standard set_log_level RPC in the Reference Design Template. See the demo video above for more detail.

How the measurement works

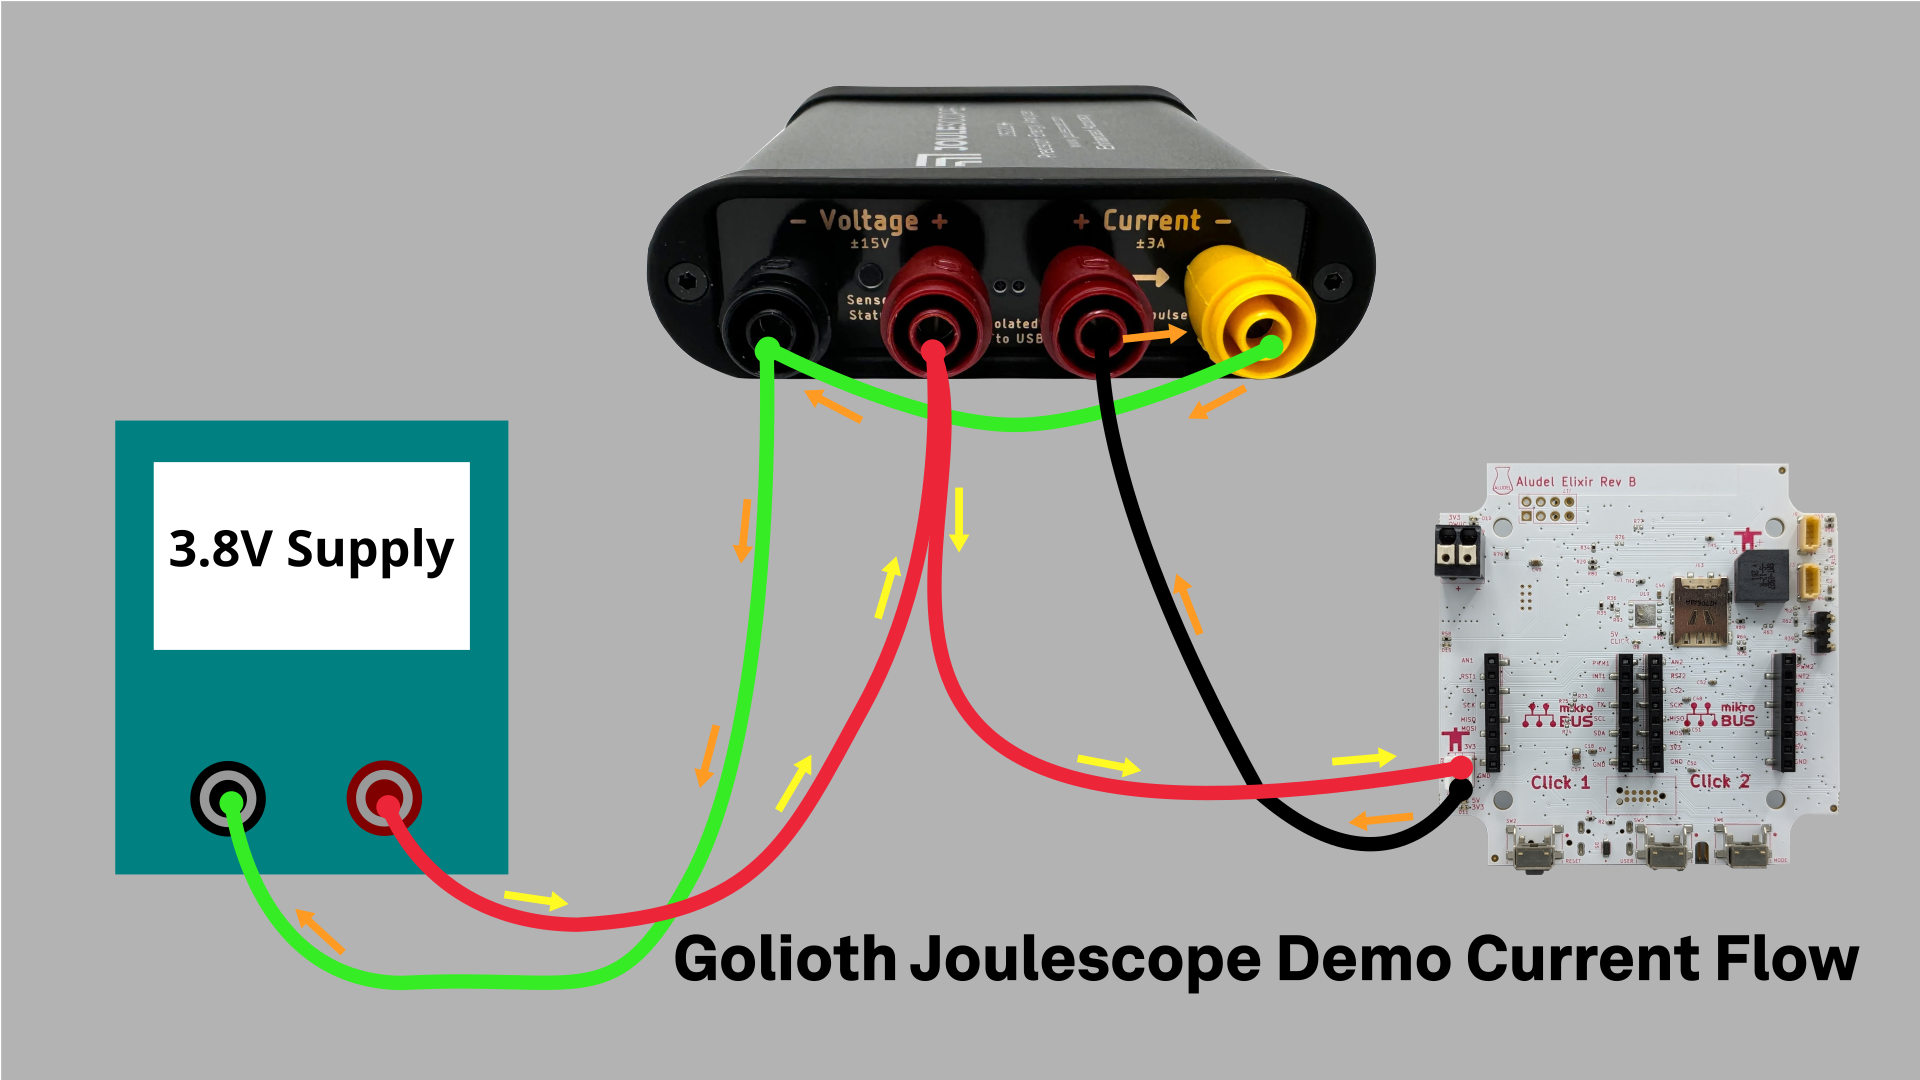
The Joulescope is a great tool for measuring low current applications. It has a 1 nA resolution, but is accurate to around 30 nA out of the box (way more accuracy than I need, sad to say); it also has super fast range switching, so catching spikes during RF transmissions are captured as well. You can see different modes activated in the demo that we shot with Matt Liberty at Embedded World North America.

In this setup, we have an off-the-shelf power supply that is simulating the Lithium-Ion battery we normally have plugged in. Then we use the Joulescope to measure the voltage and current as we flow current through the 2 mm JST battery connector on the Elixir board. We’re able to capture peaks and sleep currents of the design in different modes. See the video above for live views.

Power monitoring as a troubleshooting tool

One interesting behavior is the NAT timeout that Dan mentioned last week. I had been playing around with different KConfig settings, trying longer and longer keep alives and timeouts. With Dan’s help, we narrowed in on the 2 minute mark as a timeout, as explained in the “Configuring the Golioth Firmware SDK for Sleepy Devices”. Seeing the device using outsized amounts of current despite us having Connection ID enabled helped us narrow in on different parts of the system. In that case it was the NAT for our MVNO, and the fact that Connection ID wasn’t configured correctly on my project. Once we pushed a change for the Connection ID code, we were able to push the sleepiness of the device even further out. Connection ID also obviates the need to worry about NAT timeout for any particular MVNO, which means the Golioth SDK is helping to standardize offerings from different carriers.

Future Improvements

The cool thing about this kind of activity/demo is that it allows us to isolate and measure the power impact of each action. That means we can assign a “cost” to things like:

  • Doing an OTA update (including pushing out various artifacts using Cohorts)
  • Sending single log messages
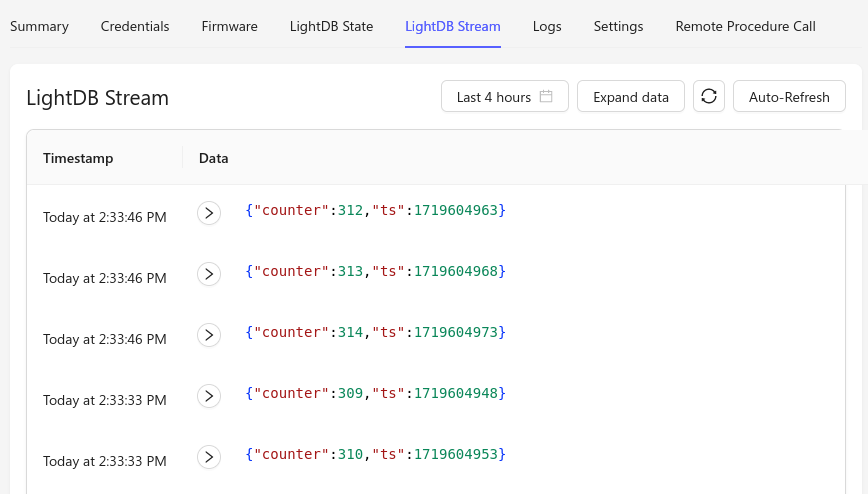
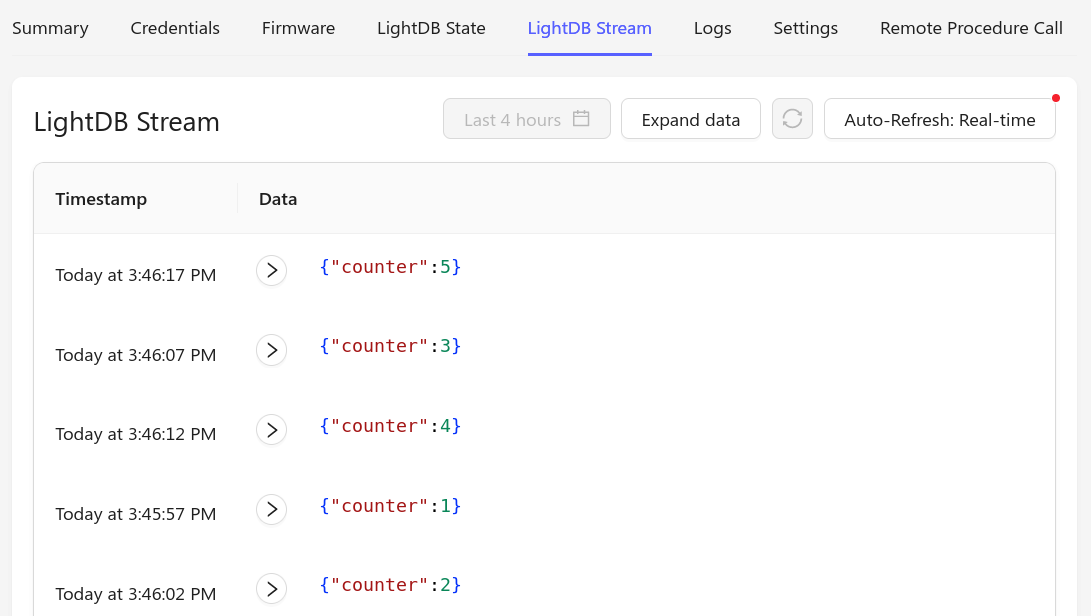
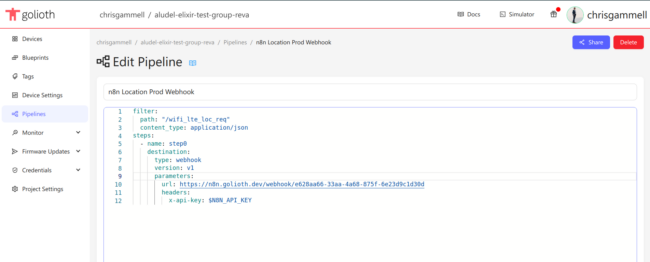
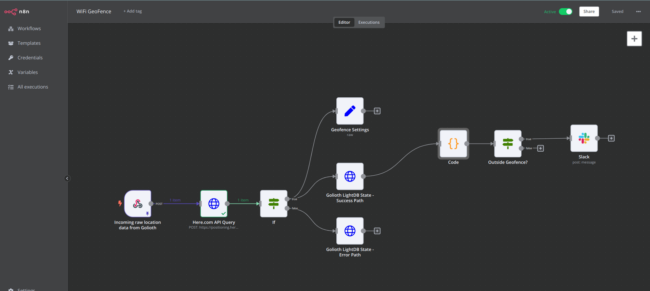
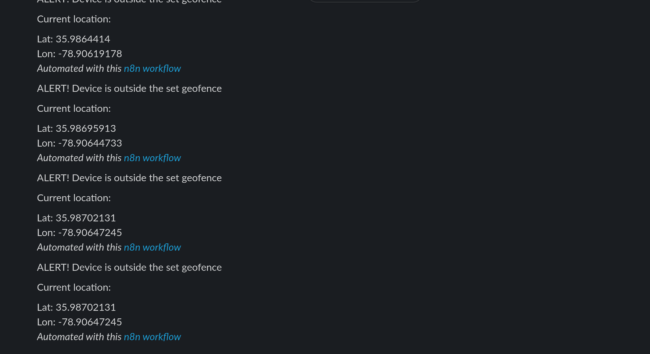
  • Sending single Stream messages to push to different services using Pipelines
  • Connecting to the tower and the value/cost of ConnectionID

As I mentioned above, I’d also love to target some of this behavior directly at the nRF9160-DK and other development boards. It can be useful to be able to remotely trigger lower power modes, but it’s often tied directly to the capabilities of boards.

We really enjoyed optimizing for lower and lower power and will be writing more about this topic in the future. If you have suggestions, please let us know on the forum. If you want help getting your IoT device to lower and lower current levels, please get in touch with Golioth Solutions.

Today we are highlighting the AL2LOG, a cellular data logger by Golioth Design Partner AL2TECH. This is the latest entry into the Golioth Solutions Marketplace, announced last week. This device is a great way to capture a wide range of input data from an industrial setting, especially when you don’t know every type of measurement you want to take at the start of your project. You can deploy an AL2LOG to your factory floor or rugged environment and start monitoring signals and processing data on the cloud.

The AL2LOG is a general purpose logger

Let’s take a look at some of the specifications and use cases for the AL2LOG.

The case and PCB of the AL2LOG cellular data logger

A range of input options

The name of the game with the AL2LOG is flexiblility. That’s why you can interface it with the following signals from all types of sensors

  • GPIO
    • Digital Input
    • Dry Contact
    • Pulse Counter
  • CAN
  • RS-485
  • 4-20 mA
  • 0-10 V

Industrial users will recognize many of those signal types. Golioth has some Reference Designs that include more bespoke monitors targeted at specific verticals, like the CAN Asset Tracker and the MODBUS (RS-485) Monitor.

When you need to send control signals out into the world, you can do so with a programmable
power output (5 to 12V) for devices downrange of the logger, open drain outputs, as well as a 220VAC smart switch.

The device is powered off of two massive D-cell batteries for a 10 year battery life, but can also be powered from external sources when you want an even longer lifetime (or higher power utilization).

Built for speed, but not high power drain

While this design is based around the nRF9160 LTE-M / GPS / NB-IoT modem, it also relies on a higher speed ADC for advanced data capture. This Ultra Low Power acquisition and logging subsystem utilizes a true 14 bit ADC, and can efficiently capture high resolution data and cache it before sending it back to the Golioth Cloud. Utilizing Golioth’s new Batch Pipeline Destination, it’s super easy to bundle up a slug of readings and send them to the cloud to be unpacked later. Read about how Mike showcased sending data in batches.

A Case Study on AL2TECH’s Client Work

We recently profiled AL2TECH and their work with Hubwater, also seen in the video above. Hubwater is reducing waste and improving water distribution at commercial locations in Italy and beyond.

Read the full case study of AL2TECH and Hubwater

Some key points from that case study include how quickly they were able to get up and running using Golioth, and how they get to continually offer new services to their clients by utilizing Golioth Pipelines and OTA.

More Solutions Coming Soon

This is only the second of many solutions in our Golioth Solutions Marketplace. We are excited to share additional work of our Design Partners and Golioth Reference Designs. If you have a solution you’d like to share with Golioth and the world, please get in touch!

Ever wondered how to upload big chunks of data from IoT devices? Images are a great example, even a relatively small (and well compressed) photo is pretty large when speaking in terms of low-power, remote devices. The solution is to have the device break up the data into blocks that the server will reassemble into a file. The good news is that Golioth has already taken care of this! Today, we’ll walk through how to upload images from IoT devices using block upload.

Overview

There’s nothing particularly special about images, but they are usually fairly large; on the order of tens or hundreds of kilobytes. Golioth’s block upload works for whatever data you want to send, as we’re simply streaming bytes back to the server. Here’s what’s involved:

  1. Set up a Golioth Pipeline to configure how your data upload will be routed on the cloud
  2. Capture an image (or other large hunk of data)
  3. Write a callback function to supply the blocks of data
  4. Call golioth_stream_set_blockwise_sync(), supplying your callback

This really is all it takes to push lots of data up to the cloud from a constrained device.

As part of our AI Summer, I put together an example application that captures images from a camera module and uploads them to Golioth. It uses Zephyr and runs on an Espressif ESP32, Nordic nRF9160dk, or NXP mimxrt1024-evk.

1. Set up a pipeline

We’ll be sending data to Golioth’s Stream service so we need to add a pipeline to tell Golioth what to do with that data. For this example, we’re taking the received image and routing it to an Amazon S3 bucket. There is already a pipeline included in the example:

filter:
  path: "/file_upload*"
  content_type: application/octet-stream
steps:
  - name: step0
    destination:
      type: aws-s3
      version: v1
      parameters:
        name: golioth-pipelines-test
        access_key: $AWS_S3_ACCESS_KEY
        access_secret: $AWS_S3_ACCESS_SECRET
        region: us-east-1

Add this to your project by navigating to the Golioth web console, using the left sidebar to select Pipelines, and clicking the Create button. Don’t forget to enable your pipeline after pasting and saving it. You’ll need to add an access_key and access_secret for your S3 bucket to the Credentials→Secrets in your Golioth console.

Of course S3 is just one of many destinations. Check out the Destinations page of the Golioth Docs for more.

2. Capture an Image

The particulars of capturing an image with an embedded device are beyond the scope of this post. If you want to follow along exactly with the example, there’s information for purchasing and connecting a camera in the README file.

An electronic development board connected to a camera module with a few colorful wires

nRF9160dk connected to an Arducam Mega 5MP-AF

However, this example also demonstrates block upload of a large text file stored as a C header file. You can simply comment out the camera initialization code and use button 2 on your dev board to send the text file instead.

3. Write a Callback Function for Block Upload

This is where most of the work happens. The Golioth Firmware SDK will call this function each time it needs a block of data. You need to write your own function to fill a buffer with the correct block. Here’s what the function prototype looks like:

enum golioth_status block_upload_camera_image_cb(uint32_t block_idx,
                                                 uint8_t *block_buffer,
                                                 size_t *block_size,
                                                 bool *is_last,
                                                 void *arg)

Callback Arguments

Let’s do a quick explainer on what each of these functions represents:

  • block_idx: the block number to be sent to the server, starting at 0
  • block_buffer: a pointer to memory where you should copy your data
  • block_size: the size of the block–this dictates how many bytes you should copy into the buffer and should be reset to a smaller number if your last block is not this large
  • is_last: set this to true if you are sending the last block
  • arg: pointer to custom data you supply when beginning the block upload

Working example

The callback for uploading text files is a good place to learn about how this system works. I’ve simplified the function, removed all of the error checking and logging, and will use line numbers to walk through the code.

static enum golioth_status block_upload_read_chunk(uint32_t block_idx,
                                                   uint8_t *block_buffer,
                                                   size_t *block_size,
                                                   bool *is_last,
                                                   void *arg)
{
    size_t bu_offset = block_idx * bu_max_block_size;
    size_t bu_size = fables_len - bu_offset;

    if (bu_size <= block_size)
    {
        /* We run out of data to send after this block; mark as last block */
        *block_size = bu_size;
        *is_last = true;
    }

    /* Copy data to the block buffer */
    memcpy(block_buffer, fables + bu_offset, *block_size);
    return GOLIOTH_OK;
}
  • Line 7: calculate the offset to read source data by multiplying the block size by the block index number.
  • Line 8: calculate how many bytes of source data remain by subtracting the offset from the data source length.
  • Line 10-15: Check if the remaining data is smaller than the block size. If so we need to update block_size and is_last to indicate this is the final block.
  • Line 18: Copy the data into the block_buffer.
  • Line 19: Return a status code indicating block data is ready to send.

In reality there is more error checking to be done, and if a problem is encountered the block should be marked as last and an error code returned. View the entire function from the example.

Special cases for using an arg and reading from the camera

Two things are worth calling out in this step: user args and special camera memory.

The text upload in the example uses a struct to pass in the source data buffer and its length. This way, different files/data structures can use the same block upload callback. The struct indicating the data is passed in as a user argument and accessed inside the callback.

Uploading images from this particular camera is also a special case. The camera itself has RAM where a captured image is stored. In the example, that memory is read each time the block upload callback runs.

4. Call golioth_stream_set_blockwise_sync()

This is the easy part, we just need to trigger the block upload.

camera_capture_image(cam_mod);
err = golioth_stream_set_blockwise_sync(client,
                                        "file_upload",
                                        GOLIOTH_CONTENT_TYPE_OCTET_STREAM,
                                        block_upload_camera_image_cb,
                                        (void *) cam_mod);

Above is the code used by the example to capture an image and upload it. The cam_mod variable is a pointer to the camera module. Notice that it is passed as the user argument (the final parameter) when beginning the upload. This way, the block_upload_camera_image_cb() callback will have a pointer to the camera it can use to read image data and copy to the block_buffer for upload.

Once this runs, the image will be uploaded to Golioth and the pipeline will route it to an S3 bucket. Remember, devices connect to Golioth with CoAP, so you get the benefit of an efficient protocol and the ease of using the Firmware SDK to handle transmission to the cloud.

Make IoT Data Easy to Work With

Getting data to and from a large fleet of IoT devices has long been a tricky process. We don’t think that every company should have to reinvent the wheel. Golioth has built the universal connector for your IoT fleet, take it for a spin today!

This is a guest post by Joey Quatela, co-owner and computer engineer at Reflow Design Co. Reflow recently worked on a Bluetooth beacon demo that works with Golioth through celluar gateways.

This demo is targeted at tracking the location of small, high value items, without the need to add a cellular modem and GPS to each item. We combined the capabilities of local BLE beacons on microcontrollers running Zephyr and cloud connectivity through Golioth.

The problem

Say you run a construction site and want to prevent theft and keep track of all the equipment. Large equipment such as bulldozers and trucks have the power and the sticker price to support a separate cellular tracker. But small pieces like drills and hammers probably do not, they need to be powered by small batteries and run for a long time. One way to achieve this could be to attach a giant red flag to each piece of equipment and watch the site 24/7, but that wouldn’t be very practical (nor is it very fancy). A better solution would be to have each piece of equipment announce its presence to the surrounding area via some electronic device, and have another device listen for that announcement and send that data to the cloud.

How it works

Overview

At a high level, this concept is a simple Bluetooth beacon communicating to a central gateway that can interpret Bluetooth signals and translate them into useful data in the cloud, where it can be further processed. The advantage of this architecture is that it gets the data into the cloud as fast as possible, allowing for more complex computation off-chip! In this case, the Bluetooth signals come from a peripheral nRF52840 and are picked up by the central nRF9160-DK, both of which are explored in more detail later on in this post.

The tracker

A peripheral tracker, pictured below, is attached to each piece of construction equipment (or anything else that needs to be tracked). This tracker emits a simple Bluetooth Low Energy signal which announces its identity; “I am AA:BB:CC:DD:EE:FF,” for example. This is later tied to the identity of the device such as “Drill number 1”. This signal is then received by another device central to the location of interest, coined the gateway.

The gateway

The gateway, the nRF9160-DK in this case, is responsible for receiving the announcements from the peripheral trackers and interpreting their data, as well as sending that data to the cloud. When the gateway picks up an announcement it internally logs the announcing device’s name and received signal strength (RSSI), which it may then send to the Golioth Console to be graphed over time.

Golioth Features

Remote procedure calls

We structured this demo to have the gateway be “in charge” of verified devices on the tracking list. For this type of application to work, there must be a list of devices somewhere on the gateway that it should keep track of, otherwise it would report on every Bluetooth device in the area, which could be hundreds of signals! Hardcoding this list is one option, but does not grant the flexibility of adding and removing devices from the list. Creating and editing this list remotely is much more user friendly, and Golioth makes this very easy to do with Remote Procedure Calls (RPCs). This demo set up RPCs to add, remove, view, and clear all devices from the gateway’s list. The code block below shows the declarations of those RPC functions. The image then shows their use in the Golioth console.

static enum golioth_rpc_status add_device(zcbor_state_t *request_params_array, zcbor_state_t *response_detail_map, void *user_data);
static enum golioth_rpc_status remove_device(zcbor_state_t *request_params_array, zcbor_state_t *response_detail_map, void *user_data);
static enum golioth_rpc_status list_devices(zcbor_state_t *request_params_array, zcbor_state_t *response_detail_map, void *user_data);
static enum golioth_rpc_status clear_devices(zcbor_state_t *request_params_array, zcbor_state_t *response_detail_map, void *user_data);

When a new asset is added to a fleet (“Drill number 2”), an app calls the Golioth REST API to trigger the “Add device” RPC, which then pushes the new UID to the Gateway. Now the Gateway may begin passing messages from local devices through to the cloud.

Data Streaming

It’s extremely simple to send data to the cloud via the Stream API. Data from the gateway can easily be sent to the Stream in JSON format where it can be viewed on the console or extracted for visualization using another tool, like Grafana. Newer tools like Pipelines make it so that the data can be routed out to any 3rd party application or service.

After a device has been added to the allowlist via RPC, the Gateway would begin passing messages from that gateway through to the cloud, which the app could view on LightDB Stream (via the REST API) or via a 3rd party database service via Golioth Pipelines.

Other Applications

This demonstration offers a simple example of what can be done using BLE gateways and Golioth to track important assets across a localized area. Construction equipment on site is one example application, but others may include:

  • Supplies on a school campus
  • Equipment in an office building
  • Merchandise in a warehouse
  • Valuables in a storefront
  • And more!

Any situation where you may have valuables or a large quantity of assets concentrated into one environment, a cloud connected BLE tracking solution may be a great way to keep those assets accounted for.


IoT is all about data. How you choose to handle sending that data over the network can have a large impact on your bandwidth and power budgets. Golioth includes the ability to batch upload streaming data, which is great for cached readings that allows your device to stay in low power mode for more of the time. Today I’ll detail how to send IoT data in batches.

What is Batch Data?

Batch data simply means one payload that encompasses multiple sensors readings.

[
    {
        "ts": 1719592181,
        "counter": 330
    },
    {
        "ts": 1719592186,
        "counter": 331
    },
    {
        "ts": 1719592191,
        "counter": 332
    }
]

The example above shows three readings, each passing a counter value the represents a sensor reading, along with a timestamp for when that reading was taken.

Sending Batch Data from an IoT Device

The sample firmware can be found at the end of the post, but generally speaking, the device doesn’t need to do anything different to send batch data. The key is to format the data as a list of readings, whether you’re sending JSON or CBOR.

int err = golioth_stream_set_async(client,
                                   "",
                                   GOLIOTH_CONTENT_TYPE_JSON,
                                   buf,
                                   strlen(buf),
                                   async_push_handler,
                                   NULL);

We call the Stream data API above. The client and data type are passed as the first two arguments, then the buffer holding the data and the buffer length are supplied. The last two parameters are a callback function and an optional user data pointer.

Routing Batch Data using a Golioth Pipeline

Batch data will be automatically sorted out by the Golioth servers based on the pipeline you use.

filter:
  path: "*"
  content_type: application/json
steps:
  - name: step0
    destination:
      type: batch
      version: v1
  - name: step1
    destination:
      type: lightdb-stream
      version: v1

This example pipeline listens for JSON data coming in on any stream path. In step0 it “unpacks” the batch data into individual readings. In step1 the individual readings are routed to Golioth’s LightDB stream. Here’s what that looks like:

Note that all three readings are coming in with the same server-side timestamp. The device timestamp is preserved in the data, but you can also use Pipelines to tell Golioth to use the embedded timestamps.

Batch Data with Timestamp Extract

For this example we’re using a very similar pipeline, with one additional transformer to extract the timestamp from the readings and use it as the LightDB Stream timestamp.

filter:
  path: "*"
  content_type: application/json
steps:
  - name: step0
    destination:
      type: batch
      version: v1
  - name: step1
    transformer:
      type: extract-timestamp
      version: v1
    destination:
      type: lightdb-stream
      version: v1

Note that we didn’t even need an additional step, but simply added the transformer to the step that already set lightdb-stream as the destination.

You can see that the Linux epoch formatted timestamp has been popped out of the data and assigned to the LightDB timestamp. Extracting the timestamp is not unique to Golioth’s LightDB Stream service.

Streaming data may be routed anywhere you want it. For instance, if you wanted to send your data to a webhook, just use the webhook destination. If you included the extract-timestamp transformer, you data will arrive at the webhook with the timestamps from your device as part of the metadata instead of nested in the JSON.object.

Using a Special Path for Batch Data

What happens if your app wants to send other types of streaming data beyond batch data? The batch destination will automatically drop data that isn’t a list of data objects. But you might like to be more explicit about where you send data and for that you can easily create a path to receive batch data.

filter:
  path: "/batch/"
  content_type: application/json
steps:
  - name: step0
    destination:
      type: batch
      version: v1
  - name: step1
    transformer:
      type: extract-timestamp
      version: v1
    destination:
      type: lightdb-stream
      version: v1

This pipeline is nearly the same as before with the only change on line 2 where the * wildcard was removed from path and replaced with "/batch/". Now we can update the API call in the device firmware to target that path:

int err = golioth_stream_set_async(client,
                                   "batch",
                                   GOLIOTH_CONTENT_TYPE_JSON,
                                   buf,
                                   strlen(buf),
                                   async_push_handler,
                                   NULL);

Although the result hasn’t changed, this does make the intent of the firmware more clear, and it differentiates the intent of this pipeline from others.

Sample Firmware

This is a quick sample firmware I made to use while writing this post. It targets the nrf9160dk. One major caveat is that the function that pulls time from the cellular network is quite rudimentary and should be replaced on anything that you plan to use in production.

To try it out, start from the Golioth Hello sample and replace the main.c file. This post was written using v0.14.0 of the Golioth Firmware SDK.

Wrapping Up

Batch data upload is a common request in the IoT realm. Golioth has not only the ability to sort out your batch data uploads, but to route them where you want and even to transform that data as needed. If you want to know more about what Pipelines brings to the party, check out the Pipelines announcement post.

Golioth is expanding its Reference Design portfolio by adding an OpenThread Demo, a Reference Design based on our known and well-tested Reference Design Template. The purpose of the OpenThread Demo is to add Thread networking capability to the RD Template so anyone using Thread and Golioth can start development immediately, use it as a basis for their project, and take full advantage of Golioth’s Device Management, Data Routing, and Application Service capabilities.

Thread Recap

Thread is an IPv6-based networking protocol designed for low-power Internet of Things devices. It uses the IEEE 802.15.4 mesh network as the foundation for providing reliable message transmission between individual Thread Devices at the link level. The 6LoWPAN network layer sits on top of 802.15.4, created to apply Internet Protocol (IP) to smaller devices. In almost all cases, it’s used to transmit IPv6 Packets.

If you need a network of devices that can communicate with each other and connect to the Internet securely, Thread might be the solution you’re looking for.

Built it yourself

The follow-along guide shows how to build your own OpenThread Demo using widely available off-the-shelf components from our partners. We call this Follow-Along Hardware, and we think it’s one of the quickest and easiest ways to start building an IoT proof-of-concept with Golioth.

Hardware

Every mesh network needs some hardware, and for the OpenThread Demo, you will need a Thread Border Router and a Thread node. This demo doesn’t need additional sensors or an actuator, as there are generated values created by the code in the Reference Design Template (ie simulated values). Later you can modify our other Reference Designs and their hardware to get to a prototype or production device that is more specific to a vertical like Air Quality Monitoring or DC Power Monitoring.

Border Router

A Thread Border Router connects a Thread network to other IP-based networks, such as Wi-Fi or Ethernet, and it configures a Thread network for external connectivity. It also forwards information between a Thread network and a non-Thread network (from Thread nodes to the Internet). The Border Router should be completely invisible to Thread Devices, much like a Wi-Fi router is in a home or corporate network.

In this demo, we use a commercially available GL-S200 Thread Border Router designed for users to host and manage low-power and reliable IoT mesh networks.

GL-S200 provides a simple Admin Panel UI to configure the Border Router and a Topology Graph to see all the end node devices and their relationship. As a bonus, it also does NAT64 translation between IPv6 and IPv4, making it a real plug-and-play solution.


Thread Node

Now that the centerpiece of our Thread network is sorted, the next part is a Thread node. In the follow-along guide, we built a Thread node based on the nRF52840 DK. The node is built using Zephyr, and the OpenThread stack will be compiled into it. The GitHub repository used in the guide is open source, so you can build the application yourself, or you can use the pre-built images for the nRF52840 DK or Adafruit Feather nRF52840.

Firmware

Thread node firmware is based on the Reference Design Template, a starting point for all our Reference Designs. With all Golioth features implemented in their basic form, you can now use Device Management, Data Routing, and Application Services with Thread network connectivity.

OTA Updates

Adding Thread support to a device is not cheap, memory-wise. The firmware image is larger than 500kB, and the on-chip flash of the nRF52840 DK has a size of 1MB. Luckily, both the nRF52840 DK and the Adafurit Feather have an external flash chip, making the OTA updates possible. Any custom hardware you create in the future should also follow this model of having external flash mapped to the nRF52840.

To create a secondary partition for MCUBoot in an external flash, we must first enable it in the nrf52840dk_nrf52840.overlay file:

/ { 
    chosen { 
        nordic,pm-ext-flash = &mx25r64; 
    };
};

The CONFIG_PM_EXTERNAL_FLASH_MCUBOOT_SECONDARYKconfig option is set by default to place the secondary partition of MCUboot in the external flash instead of the internal flash (this option should only be enabled in the parent image).

To pass the image-specific variables (device-tree overlay file and Kconfig symbols) to the MCUBoot child image, we need to create a child-image folder in which we  need to update the CONFIG_BOOT_MAX_IMG_SECTORS Kconfig option. This option defines the maximum number of image sectors MCUboot can handle, as MCUboot typically increases slot sizes when external flash is enabled. Otherwise, it defaults to the value used for internal flash, and the application may not boot if the value is set too low. In our case, we updated it to 256in the child_image/mcuboot/boards/nrf52840dk_nrf52840.conf file.

CONFIG_BOOT_MAX_IMG_SECTORS=256

Connecting to Golioth Cloud

Thread nodes utilize IPv6 address space, and the question is how to communicate with IPv4 hosts, such as Golioth Cloud.

Golioth Cloud has an IPv4 address, and the Thread node needs to synthesize the server’s IPv6 address in order to connect to it. OpenThread doesn’t use the NAT64 well-known prefix 64:ff9b::/96; instead, Thread Border Routers publish their dynamically generated NAT64 prefix used by the NAT64 translator in the Thread Network Data. Thread nodes must obtain this NAT64 prefix and synthesize the IPv6 addresses.

While the process of synthesizing IPv6 addresses is automatically handled in the OpenThread CLI when using the Zephyr shell and pinging an IPv4 address (e.g. ot ping 8.8.8.8), it’s important to note that this process needs to be specifically implemented in applications.

As part of the Firmware SDK, the Golioth IPv6 address is automatically synthesized from the CONFIG_GOLIOTH_COAP_HOST_URI Kconfig symbol using the advertised NAT64 prefix by leveraging the OpenThread DNS. Even if the Golioth host URI changes within the SDK, you won’t need to change your application.

Learn more

For detailed information about the OpenThread Demo, check out more details the project page! Additionally, you can drop us a note on our Forum if you have questions about this design. If you would like a demo of this reference design, contact [email protected].


Piecing together different pieces of technology can have a multiplicative effect. I think that’s what happened with this demo: we paired Wi-Fi locationing, low cost hardware, Golioth Pipelines, and n8n (an API workflow tool) to create a “geofence”.

A geofence is a virtual perimeter used to set up alerts or take actions once a device moves outside that virtual perimeter. The example we gave in the video is if you had a tracker on your cat and you wanted to take an action once the device was outside a particular area.

Hardware

The reason we’re calling this a “$2 geofence” is because it’s enabled by the ESP32-C3, a low cost module from Espressif. We put this on the Aludel Elixir as a backup connectivity method if we were again at a conference with no LTE-M coverage.

The ESP-AT firmware does what it sounds like it should do: it responds to AT commands from other microcontrollers talking to it over serial (as many cellular modules also do). One key enhancement is that the ESP-AT mode already works as a connectivity method; in fact, we utilize the ESP-AT firmware as an offloaded Wi-Fi modem when we build and test for the nRF52840 in our Continuously Verified Hardware. In Zephyr, there is an option for utilizing the ESP-AT modem as the main offloaded Wi-Fi modem. This makes it ‘invisible’ to the Zephyr program and acts like any other network interface, since it is built on top of the Wi-Fi subsystem in Zephyr.

One change that was required is we had to re-write how we pulled the information off the ESP-AT modem. Normally the wifi scan shell command returns the (human readable) names and signal strengths of all the access points (APs) visible to the modem. Instead, we want mac address and signal strength, as that’s what’s expected by the API service we’ll describe below.

Golioth Pipeline

We start by scanning Wi-Fi APs and the tower that the cell modem is connected to. Then we publish that on the Stream service up to the Golioth cloud. Because we’re publishing to a specific topic (instead of my normal, generic default of “sensor”), we can start to peel off that data and send it somewhere interesting. How? With pipelines, of course!

I set up the pipeline to watch on the path wifi_lte_loc_req (a name of my own making, this could be any arbitrary name). That data gets sent out to a webhook going to n8n. Webhooks more broadly are a generic way to interface between a lot of cloud services, but we use it to send data into the api platform.

n8n

Now that the data is being sent into n8n (a self hosted instance, no less!) we can start doing interesting things with it. This is an area that is full of similar offerings, sometimes specifically targeted at IoT, and other time targeted a business workflows:

If you’re newer to working with APIs and tying stuff together, it might take a bit of time to figure out how queries should be structured and how your setup should respond when there are errors.

API service

We send data from the device to Golioth already formatted for what the location service API service expects. This is not required in the slightest, as Golioth’s Pipelines can morph and transform data to meet the needs of the endpoint. But…why not? It kind of makes sense to have the device publish data in a format that matches the target API service. Then later if we decide to re-target an alternative service, we can use transformations to mold the incoming data to what that new service expects.

For this demo, I’m using the here.com API service. I like that it combines LTE tower + WiFi AP for its API, which means it will lean on whichever provides a more accurate reading (normally Wi-Fi). Again, this service is one of many! There are a range of API services because this is something that phones are often using to determine location from apps.

Once we receive the lat, lon, and accuracy, we actually pass the data back to the device using LightDB State. This two-sided database is a good defacto way to send arbitrary data from the cloud to the device. In the case of n8n, we’re pulling through the original project name, device identifier, and then publishing to the Golioth REST API. This makes it a data “round trip” from device to cloud and back down to device.

Logic and alerts

Since the data is already on the cloud in an API marketplace like n8n…why not use that data to do some cloud side processing? In this case, I wanted to set up a geofence to show that we can trigger logic and alerts on the cloud and even call 3rd party APIs like Slack and Twilio.

Geofence alert messages being sent into Slack

I asked ChatGPT to help me out with some javascript that would help calculate a true/false output so that I could use that to trigger downstream logic. We insert the lat/lon data that was returned from here.com into this algorithm and it pops out whether or not we are inside the “fence”. As of this writing, I am still using a fixed location for where the center of the “fence” is located, as well as the radius of said “fence”. I’m certain it’s possible in n8n or other tools, perhaps as another Webhook or a configurable variable.

Future demos

Hopefully one thing you noticed from this demo is just how much can be enabled with Golioth’s pipelines. Since Golioth takes care of reliably delivering your data to the cloud, the rest is really a matter of configuration. It’s also difficult to know all the different APIs that could be utilized out in the world. Pulling these elements together shows how a hardware or firmware engineer could enact complex device and business logic to create interesting applications out in the real world. If you need any help getting your next project off the ground, stop by our forum!

This is a guest post by Sandra Capri, CTO at Ambient Sensors, a Golioth Design Partner who regularly designs and deploys Bluetooth Solutions.

My previous article described a demo that used the Golioth console to send RPCs (Remote Procedure Calls) and device settings to a Bluetooth Mesh. The purpose was to show how easy it is to control a Bluetooth Mesh from an internet connected device. This article is to give some details as to how I created the demo.

But first, let me give you a quick tutorial on the Bluetooth Mesh LC server (the following diagram represents the information from the Bluetooth® SIG specification MshMDL_v1.1):

The Y-axis is the brightness of a luminaire (“the device that is lighting up”). LuxLevel/Lightness is defined for three levels: On, Prolong, and Standby. The general rule is that On is the brightest setting, Prolong is dimmer than On, and Standby is the dimmest (or completely off). The X-axis is the time axis during which the luminaire maintains each of those lightness levels.

Each bbc:microbit in the demo implements an LC Server which while following the above diagram:

  1. Transitions the LEDs to the “On” lightness level (LuxLevel/Lightness On)
  2. Stays at that lightness level for the “Run” time (Light LC Time Run)
  3. Dims the LEDs to the “Prolong” lightness level (LuxLevel/Lightness Prolong)
  4. Stays at that lightness level for the “Prolong” time (Light LC Time Prolong)
  5. Dims the LEDs to the “Standby” level (LuxLevel/Lightness Standby)

The Device Settings

The demo needed a way of setting these five parameters (the three lightness levels and two times). The Device Settings page of the Golioth console was ideal for this. I mapped the settings as follows:

  • Device setting name
  • TIME_RUN
  • TIME_PROLONG
  • LVL_RUN
  • LVL_PROLONG
  • LVL_STANDBY
  • LC server value
  • Light LC Time Run
  • Light LC Time Prolong
  • LuxLevel/Lightness On
  • LuxLevel/Lightness Prolong
  • LuxLevel/Lightness Standby

And of course, the Mesh firmware specifies default values for each of these.  But when doing demos (or development), there are many times you want to change these values.  If you don’t have a handy LC client around, you often resort to changing the defaults in the firmware and pushing over the air updates.  And if you have 8 (or more) LC servers to update in a mesh, that gets painful quickly.

In the demo, you can set TIME_RUN to 5 seconds, so when the LEDs first turn on, they stay “On” for 5 seconds.  If that time is too short for you, set it to 20 seconds, and the next time the LEDs turn “On”, they stay there for 20 seconds.  Similarly with TIME_PROLONG – you easily define how long the lights stay at “Prolong.”

And then comes the individual light levels – do you want the Run level to be 100%, Prolong at 50%, and Standby at 0% (off)?  Then all you need to do is change a setting.  Voilà, it’s done.  This is much easier than modifying every LC server firmware on each device, every time you want to view a new set of levels and times.

The astute reader will notice that there are other values in the diagram above (and there are several other values in the LC Server model as well), but only a subset is implemented for simplicity’s sake.

The Remote Procedure Calls

Now what about those RPCs?  Several were written specifically for this demo, turning the LEDs on and off in different ways.   Some turn off the control of the LC server, and some turn it back on.  The following functions were implemented:

  • set_light
    • This is often the first RPC sent – it demonstrates the basic LC model functionality.  A set_light on RPC tells the microbits to follow the LC server diagram (shown above).  Each microbit ramps its LEDs to the “On” lightness level, then starts dimming, eventually ramping back to “Standby”.  A set_light off RPC tells the microbits to immediately set the LEDs to “Standby”, bypassing the ramping and the “Prolong” level.  Note that pushing the button on the Thingy91 sends the same command as the set_light RPC.
  • lightness
    • This RPC overrides the lightness level, turning off the LC server.  The lightness will stay at the specified percentage level until another command is received.
  • lc_mode
    • This RPC turns the LC server on or off.  This sends the LC model command to turn on/off the server.  Anytime the LC server is turned off (e.g., with a lightness command), this is the only command that can turn it back on.
  • gen_on_off
    • This RPC is specific to the structure of an LC server.  Every LC server node has at least two elements – one with a Lightness Server, and one with an LC server.  The gen_on_off RPC sends a generic on/off command to the specified element.  The first parameter is the on/off command (1 == on, 0 == off), and the second parameter specifies the element (0 == LC server, 1 == Lightness server).

How Does the Code Know about Changes to the Device Settings?

Golioth provides a registration function for device settings.  The firmware passes a callback function to the register function.  Anytime a device setting changes, the callback function is invoked, and it receives:

  1. The string name of the setting (e.g., “TIME_RUN”)
  2. A structure containing the value.

The firmware then does a simple name string comparison, and then we send that value on to the Mesh (more about that later).

int err = golioth_settings_register_callback(settings_client, on_setting);
if (err) {
    LOG_ERR("Failed to register settings callback: %d", err);
}

And the definition of the on_setting() callback:

enum golioth_settings_status on_setting(const char *key, const struct golioth_settings_value *value)
{
…
    if (strcmp(key, "TIME_RUN") == 0) {
        /* time in seconds - numeric */
        if (value->type != GOLIOTH_SETTINGS_VALUE_TYPE_INT64) {
            LOG_DBG("Received TIME_RUN is not an integer type.");
            return GOLIOTH_SETTINGS_VALUE_FORMAT_NOT_VALID;
        }
        /* Only update if value has changed */
        if (_time_run_sec == (int32_t)value->i64) {
            LOG_DBG("Received TIME_RUN already matching local value.");
        } else {
            _time_run_sec = (int32_t)value->i64;
            _time_run_changed = true;
            // tell system thread to send the property data across the UART to
            // the BLE chip
            wake_system_thread();
        }
        return GOLIOTH_SETTINGS_SUCCESS;
    }
…
}

How Does the Code Know About RPCs?

It’s a slightly different mechanism, but straightforward: Golioth provides an RPC registration function. For every RPC you create, provide it to the registration function along with a string (linking your RPC function to the string name in the console). When the string name is invoked in the console, the local RPC function is called, passing any provided parameters. In the demo, we send that information to the Mesh (more on that later). Code snippet:

err = golioth_rpc_register(rpc_client, "lightness", on_lightness, NULL);
rpc_log_if_register_failure(err);

And earlier in the file we defined RPC function on_lightness() as:

static enum golioth_rpc_status on_lightness(zcbor_state_t *request_params_array,
                                            zcbor_state_t *response_detail_map,
                                            void *callback_arg)
{
    bool ok;
    double valuef1;
    uint8_t value1;

    ok = zcbor_float_decode(request_params_array, &valuef1);
    if (!ok)
    {
        LOG_ERR("Failed to decode RPC int1 argument");
        return GOLIOTH_RPC_INVALID_ARGUMENT;
    }

    value1 = (uint8_t) valuef1;
    LOG_DBG("Received argument '%d' from 'lightness' RPC", value1);
    send_lightness(value1);

    return GOLIOTH_RPC_OK;
}

Passing commands between nRF9160 and nRF52840

Up to now, everything has been communication between the nRF9160 and Golioth (via LTE-M or NB-IoT). So now the nRF9160 is going to send this information to the nRF52840 (the BLE chip configured as an LC client). The UART is a convenient communication path provided by the Thingy91. When any device setting changes or an RPC is called, the nRF9160 maps that to a series of bytes to send to the BLE chip.

For example, when the nRF9160 calls send_lightness(value1), it executes:

bytebuf[0] = '3'; // lightness cmd – character
bytebuf[1] = v1;  // integer val, not character - percentage
err = uart_tx(Uart, bytebuf, sizeof(bytebuf), SYS_FOREVER_US);

which sends those two bytes to the BLE chip.  Upon receiving the UART data, the BLE chip parses the lightness command, grabs the lightness value, and then sends a Bluetooth Mesh lighting command to tell the micro:bits to set the lightness value.

How does the BLE chip (the nRF52840) send Mesh commands?

The Bluetooth Mesh has a different communication method from the traditional BLE central/peripheral characteristic write/read method. The Mesh doesn’t really have the idea of a connection, nor of a central or peripheral. Every device on the Mesh is called a node, and Mesh nodes send messages that every node on the Mesh can hear (more details in a future blog).

For the demo, the nRF52840 has been programmed as a full Bluetooth Mesh node – specifically as a client (it sends commands to servers). Each LC server (micro:bit) listens for commands from the nRF52840 clients. Yes, that is plural – clients…The nRF52840 node has

  • One LC client
  • Two Generic On/Off clients
  • One Lightness client.

When the node wants to send the LC mode command, it uses the LC client function:

int bt_mesh_light_ctrl_cli_mode_set(…,…,bool enabled,…);

where the “enabled” parameter will set the LC Mode on or off.

When it wants to send a Lightness command, it uses the Lightness client function:

int bt_mesh_lightness_cli_light_set(…,…,… *set,…);

where the “set” parameter points to a structure containing the lightness level.

In general, when a node needs to send a Mesh command, it calls the appropriate client model function to send it. So, when an LC model command needs to be sent, we call an LC client model function. When a Generic On/Off model command needs to be sent, we call a Generic On/Off client model function (and similarly with Lightness commands, or any of the other commands that have been defined in the Bluetooth Mesh Model Specification).

And then the micro:bits?

The final piece of the puzzle is the micro:bits – they are programmed as mesh nodes, implementing the LC server. Each one “hears” the commands from the client node, and independently acts upon those commands. Note that each server node can return status(es) as a result of these commands, and the client node can act upon these statuses (this was not implemented in the demo, for simplicity).

The full signal chain, described

So now you have an overview of the process – specifically how:

  • The nRF9160 receives the device settings and RPCs from the Golioth console,
  • The nRF9160 sends that info over the UART to the nRF52840,
  • The nRF52840 sends that info, translated into Bluetooth Mesh commands, to the rest of the nodes in the Mesh (the micro:bits).

Bluetooth Mesh and the LC server nodes are simple in concept, but often difficult in execution. With the Thingy91 running the Golioth Firmware SDK, it has gotten a lot easier to control and extend Bluetooth Mesh demos to show to clients.

This is a guest post by Sandra Capri, CTO at Ambient Sensors, a Golioth Design Partner who regularly designs and deploys Bluetooth Solutions.

We have been building Bluetooth® Mesh (hereafter referred to as “BT Mesh”) products for a long time. In fact, we helped write some of the BT Mesh models for Nordic, so we are very familiar with it. However, we’ve always been dependent upon applications written for phones to control the BT Mesh, which can be limiting while doing Mesh development or putting together quick prototypes for potential customers. This particular demo allowed us to add network connectivity by building on top of Golioth’s Thingy91 demo, which unlocks a faster design iteration cycle when it comes to BT Mesh. We asked Chris to help record the demo video above.

Controlling from afar

This demo shows that Golioth can control a BT Mesh-based lighting system where each of the individual components (nodes in the mesh) of the lighting system, (e.g., switches, luminaires, sensors), contain a BLE SoC. Normally a user must be within a few tens of meters of a Bluetooth device to interact with it using (for example) a mobile app on a smartphone. But instead, we show Golioth connecting via LTE-M cellular service to a Nordic Semiconductor Thingy91 (combined nRF9160 cellular modem and nRF52840 BLE SoC) which then communicates to the rest of the Bluetooth mesh, thus allowing an authorized user from anywhere on Earth to control the lights (represented in the demo by a series of bbc:microbits). This gives the user control over all aspects of the Mesh servers – sending commands and updating settings without needing to be physically present.

How it works

The button on the Thingy91 is programmed to function as a simple on/off light switch. A much greater set of control functions for the BT Mesh comes from the Golioth web interface (Console). The demo shows a small sample of the kinds of control that can be accomplished using Golioth:

  • Ramping up the LED level on the lights
  • Defining the LED levels
  • Setting the time to keep the LEDs at those levels before ramping down
  • Overriding the LED level – preventing ramping

The Thingy91 contains an nRF9160 LTE-M chip and an nRF52840 BLE chip – this represents the bridge between LTE-M and the BT Mesh. The bbc:microbits contain an nRF52833 BLE chip, and represent the luminaires (Mesh lighting nodes). The Golioth SDK has been integrated into the code for the nRF9160, connecting the Thingy91 to Golioth. When a user executes a Remote Procedure Call (RPC) or sets a device setting, this information is sent via LTE-M to the nRF9160. That chip converts that information into opcode values sending it via UART to the nRF52840 chip. The nRF52840 then builds an appropriate Bluetooth mesh command and sends it to the Mesh network (wirelessly). Each lighting node on the network receives and executes the Bluetooth Mesh command.

In this demo, each lighting node (bbc:microbit) implements the Bluetooth Mesh LC server: an intelligent Lighting Controller. If the LC element on the lighting node receives a Generic On command, it ramps up its LED level to the configured lightness on value and maintains that level for the period of the configured run on time. After that time has expired, it will fade the light level to the configured prolong lightness level and maintain that for the configured prolong time. Then it fades the LEDs to the configured standby lightness level.

Each of these configurable lightness levels and times can be changed in the Device Settings.

Once these are set, an RPC can initiate the LC server control, or it can override the LC server and set an exact light level preventing the LC server from controlling the lights. Additionally, there is an RPC that will re-enable the LC server.

Other applications

This demo gives just a taste of the control that Golioth can provide with the Bluetooth Mesh. In addition to lights and switches, many different classes of devices can be on a Mesh:

  • Burglar and fire alarms
  • Smart locks
  • Thermostats
  • All kinds of sensors (e.g., temperature/humidity, photometry, motion, power, environmental, …)
  • More!

Commands can flow from the Cloud to each device, and status can be returned to the Cloud (e.g., alerts, alarms, etc.) Are the warehouse doors locked and the burglar alarm set? Well let’s check Golioth – oops, still unlocked! Let’s fix that. OK, Golioth just locked the front door, verified the locked status of the other doors, and turned on the burglar alarm. And just for good measure, we checked that the current temperature and humidity are within acceptable parameters. We didn’t even have to leave home to do that.

Now that we have the ability to control all this from the Cloud, we’ve unlocked new designs for our customers, and we’re able to spin up test deployments faster than ever.

Jerónimo Agulló is an open-source projects enthusiast and a Zephyr RTOS contributor. He has worked on different IoT projects across different industries, from research centers such as the University of Sevilla, to large companies like Ferrovial Construction. Check out his work on his GitHub profile.

Location is a basic part of the most interesting IoT systems. It’s not just about loss prevention; geolocation opens the door to several applications and enhances the management of devices. In many cases, this involves Global Navigation Satellite System (GNSS).

Position is so important in IoT that the latest Zephyr release (v3.6.0) has added a new API for GNSS based on the NMEA0183 standard. Today I’m going to explain the basics of GNSS, what NMEA means, and dive into this awesome new Zephyr feature.

The basics of the NMEA standard

NMEA is the acronym for the National Marine Electronics Association, an organization created before GPS was invented. Its aim is creating better communications with manufacturers. I can assure you that they achieved their goal with GNSS.

Their most extended and well-known norm is the NMEA0183 protocol, which has become the GNSS standard for almost all manufacturers. It facilitates module integration and new applications development.

NMEA data is transmitted from a source such as a GPS module (known as a “Talker”) to equipment, such as our running Zephyr device (known as a “Listener”). One important aspect is that a single talker can communicate to many listeners.

From the electronic perspective, NMEA0183 originally used RS-422, but now uses several interfaces such as UART, USB, RS-232, WIFI, Bluetooth, and more. We can consider NMEA protocol as a common message structure standard. NMEA0183 protocol makes software developer life easier due to the standardization between GNSS devices.

NMEA message structure

Each NMEA sentence contains only ASCII characters, starting with the dollar symbol “$” and ending with the <CR> (Carriage return) and <LF> (Line feed) characters. The content of the message is a tuple, separated by commas. This starts with an NMEA identifier, followed by data, and ending by a checksum preceded by an asterisk “*”.

For a better understanding, let’s examine a popular NMEA sentence from a Quectel module. “GGA” sentence contains the Global Positioning System fix data, time, position, and fix related data for a GNSS receiver.

$GPGGA,102744.00,6155.393269,N,00848.433734,E,1,03,1.6,821.5,M,52.0,M,,*70
  • $GPGGA is the sentence identifier which can be split into “GP” which means the GNNS type, in this case GPS, and “GGA” which is the sentence identifier.
  • 102744.00 is the time of fix (hhmmss).
  • 6155.393269,N is the latitude (ddmm.mmm format, N for North).
  • 00848.433734,E is the longitude (dddmm.mmm format, E for East).
  • 1 is the fix quality indicator.
  • 03 is the number of satellites being tracked.
  • 1.6 is the horizontal dilution of precision.
  • 821.5,M is the altitude in meters above mean sea level.
  • 52.0,M is the height in meters of geoid separation.
  • *70 is the checksum (Note: this is not the correct checksum for this payload, we moved the location manually)


All talker devices don’t rely on GPS or on different constellations simultaneously. The most common constellations are GLONASS (GL), BEIDOU(DB or GB) and GALILEO (GA).

Besides GGA, other popular NMEA sentences are:

  • RMC: Recommended Minimum Navigation Information
    • This contains information similar to GGA such as the latitude and longitude and also the speed over ground (in knots), the date and the magnetic variation (in degrees).
  • GSV: Satellites in View
    • This NMEA message prints information such as the total number of satellites in view for each constellation and for each satellite its number (PRN), elevation in degrees, azimuth in degrees and Signal to Noise Ratio (SNR) in dB. Each GSV sentence contains the information of more than one satellite.

The previous NMEA sentences are named as “talker sentences”. In addition to that, there are “Proprietary sentences” and “query sentences”. On the one hand, the proprietary sentences start with “$P” and allow manufacturers to define custom NMEA sentences format for custom functions such as power management. On the other hand, the query sentences are the means for listener to request a particular sentence from a talker

Zephyr GNSS API

If you’ve reached this point, it means that you already know and like Zephyr RTOS. If you’re not familiar with Zephyr, I encourage you to familiarize yourself with it by using this getting started guide.

Zephyr RTOS is not just a simple scheduler for simple applications. Zephyr is a whole operating system with drivers, services and common APIs which facilitates the new developments and sensors and boards exchange. I would go beyond and say that Zephyr is even a complete ecosystem with integration in awesome clouds such as Golioth.

A great example of this affirmation is the new Zephyr GNSS support in version v3.6.0. The GNSS API is built upon the modem subsystem, which provides the necessary modules to communicate with modems. The GNSS subsystem covers everything from sending and receiving commands to and from the modem, to parsing, creating and processing NMEA0183 messages.

The source code can be found under the path zephyr/drivers/gnss, which is divided into specific GNSS module drivers with custom features such as power management, some files with utils and a generic NMEA0183 driver. Covering in detail each of those utils would require a whole new post. However, I will provide a brief overview of each of them:

  • gnss_dump
    • A set of utilities to get, convert and print GNSS information into readable and useful data.
  • gnss_nmea0183 and gnss_parse
    • NMEA0183 utilities such as checksum calculation, parsing a ddmm.mmmm formatted coordinates to nano degrees or parsing the content of GGA, RMC and GSV NMEA messages.
  • gnss_nmea0183_match
    • This code is based on “modem_chat” match handlers, a Zephyr utility to process messages from modems. The callbacks to parse GGA, RMC and GSV messages are defined here.

Zephyr has created a generic NMEA driver which can be used for any NMEA talker. As any other driver, it is instantiated by the DEVICE_DT_INST_DEFINE macro. It includes the following code to call the callbacks defined in the gnss_nmea0183_match.c for corresponding NMEA identifier:

MODEM_CHAT_MATCHES_DEFINE(unsol_matches,
MODEM_CHAT_MATCH_WILDCARD("$??GGA,", ",*", gnss_nmea0183_match_gga_callback),
MODEM_CHAT_MATCH_WILDCARD("$??RMC,", ",*", gnss_nmea0183_match_rmc_callback),
#if CONFIG_GNSS_SATELLITES
MODEM_CHAT_MATCH_WILDCARD("$??GSV,", ",*", gnss_nmea0183_match_gsv_callback),
#endif
);

GNSS example in Zephyr

Now you know about NMEA0183 and the Zephyr GNSS API, so get your hands dirty and write some code! The full code can be found in my github repository:

https://github.com/jeronimoagullo/Zephyr-GNSS-Sample

KConfig Changes

In this example, I will show you how to configure a microcontroller in Zephyr to use a GNSS module which supports NMEA0183. For this aim, I will use an ESP32S3-Mini-1 development board along with an Air530z GNSS module. We’re going to modify our prj.conf file

  1. Add the CONFIG_GNSS=y kconfig variable to add the GNSS support.
  2. Add the variables CONFIG_GNSS_SATELLITES=y to display satellites’ information
  3. Add CONFIG_GNSS_DUMP_TO_LOG=y to print GNSS information like the fixation status, coordinates and time.

Devicetree Changes

Next, we’ll configure the device tree correctly for our GNSS module. In this case, the Air530z GNSS module uses an UART interface. By default, ESP32S3 has the UART0 configured in pins 43 and 44. However, this UART is configured at 115200 bps and used for both programming the board and by Zephyr to print messages into the serial terminal. This is not a good idea.

What is the solution? The use of another UART, for example, the UART1. However, it is not defined in esp32s3_devkitm.dts. So let ‘s do it!

According to GPIO, the UART1 uses the pins 17 and 18 (you can use others too). I have chosen these default pins and defined them in the device tree overlay using the pin control subsystem. The macro of the pins can be found in the file zephyr/include/zephyr/dt-bidings/pinctrl/esp32s3-pinctrl.h you can find your board pins in the corresponding header file of your board.


&pinctrl {

  uart1_pins: uart1_pins {
    group1 {
      pinmux = <UART1_TX_GPIO17>;
      output-high;
    };

    group2 {
      pinmux = <UART1_RX_GPIO18>;
        bias-pull-up;
      };
    };

};

Then, in the UART node, I have added our above pin definition and a “gnss-nmea-generic” compatible device. I have created an alias to this GNSS device to facilitate the access from the main code.

&uart1 {

  status = "okay";
  current-speed = <9600>;
  pinctrl-0 = <&uart1_pins>;
  pinctrl-names = "default";
  gnssdev: gnss-nmea-generic {
    compatible = "gnss-nmea-generic";
  };

};

Finally, the main code uses the GNSS_DATA_CALLBACK_DEFINE macro to define a callback for getting the information about satellites in view and another for GNSS information such as time, coordinates and tracking satellites. The following screenshot depicts the application output:


We managed to get the GNSS data!

Final thoughts

We have covered in this post what NMEA means and its importance in GNSS as well as the main NMEA messages, how the new Zephyr GNSS API relies on NMEA, and a sample of how to localize our device using Zephyr. Now, it is your turn to send the GNSS data to Golioth cloud!