Golioth collects data from your entire IoT sensor fleet and makes it easy to access from the cloud. Data visualization is a common use case and we love using Grafana to make dashboards for our fleets. It can start to get tricky if your devices are sending back mountains of different data. We’ll demonstrate how you can use Golioth REST API Queries to capture specific data endpoints from devices. By doing so, you can focus on the most important data points and utilize them to create powerful visual dashboards in Grafana.

Don’t Mix Your Endpoints

By far the easiest way to query streaming sensor data is just to ask for all of the events. But this presents an interesting challenge in Grafana. If your query response includes records that don’t have your desired endpoint, Grafana will see that as null and most often this will break your graph:

Grafana error screenshot

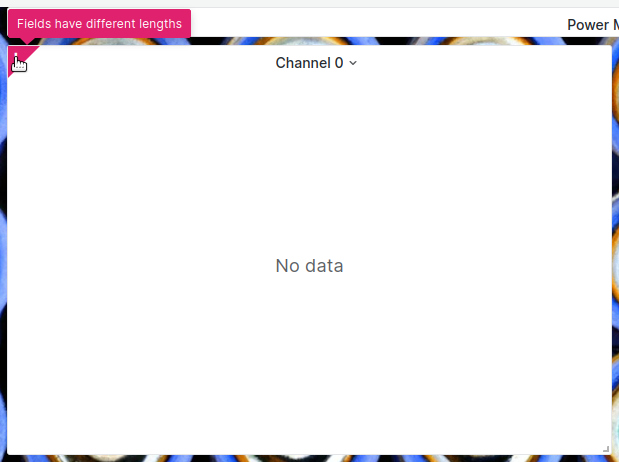
Grafana showing the “Fields have different lengths” error

This is because the graph is targetting the sensor endpoint, but if we look at Golioth we can see that the device is sending data to the battery endpoint in between sensor readings. The sensor endpoint doesn’t exist for those readings.

Battery and sensor data being received on Golioth's LightDB Stream service

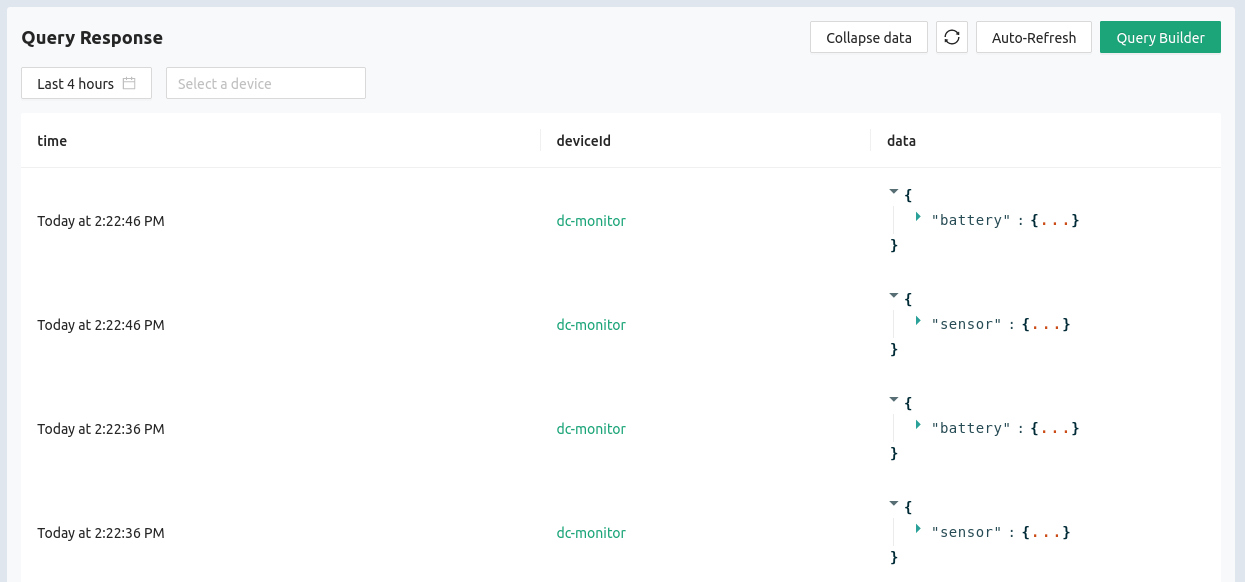
Let’s diagnose, and fix this issue using the Query Builder button in the upper right of the LightDB Stream page of the Golioth Console.

Using Query Builder to Filter Data

As it stands now, the query is asking for all data from all events by using the * wildcard operator:

Query Builder getting all endpoints

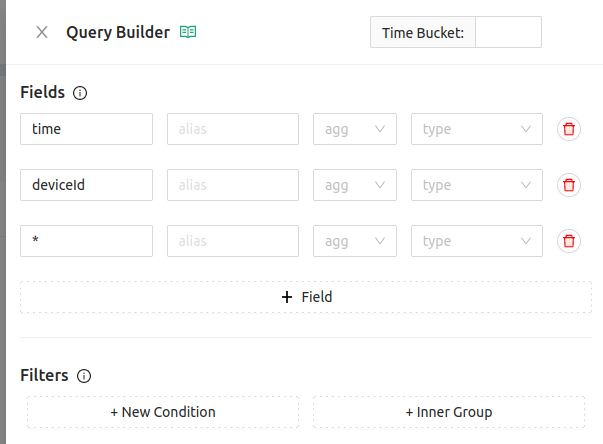
What we really want is just one endpoint that we can graph (along with the time and deviceId). So let’s change the query builder to target the current measurement on channel 0 of the incoming sensor data. I’ll also use an alias to make it easy to access the returned value.

Targeting the sensor.cur.ch0 endpoint

This is a good start. But if you look at the data, we still haven’t solved the problem:

Golioth LightDB endpoints sometimes null

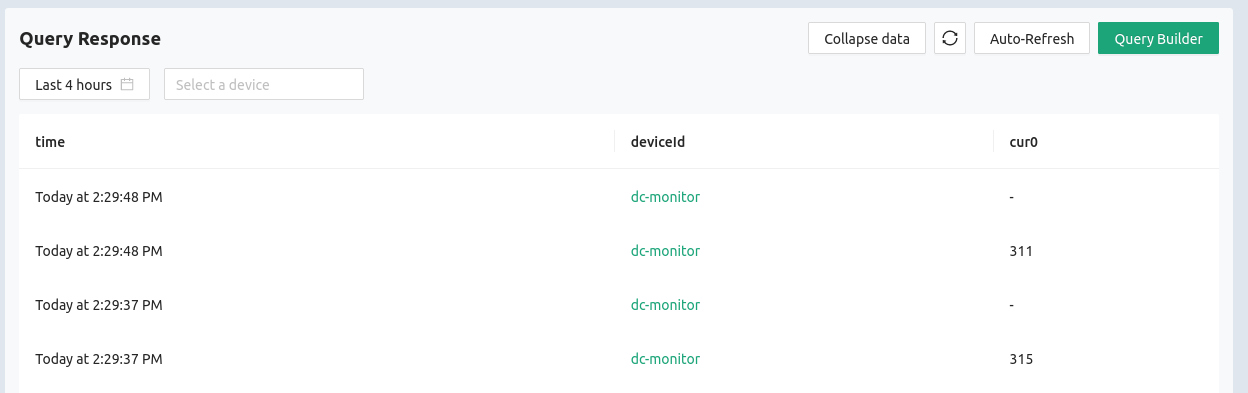
The dashes are the null values returned when trying to query our sensor data when it was a battery endpoint that was received. The final part of the puzzle is to add a filter that checks that our desired endpoint is not null.

Filtering out null values on an endpoint 
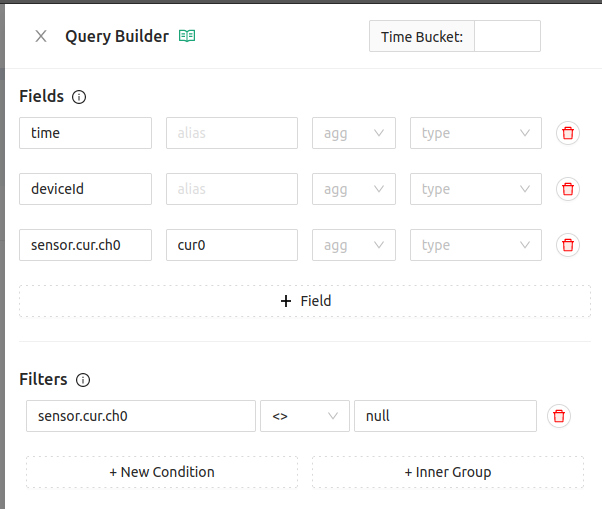
Now Golioth will only send data that includes the value we want to graph:

Correctly filtered sensor value

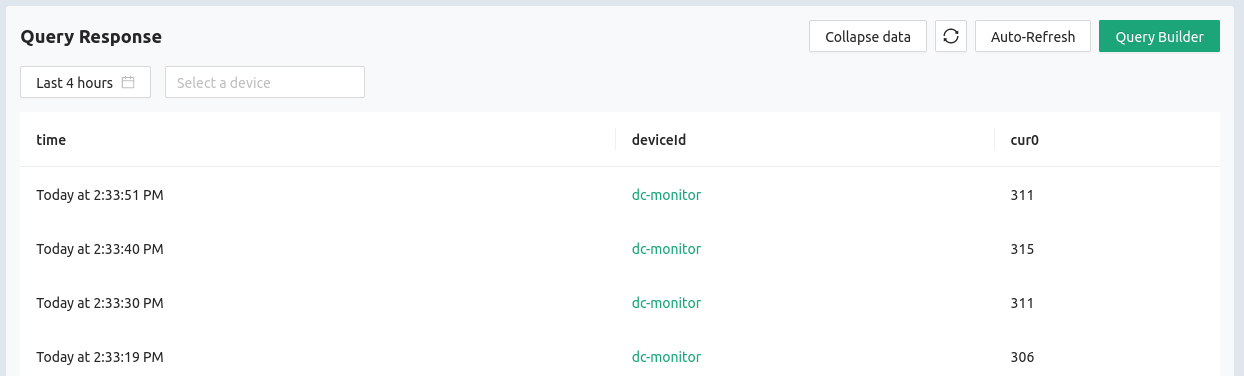
Now that we are receiving exactly the data we need, we can copy the query from the Query Builder by clicking the JSON button and then the Copy button.

Using the Query in Grafana

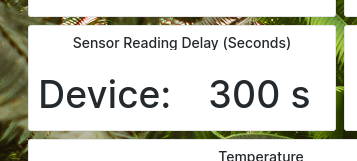
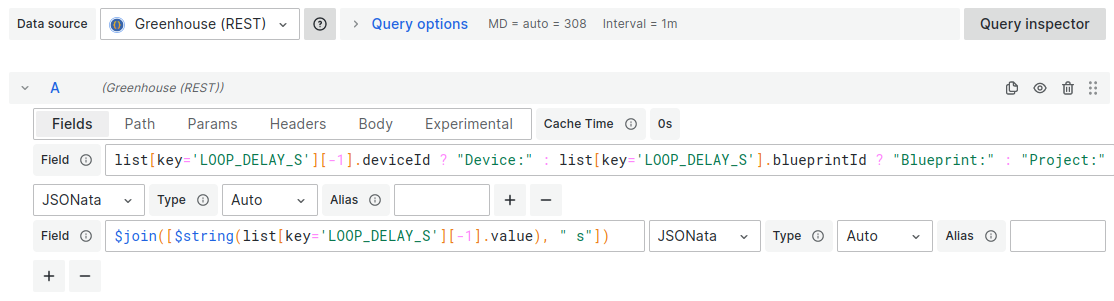
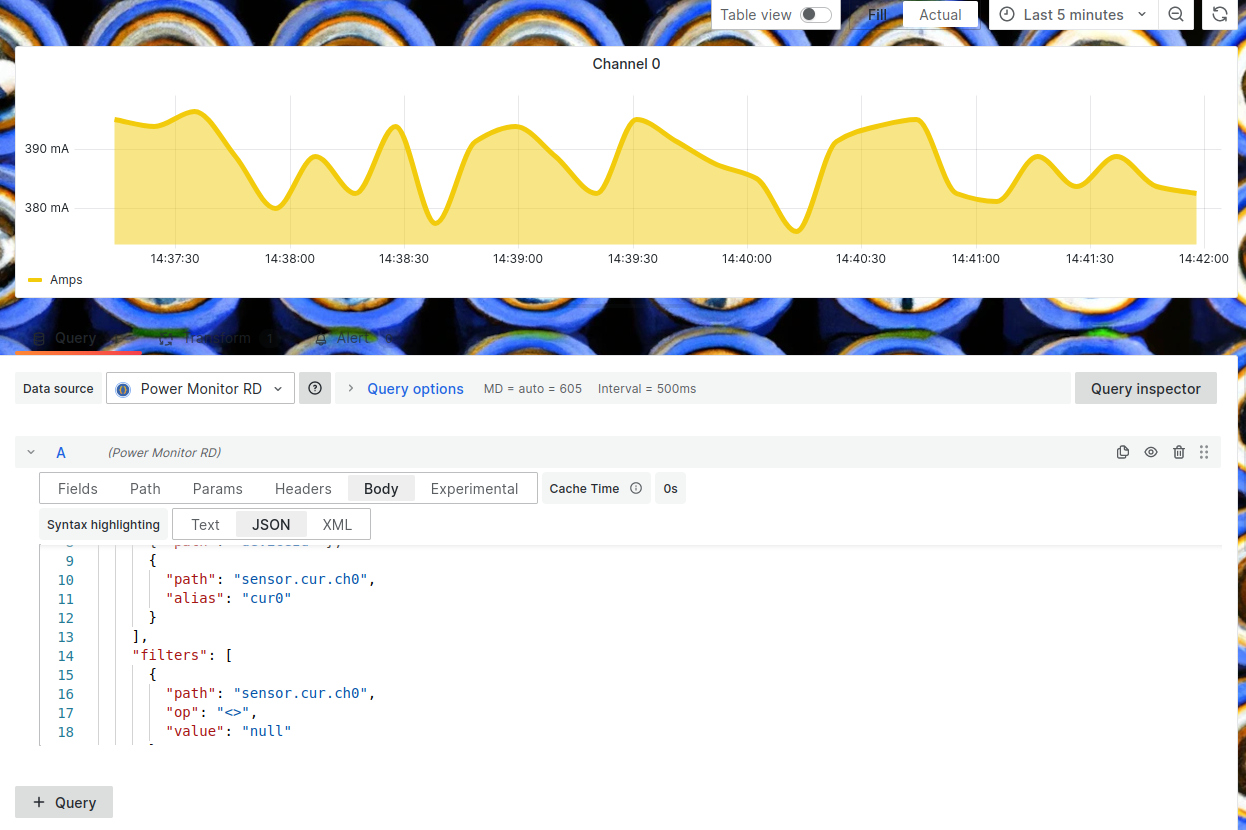
We previously set up a REST API data source for Golioth in our Grafana Dashboard. Use the Body tab to enter your query using the new values we created with the Query Builder.

Grafana JSON query

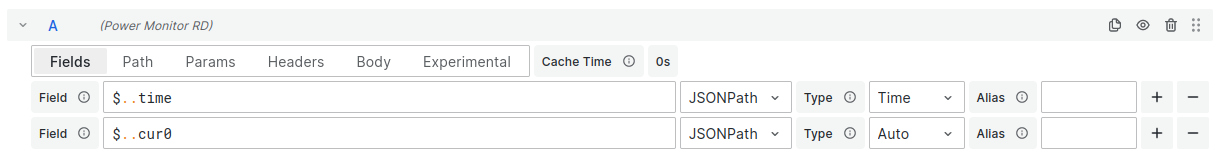
In the Fields tab we’re using the alias that we specified. You could use the full endpoint but as your panels become more intricate you’ll thank yourself for using aliases!

Fields for graphing values in Grafana

For completeness, we’ll leave you with the verbose body object from this Grafana panel. You can see the parts we crafted in the Query Builder make up the query field.

{
  "start": "${__from:date}",
  "end": "${__to:date}",
  "perPage": 99999,
  "query": {
    "fields": [
      {
        "path": "time"
      },
      {
        "path": "deviceId"
      },
      {
        "path": "sensor.cur.ch0",
        "alias": "cur0"
      }
    ],
    "filters": [
      {
        "path": "sensor.cur.ch0",
        "op": "<>",
        "value": "null"
      }
    ]
  }
}

Give Golioth a Try Today!

The proof of concept for your IoT fleet can be up and running in days, not weeks if you use Golioth as your instant IoT cloud. Combined with visualization tools like Grafana, you’ll have no problem getting to “yes” with your customers (or your boss). Your first 50 devices are free with our Dev Tier, so give Golioth a try today!

Learning how to use JSONata with Grafana delivers a huge boost to your ability to visualize data.

Golioth makes it easy to gather data from IoT sensors in the field and store them on the cloud. But of course once you have that data you probably want to graph it to show what’s going on. We like to use Grafana for this purpose. It makes beautiful interfaces and can grab Golioth data using our REST API.

Grafana fields to select JSONPath or JSONata

Grafana allows you to choose JSONPath or JSONata for each field that you use

Connecting the two is simple, but things can get hairy when trying to get Grafana to navigate the JSON structures that are returned. While JSONPath is the default setting for parsing Grafana queries, JSONata is also available and delivers some very interesting inline conditional options, and string concatenation. Let’s look at what it can do and how to use it.

Just JSONata for in-line logic

I was building a dashboard and wanted to display the current settings for a device. More specifically, I wanted to know what my “loop delay” was set to for a particular device.

I know how to call the REST API and query the settings I configured on my dashboard. However, Golioth settings can be set from the “project”, “blueprint”, or “device” level (see our introduction to the Settings Service for more information). If I filter for just one of these levels and the data isn’t present, it will cause the Grafana panel to throw an error. Our normal parsing tool (JSONPath) doesn’t provide the capabilities to differentiate between the returned data. Here’s what that data looks like:

{
  "list": [
    {
      "id": "6376a13a08be30b7e6d8669f",
      "key": "LOOP_DELAY_S",
      "value": 60,
      "dataType": "integer",
      "projectId": "636d7db608be30b7e6d865d3",
      "createdAt": "2022-11-17T21:01:46.176Z",
      "updatedAt": "2022-11-21T22:06:31.182Z"
    },
    {
      "id": "637bedbf8ad1a55c85e2894a",
      "key": "LIGHT_THRESH",
      "value": 1800,
      "dataType": "integer",
      "projectId": "636d7db608be30b7e6d865d3",
      "createdAt": "2022-11-21T21:29:35.321Z",
      "updatedAt": "2022-11-21T21:29:35.321Z"
    },
    {
      "id": "637bedcc8ad1a55c85e2894b",
      "key": "TEMP_THRESH",
      "value": 23.7,
      "dataType": "float",
      "projectId": "636d7db608be30b7e6d865d3",
      "createdAt": "2022-11-21T21:29:48.610Z",
      "updatedAt": "2022-11-21T21:29:48.610Z"
    },
    {
      "id": "637c27aa8ad1a55c85e28954",
      "key": "TEMP_THRESH",
      "value": 21.5,
      "dataType": "float",
      "projectId": "636d7db608be30b7e6d865d3",
      "deviceId": "636d7df208be30b7e6d865d6",
      "createdAt": "2022-11-22T01:36:42.195Z",
      "updatedAt": "2022-12-17T21:58:20.108Z"
    },
    {
      "id": "63978ef5e51fde6bbe11bfa6",
      "key": "LIGHT_THRESH",
      "value": 900,
      "dataType": "integer",
      "projectId": "636d7db608be30b7e6d865d3",
      "deviceId": "636d7df208be30b7e6d865d6",
      "createdAt": "2022-12-12T20:28:37.696Z",
      "updatedAt": "2022-12-12T20:28:37.696Z"
    }
  ],
  "total": 5
}

You have to look very closely at the data above to realize some entries have a deviceId field and others do not. If an entry has that key, we want to use the value to isolate just that piece of data. We also want to have a label that shows “Device” or “Project”. We can filter for this using JSONata:

list[key='LOOP_DELAY_S'][-1].deviceId ? "Device:" : list[key='LOOP_DELAY_S'].blueprintId ? "Blueprint:" : "Project:"

The code above has a few things going on:

  • First, filter all returned values for one key:
    • list[key='LOOP_DELAY_S']
  • Next, get the last value from that list:
    • [-1]
    • In our case we know the most specific settings value returned by Golioth will be the last value with that key
  • Now let’s do some inline conditional work:
    • Inline formatting works as follows: test ? use_this_if_true : use_this_if_false
    • Our example returns the string Device if it finds deviceId otherwise it tests for blueprintId and returns the string Blueprint, or finally defaults to return the string Project

The other thing we need is to write the value. But for human-readable values it’s best to return a unit as well. I used JSONata concatenation for this:

$join([$string(list[key='LOOP_DELAY_S'][-1].value), " s"])

This uses the same filtering and negative indexing tricks from above. But there are two new function calls, $string() converts the value to a string, and $join() concatenates the two strings together to add a space-S to the value.

Device settings panel in GrafanaThe panel looks great, and it’s all done with just two field settings in the Grafana:

JSONata panel settings

Just a peek at JSONata

This is just a small part of what JSONata has to offer. It has not replaced JSONpath as my go-to parsing language for Grafana, but I find it easier for filtering data, and it has inline conditionals and concatenation that I think are absent in JSONpath. Give it a spin the next time you’re stuck and see if it does the trick!