A new Pipelines data destination for Memfault is now generally available for Golioth users. It enables devices to leverage their existing secure connection to Golioth to deliver data containing coredumps, heartbeats, events, and more to Memfault. To see this integration in action, check out the example firmware application, read the documentation, and tune into this week’s Friday Afternoon Stream, where we will be joined by a special guest from Memfault.
Golioth + Memfault
We have long been impressed with the functionality offered by Memfault’s platform, as well as the embedded developer community they have cultivated with the Interrupt blog. In our mission to build a platform that makes connecting constrained devices to the cloud simple, secure, and efficient, we have continuously expanded the set of cloud services that devices can target. This goal has been furthered by the recent launch of Golioth Pipelines.
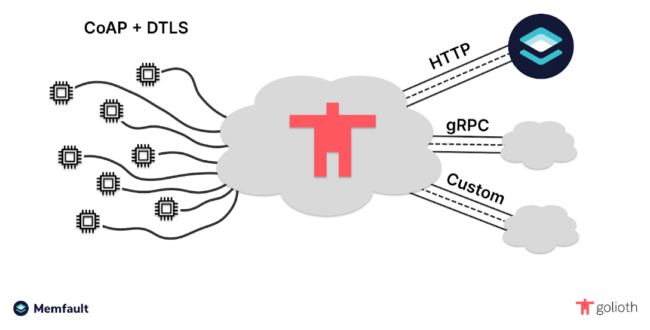
Memfault’s observability features are highly desired by embedded developers, but leveraging them has typically required establishing a separate HTTP connection from a device to Memfault’s cloud, building custom functionality to relay data from an existing device service to Memfault, or utilizing an intermediate gateway device to provide connectivity. With Golioth, devices already have a secure connection to the cloud for table-stakes device management services and flexible data routing. By adding a Memfault data destination to Golioth Pipelines, that same connection can be used to route a subset of streaming data to Memfault. Leveraging this existing connection saves power and bandwidth on the device, and removes the need to store fleet-wide secrets on deployed devices.
How It Works
The Memfault Firmware SDK provides observability data to an application serialized in the form of chunks. An application can periodically query the packetizer to see if there are new chunks available.
bool data_available = memfault_packetizer_begin(&cfg, &metadata);
When data is available, it can be obtained from thepacketizer by either obtaining a single chunk via memfault_packetizer_get_chunk, or by setting enable_multi_packet_chunk to true in configuration and repeatedly invoking memfault_packetizer_get_next until a kMemfaultPacketizerStatus_EndOfChunk status is returned. The latter strategy allows for obtaining all data in a single chunk that would exceed the default size limitations. Golioth leverages this functionality to upload both large and small chunks using CoAP blockwise transfers, a feature that was enabled in our recent v0.14.0 Golioth Firmware SDK release.
golioth_stream_set_blockwise_sync(client,
                                  "mflt",
                                  GOLIOTH_CONTENT_TYPE_OCTET_STREAM,
                                  read_memfault_chunk,
                                  NULL);
The read_memfault_chunk callback will be called repeatedly to populate blocks for upload until the entire chunk has been obtained from the packetizer.
static enum golioth_status read_memfault_chunk(uint32_t block_idx,
                                               uint8_t *block_buffer,
                                               size_t *block_size,
                                               bool *is_last,
                                               void *arg)
{
    eMemfaultPacketizerStatus mflt_status;
    mflt_status = memfault_packetizer_get_next(block_buffer, block_size);
    if (kMemfaultPacketizerStatus_NoMoreData == mflt_status)
    {
        LOG_WRN("Unexpected end of Memfault data");
        *block_size = 0;
        *is_last = true;
    }
    else if (kMemfaultPacketizerStatus_EndOfChunk == mflt_status)
    {
        /* Last block */
        *is_last = true;
    }
    else if (kMemfaultPacketizerStatus_MoreDataForChunk == mflt_status)
    {
        *is_last = false;
    }

    return GOLIOTH_OK;
}
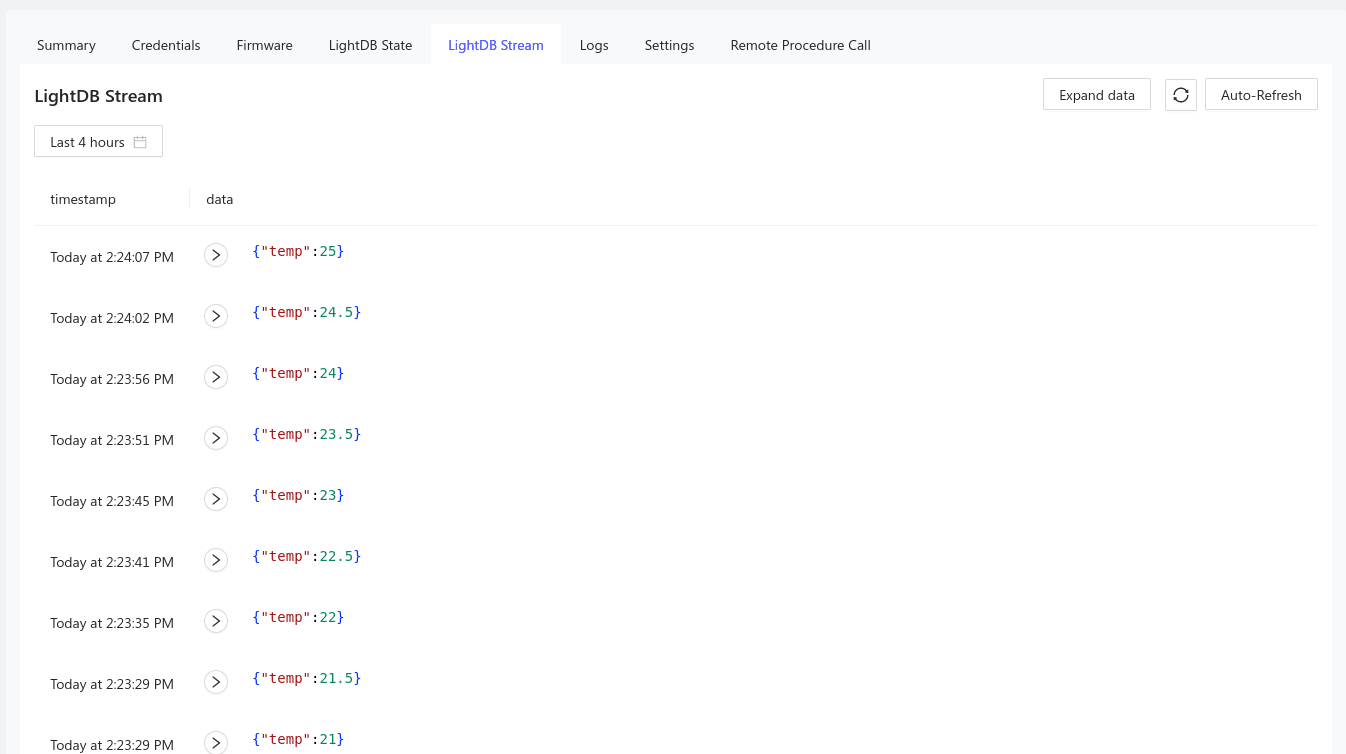
Golioth views the data as any other stream data, which can be delivered to a path of the user’s choosing. In this case, the data is being streamed to the /mflt path, which can be used as a filter in a pipeline.
filter:
  path: "/mflt"
  content_type: application/octet-stream
steps:
  - name: step0
    destination:
      type: memfault
      version: v1
      parameters:
        project_key: $MEMFAULT_PROJECT_KEY
Click here to use this pipeline in your Golioth project!
Because the Memfault Firmware SDK is producing this data, it does not need to be transformed prior to delivery to Memfault’s cloud. Creating the pipeline shown above, as well as a secret with name MEMFAULT_PROJECT_KEY that contains a project key for the desired Memfault project, will result in all streaming data on the /mflt path to be delivered to the Memfault platform.
Livestream demo with Memfault
Dan from Golioth did a livestream with Noah from Memfault showcasing how this interaction works, check it out below:
What’s Next
We will be continuing to roll out more Pipelines data destinations and transformers in the coming weeks. If you have a use-case in mind, feel free to reach out to us on the forum!