Golioth and Ubidots have teamed up to make it easy to visualize your Internet of Things device data. Ubidots makes it easy to white-label visualizations to produce a branded version of your service for end customers; you can also create end-users, in order to allow access to custom dashboards.
Our partnership has produced an integration that makes it a snap to connect your device data to an Ubidots dashboard so that it looks great for you and for your clients. Today I’ll walk you through the process of setting up a connection.

What you need to get started
To get started you just need a few basic things:
- An account on Golioth (sign up)
- An account on Ubidots (sign up)
- A device that is sending data to Golioth
Creating your accounts is pretty easy; Golioth has a free dev tier, and Ubidots has a free Educational/Personal use option or a free trial period for their Business users. Everyone who has followed our Getting Started guide will already has a Golioth account.
If you don’t already have a device set up to send data, you can use the Golioth LightDB Stream example. It will simulate temperature data and send it back to the Golioth Cloud, a perfect dataset for your first Ubidots dashboard!
Setting up a connection between Golioth and Ubidots
To connect Golioth and Ubidots we need to take the follow steps:
- Configure an Ubidots plugin
- Configure a Golioth output stream
- Set up an Ubidots dashboard
1. Configure the plugin in Ubidots
Ubidots has a plugin specifically for Golioth. But before configuring the plugin we want to make sure we have a token to use for this project. From the Ubidots dashboard, click your profile picture in the upper right, choose API Credentials and click More under the tokens menu that appears. This will open the API Credentials page.
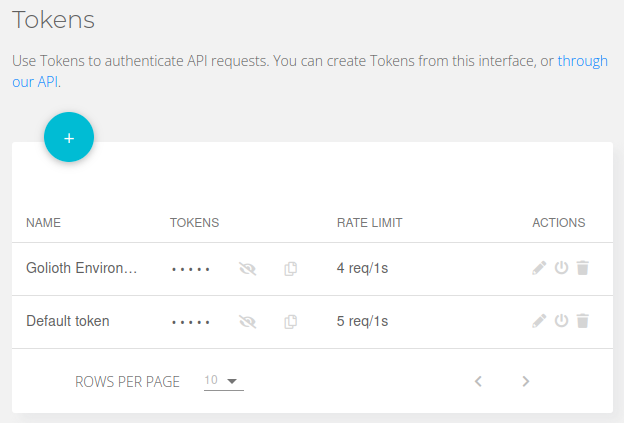
Use the plus sign to add a new token, then use the pencil icon to edit the name of the token.
Next, choose Devices→Plugins from the top menu. Click the plus to add a plugin, and choose Golioth. Click the arrow icon to get to the plugin configuration menu.
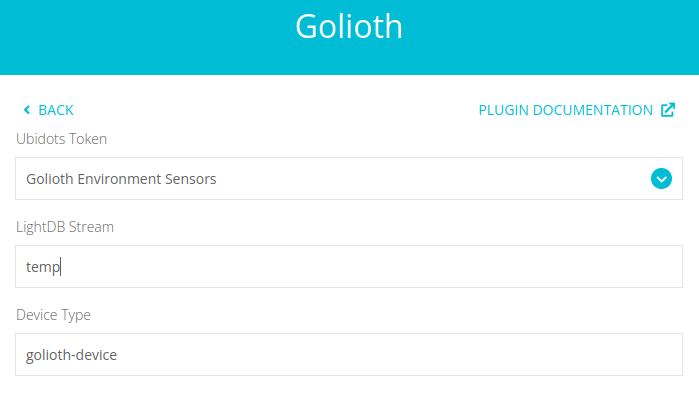 Choose the token you just created from the dropdown menu. In the
 LightDB Stream field, use the name of the endpoint where your device is sending data.
If you have a nested JSON, like {"env":{"temp":20.5}}, then you would set this value to “env” and the Ubidots plugin would pick up all of the key/value pairs inside of that JSON object.
If you are following along with the Golioth Stream sample, leave the LightDB Stream field blank, since we publish to the root-level directly. You can see in the code example below, we are setting the temperature value to the root-level “temp” key.
[sourcecode lang=”cpp”]
err = golioth_lightdb_set(client,
GOLIOTH_LIGHTDB_STREAM_PATH("temp"),
COAP_CONTENT_FORMAT_TEXT_PLAIN,
str_temperature,
strlen(str_temperature));
[/sourcecode]
Click the right arrow, give your plugin a name and description, and click the check mark icon to save. You will be redirected to a list of your plugins.
[screenshot]
Click on the one you just created and then select Decoder from the left sidebar.
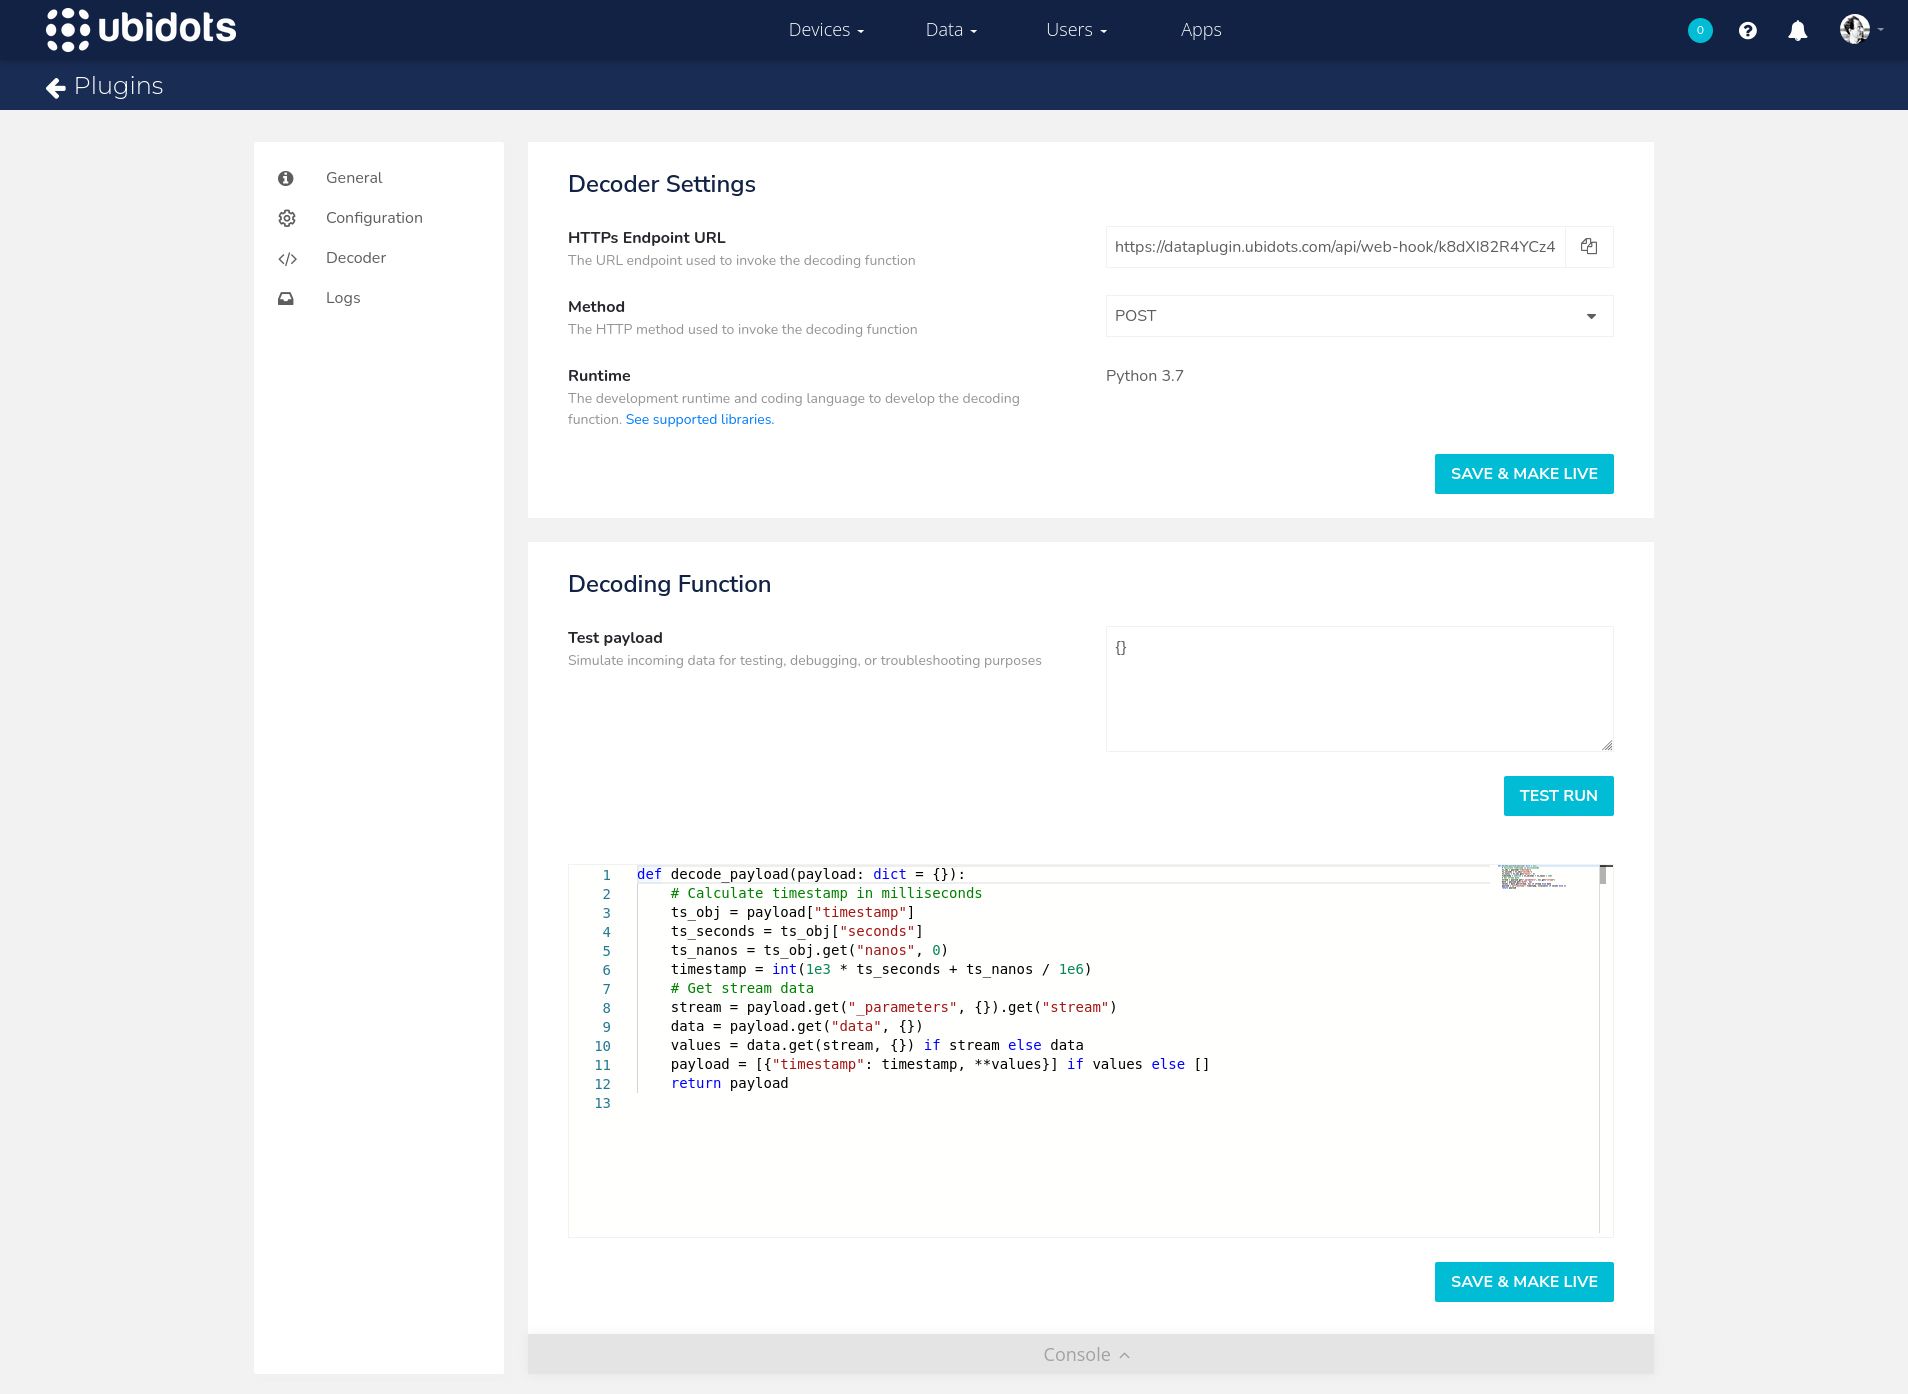
Generally speaking, this page is already configured to work. We need to copy the Ubidots HTTPs Endpoint URL and use it to create a Golioth Output Stream in the next step.
DeviceStreamMessage in our Event Types documentation. For today’s example, the defaults will work.2. Configure a Golioth output stream
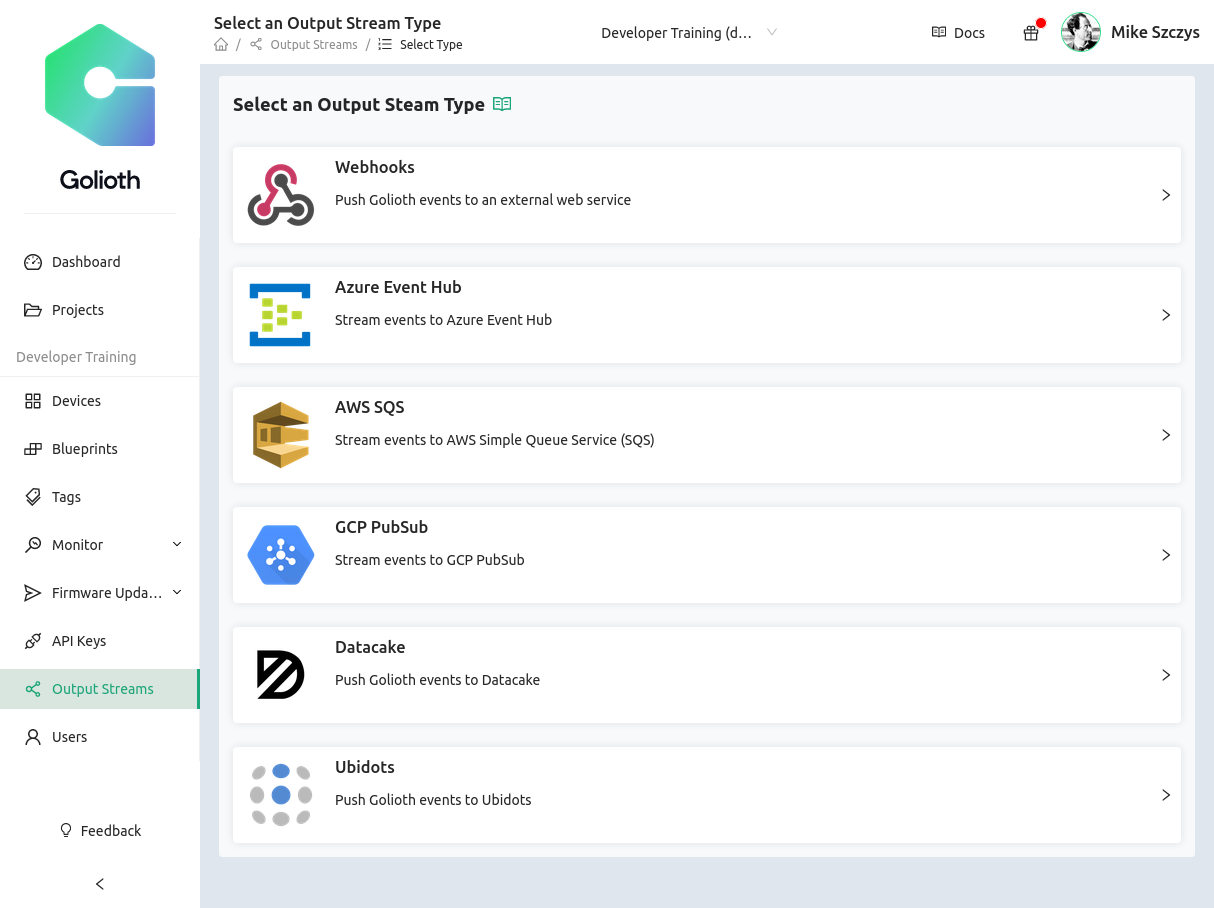
In the Golioth Console, select Output Streams from the left sidebar, click on Create an Output Stream, and choose Ubidots from the list.
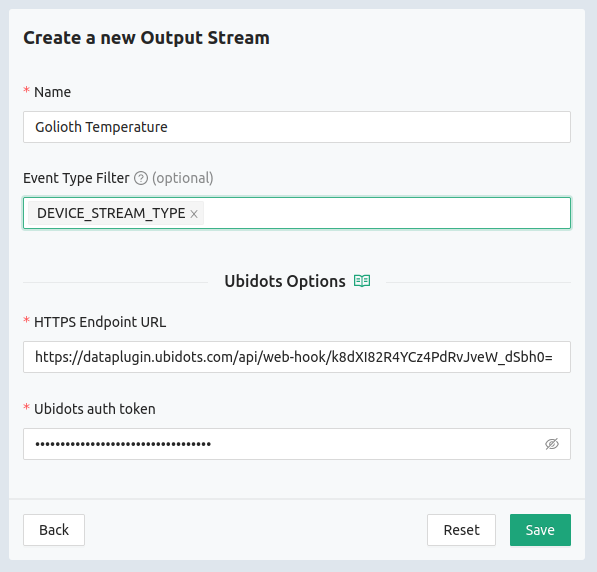
Give your new Output Stream a name, and choose DEVICE_STREAM_TYPE as the event filter. The HTTPS Endpoint URL comes from the Ubidots dashboard. So does the auth token, which you can copy from the Ubidots dashboard by clicking your avatar in the upper right and choosing API Credentials(this reveals a panel that lets you copy tokens to the clipboard). Click save to finish setting up your Output Stream.
3. Set up an Ubidots dashboard
We’re ready to start visualizing! At the top of the Ubidots dashboard, select Data→Dashboards. You can create a new dashboard using the ☰ icon (sometimes called a “hamburger menu”) in the upper left.
On your new dashboard, click Add new Widget and choose a Gauge from the list.
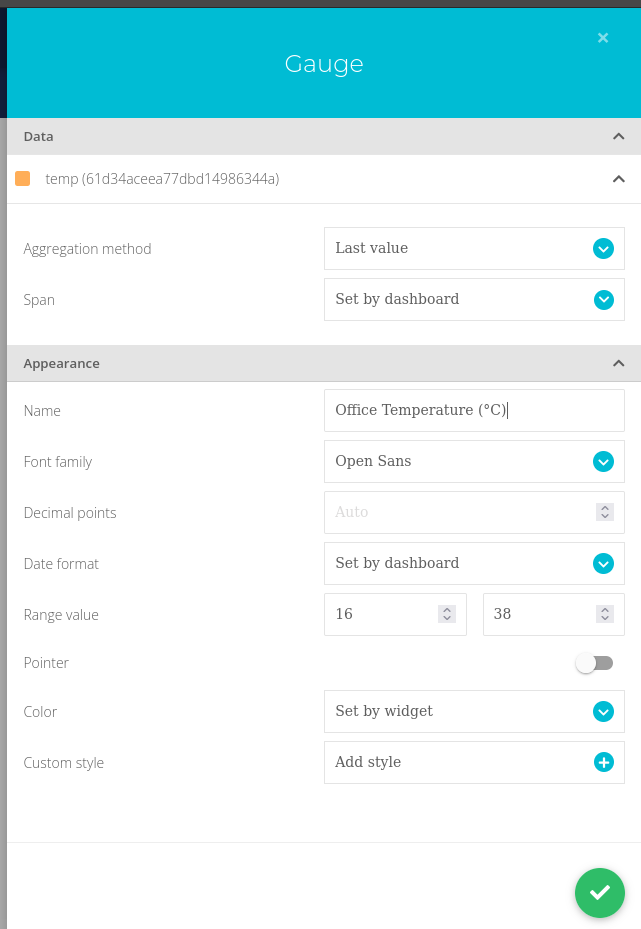
In the data section, click Add Variable, choose your device, and select the data you want to show. If your device is not listed, the endpoint may be configured wrong, or the device has not yet sent any data. There is a Logs section in the Ubidots plugins settings page that will be helpful in troubleshooting the issue.
The rest of the settings in this dialog decide how your data will be displayed. Set the name of the widget, and choose the range that suits you best before clicking the check mark icon to save the changes.
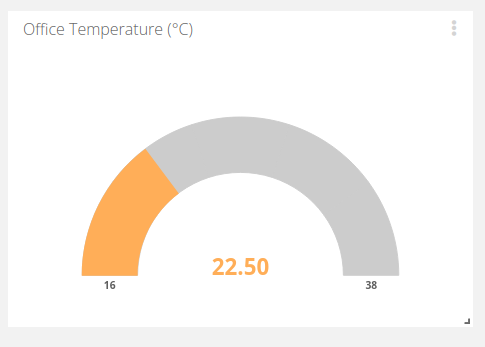
Now you have a gauge that shows temperature readings from your device. Of course there are many other visualization methods available to match your needs, so spend some time playing around with your new Ubidots dashboard!

No comments yet! Start the discussion at forum.golioth.io