In a best case scenario, once an IoT fleet is deployed, you never need to (physically) touch them again. Golioth helps give you tools to work with your devices remotely and make this a reality. Today, we’ll look at dynamically modifying the number of logs being sent back to the Cloud. This allows fleet managers to peek into individual devices without needing to waste data and battery power by always sending every log message back to Golioth.
Logging to the cloud is already built into Golioth, so it’s really just a matter of tuning how many logs are being sent by your devices. Golioth hooks into the Zephyr RTOS Logging service, which we’ll be showcasing here today.
Background on Remote Logging with Zephyr
The Golioth Zephyr SDK has remote logging built it, and in our sample applications (like the hello sample) it is enabled by default in the prj.conf files:
CONFIG_LOG_BACKEND_GOLIOTH=y
CONFIG_LOG_PROCESS_THREAD_STACK_SIZE=2048
At the top of each C file you need to register for logging. This is also a good place to set the default logging level, which I’ll refer to as the “compiled-in” logging level.
#include <zephyr/logging/log.h>
LOG_MODULE_REGISTER(remote_logging_example, LOG_LEVEL_DBG);
This compiled-in level is an important decision because the preprocessor will not include logging calls if they have a higher value than this parameter. For instance, if you set the default to LOG_LEVEL_ERR, you cannot remotely turn on debugging messages because LOG_LEVEL_DBG is a higher logging level. Here is the hierarchy of logging levels in Zephyr:
#define LOG_LEVEL_NONE 0U
#define LOG_LEVEL_ERR  1U
#define LOG_LEVEL_WRN  2U
#define LOG_LEVEL_INF  3U
#define LOG_LEVEL_DBG  4U
In our case, the solution is to use LOG_LEVEL_DBG when compiling, and programmatically set the value to a lower level at run time. This will make your binary a bit larger, since the strings for every logging message will be included, but it delivers the option to turn on debugging messages after deployment which in most cases is worth the extra bytes of flash.
Write a Function to Set Log Levels at Run Time
Now we need a function that, when called, will automatically adjust the logging level for every logging source on the device.
#include <zephyr/logging/log_ctrl.h>

void change_logging_level(int log_level) {
    int source_id = 0;
    char *source_name;
    while(1) {
        source_name = (char *)log_source_name_get(0, source_id);
        if (source_name == NULL) {
            break;
        } else {
            LOG_WRN("Settings %s log level to: %d", source_name, log_level);
            log_filter_set(NULL, 0, source_id, log_level);
            ++source_id;
        }
    }
}
This function uses Zephyr’s logging control to query the name of each logging source that is available on the system. It then uses that source name to set the new logging level.
If you are putting cellular devices into the field, you probably don’t want to have logging turned on very high (or at all) by default since you’ll be paying for bandwidth. The first thing you can do at run time is call this function:
change_logging_level(LOG_LEVEL_ERR);
Now, only error messages will be logged to the Golioth cloud.
Setting Log Level Remotely
There are two obvious ways you can go about setting log levels remotely: the Golioth Remote Procedure Call (RPC) service, and the Golioth Settings service. Since the most likely use for this is turning on logs for a single device (and not fleetwide all at the same time), using a remote procedure call makes the most sense to me.
// Remote procedure call (RPC) callback for setting the logging levels
static enum golioth_rpc_status on_set_log_level(QCBORDecodeContext *request_params_array,
                       QCBOREncodeContext *response_detail_map,
                       void *callback_arg)
{
    double a;
    uint32_t log_level;
    QCBORError qerr;

    QCBORDecode_GetDouble(request_params_array, &a);
    qerr = QCBORDecode_GetError(request_params_array);
    if (qerr != QCBOR_SUCCESS) {
        LOG_ERR("Failed to decode array item: %d (%s)", qerr, qcbor_err_to_str(qerr));
        return GOLIOTH_RPC_INVALID_ARGUMENT;
    }

    log_level = (uint32_t)a;

    if ((log_level < 0) || (log_level > LOG_LEVEL_DBG)) {

        LOG_ERR("Requested log level is out of bounds: %d", log_level);
        return GOLIOTH_RPC_INVALID_ARGUMENT;
    }

    change_logging_level(log_level);
    return GOLIOTH_RPC_OK;
}

// Register RPC to listen for "set_log_levels"
// This should be called from your "on_connect()" callback
golioth_rpc_register(rpc_client, "set_log_level", on_set_log_level, NULL);
There are two parts to the function above. The first is a callback that will run when a remote procedure call (RPC) instruction is received from the Golioth servers. It will get incoming log level as a parameter, validate it, then run the function we discussed in the previous section to change the log levels.
The second part of the code is the act of registering the RPC. This tells the Golioth servers that this device wants to be notified whenever a callback with the name "set_log_level" is issued from the Golioth web console, or via the Golioth REST API.
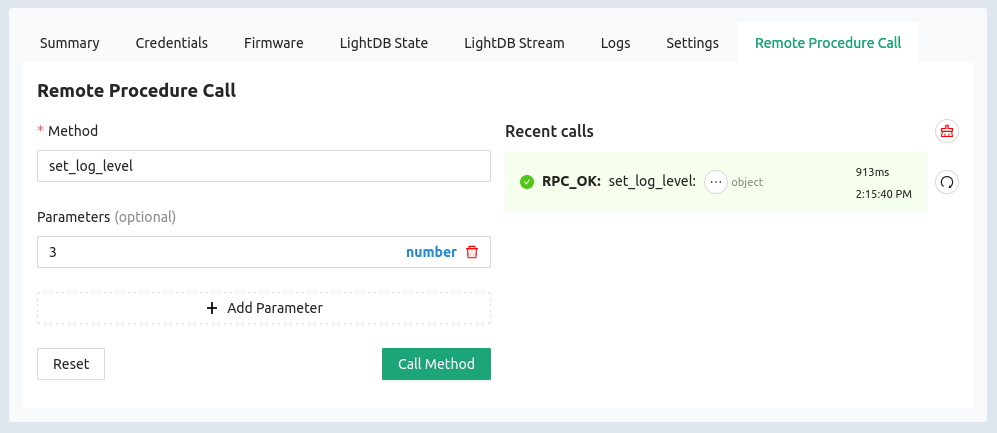
Here’s an example of using the web console interface to submit this RPC. I sent a request to change to log level 3 (LOG_LEVEL_INF), and upon success/failure we get a notification message back. This RPC was successful, and took 913 milliseconds for the device to receive the message, execute it, and report the results.
[00:00:37.736,663] <inf> app_work: Sending hello! 2
[00:01:07.738,800] <inf> app_work: Sending hello! 3
[00:01:36.947,418] <wrn> app_rpc: Settings golioth_dfu log level to: 3
--- 12 messages dropped ---
[00:01:36.947,448] <wrn> app_rpc: Settings golioth_rd_template log level to: 3
[00:01:36.947,479] <wrn> app_rpc: Settings golioth_samples log level to: 3
[00:01:36.947,479] <wrn> app_rpc: Settings golioth_system log level to: 3
[00:01:36.947,509] <wrn> app_rpc: Settings lightdb log level to: 3
[00:01:36.947,540] <wrn> app_rpc: Settings log log level to: 3
[00:01:36.947,570] <wrn> app_rpc: Settings lte_lc log level to: 3
[00:01:36.947,601] <wrn> app_rpc: Settings lte_lc_helpers log level to: 3
[00:01:36.947,631] <wrn> app_rpc: Settings mcuboot_util log level to: 3
[00:01:36.947,662] <wrn> app_rpc: Settings modem_antenna log level to: 3
[00:01:36.947,692] <wrn> app_rpc: Settings mpu log level to: 3
[00:01:36.947,723] <wrn> app_rpc: Settings net_buf log level to: 3
[00:01:36.947,753] <wrn> app_rpc: Settings net_coap log level to: 3
[00:01:36.947,753] <wrn> app_rpc: Settings net_core log level to: 3
[00:01:36.947,784] <wrn> app_rpc: Settings net_if log level to: 3
[00:01:36.947,814] <wrn> app_rpc: Settings net_shell log level to: 3
[00:01:36.947,845] <wrn> app_rpc: Settings net_sock log level to: 3
[00:01:36.947,875] <wrn> app_rpc: Settings net_sock_addr log level to: 3
[00:01:36.947,906] <wrn> app_rpc: Settings net_sock_tls log level to: 3
[00:01:36.947,937] <wrn> app_rpc: Settings net_sock_wrapper log level to: 3
[00:01:36.947,967] <wrn> app_rpc: Settings net_socket_offload log level to: 3
[00:01:36.947,998] <wrn> app_rpc: Settings net_utils log level to: 3
[00:01:36.948,028] <wrn> app_rpc: Settings nrf_modem log level to: 3
[00:01:36.948,059] <wrn> app_rpc: Settings os log level to: 3
[00:01:36.948,089] <wrn> app_rpc: Settings pm log level to: 3
[00:01:36.948,120] <wrn> app_rpc: Settings settings log level to: 3
[00:01:36.948,150] <wrn> app_rpc: Settings shell.shell_uart log level to: 3
[00:01:36.948,181] <wrn> app_rpc: Settings shell_uart log level to: 3
[00:01:36.948,211] <wrn> app_rpc: Settings soc log level to: 3
[00:01:36.948,242] <wrn> app_rpc: Settings stream log level to: 3
[00:01:36.948,272] <wrn> app_rpc: Settings uart_nrfx_uarte log level to: 3
[00:01:37.741,027] <inf> app_work: Sending hello! 4
[00:02:07.743,041] <inf> app_work: Sending hello! 5
uart:~$
On the device side, we can see the output of our RPC on a serial terminal (above). There are a lot of logging sources running on this device and they have all been individually set to level 3.
Remember, if the compiled-in level for any given source has been set lower (to only show errors, or to show no logging), setting a higher number at run time will not return additional messages because higher-level messages were not included in the build.
There and Back Again
What does it take to troubleshoot an IoT device in the field? If designed correctly, it will not take a physical visit to the device, but merely a few remote communications. Ideally, you will turn on debugging, analyze the issues you’re having, and then send a command to adjust accordingly.
But even if you haven’t planned very far ahead, with Golioth you can still enable these features. We recommend that every device you put in the field have Golioth Over-the-Air (OTA) firmware updates enabled. That way, you can send these remote-logging features to your devices, even if they are already in the field.
Do you have questions or suggestions on adjusting logging levels remotely? We’d love to hear from you on the Golioth Forum!

No comments yet! Start the discussion at forum.golioth.io