Even people who have been living under a rock for the past couple of years know that there’s a global chip shortage. The correct response from the engineering community should be changes to our design philosophy and that’s the topic of the talk that Chris Gammell and I gave at the 2022 Zephyr Developer Summit back in June. With the right hardware and firmware approach, it’s possible to design truly modular hardware to respond to supply chain woes.

Standardization enabled the industrial revolution, and the electronics field is a direct descendant of those principles. You can rest easy in knowing that myriad parts exist to match your chosen operating voltage and communication scheme. But generally speaking it’s still quite painful to change microcontrollers and other key-components mid-way through product design.

Today’s hardware landscape has uprooted the old ways of doing things. You can’t wait out a 52-week lead time, so plan for the worst and hope for the best. Our talk covers the design philosophies we’ve adopted to make hardware “swapability” possible, while using Zephyr RTOS to manage the firmware side of things.

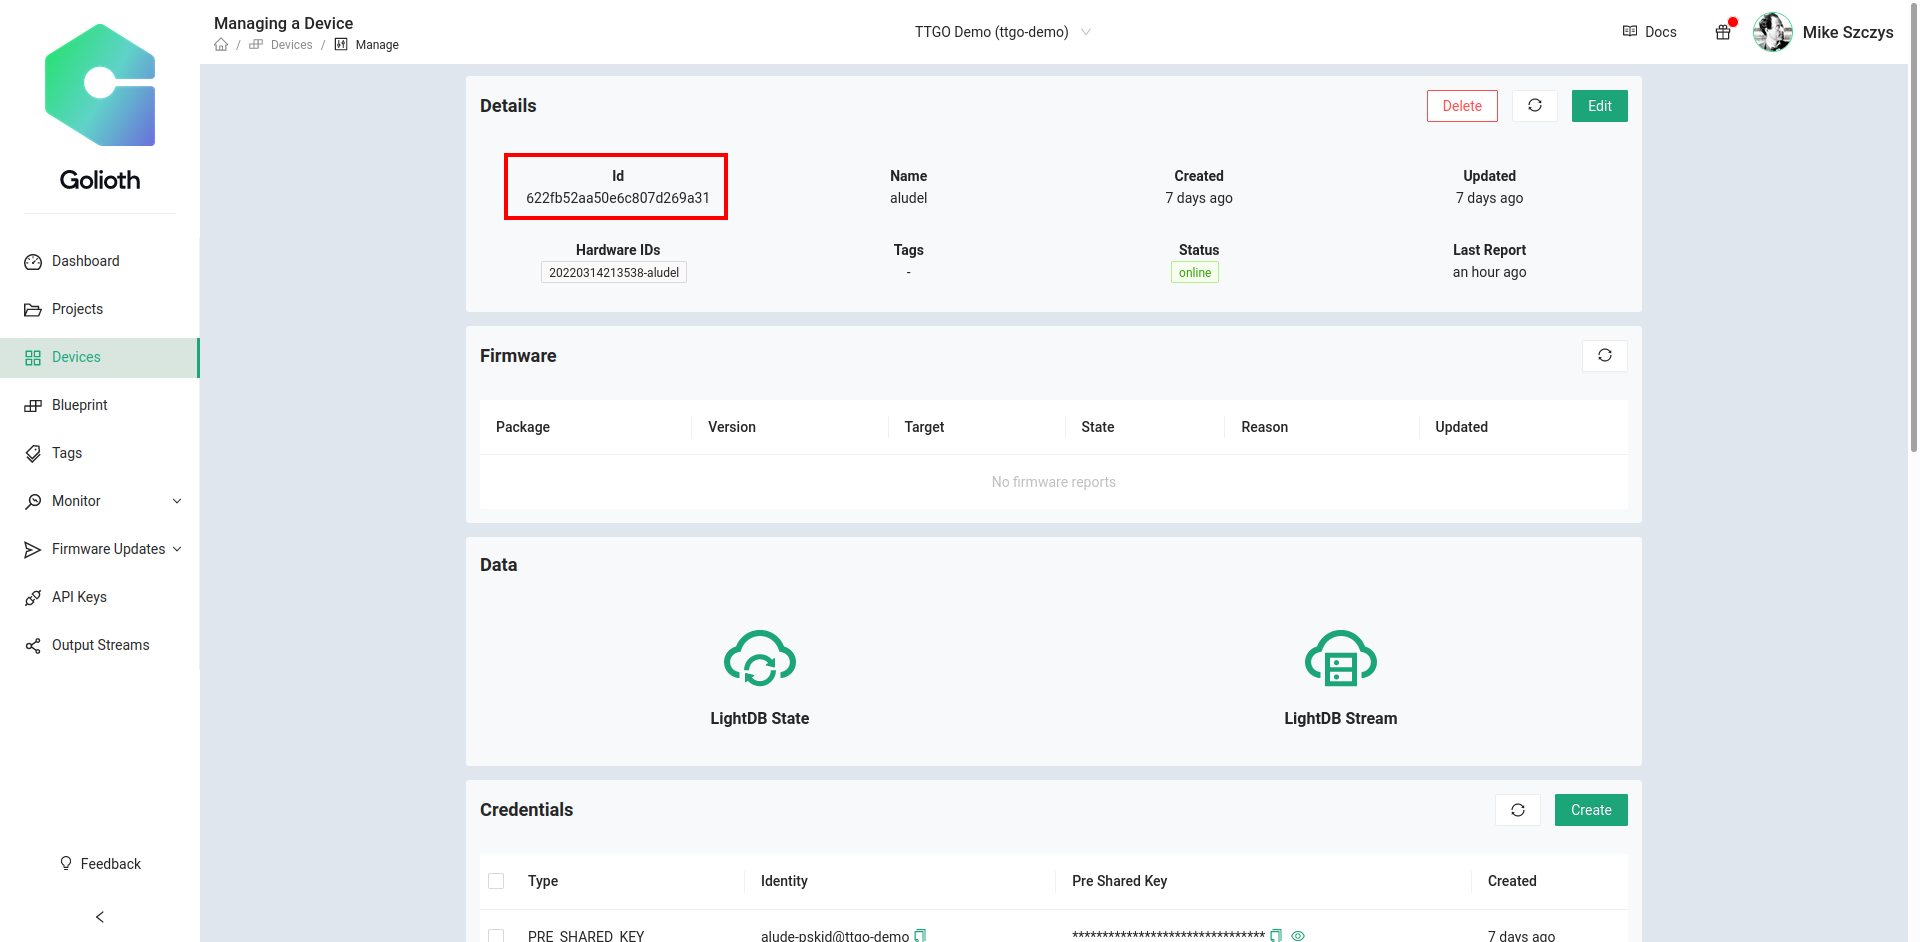
Meet the Golioth Aludel

Golioth exists to make IoT development straightforward and scalable–that’s not possible if you’re locked into specific hardware, especially these days. So we designed and built a modular platform to showcase this flexibility to our customers.

Golioth Aludel prototyping platform internal view

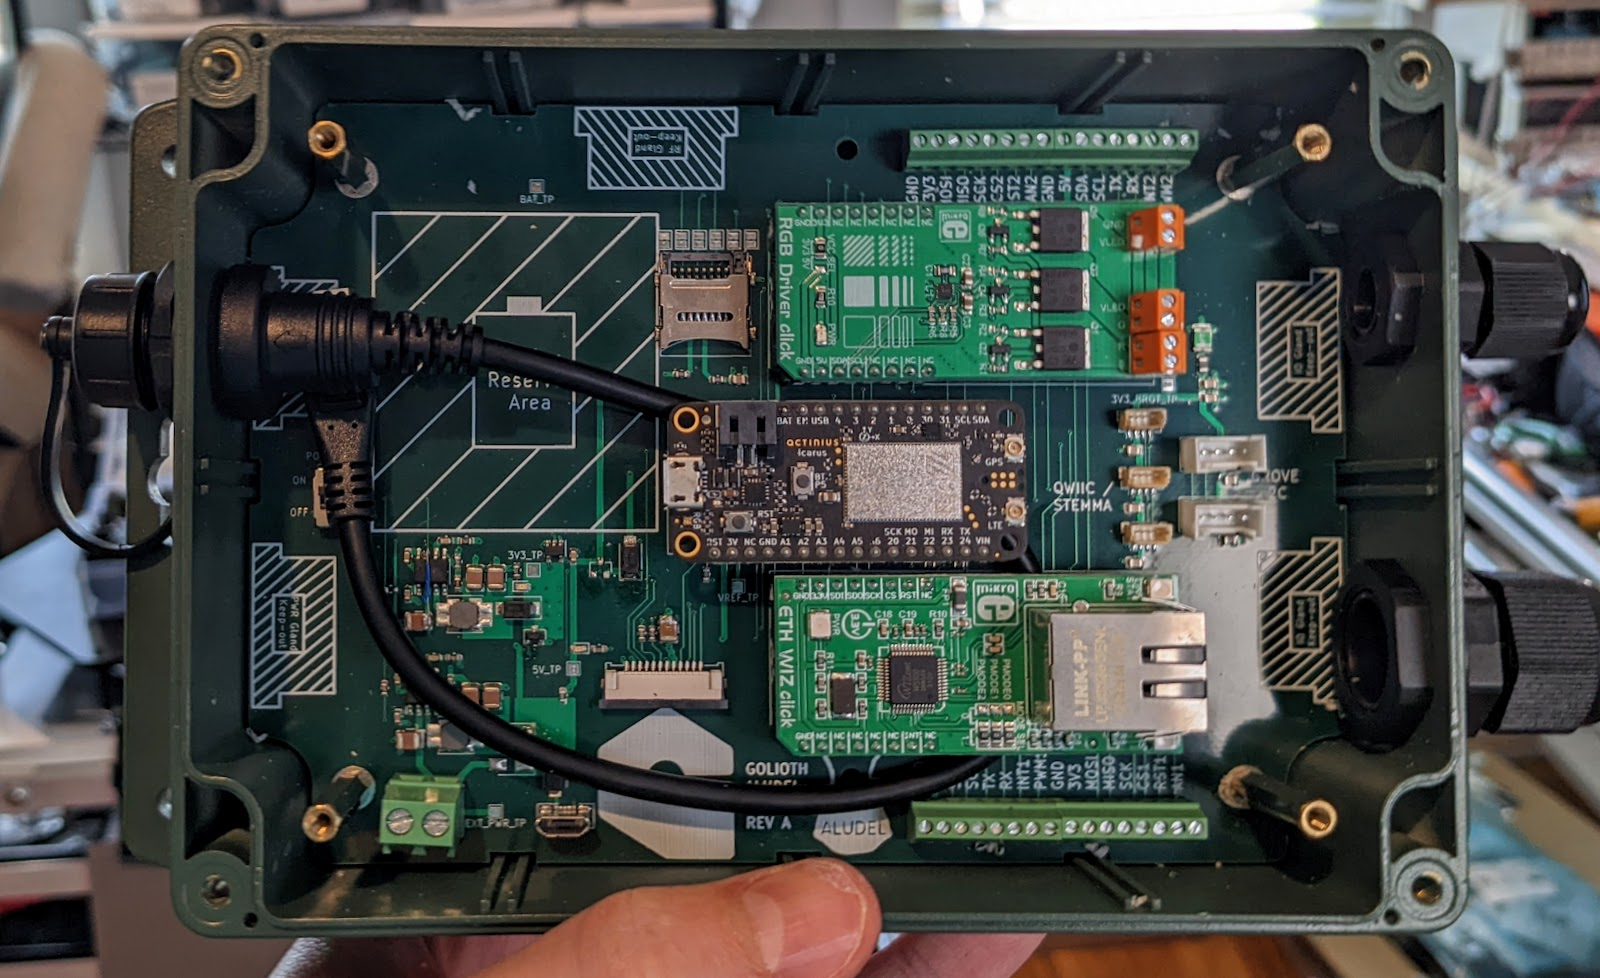
Called Aludel, Chris Gammell centered the design around a readily available industrial enclosure. The core concept is a PCB base that accepts any microcontroller board that uses the Feather standard. This way, every pin-location and function is standardized. Alongside the Feather you’ll find two headers that use the Click boards standard (PDF), a footprint for expansions boards facilitating i2c, SPI, UART, and more. The base includes Qwiic and Stemma headers for additional sensor connectivity, as well as terminal blocks, room for a battery, and provisions for external power.

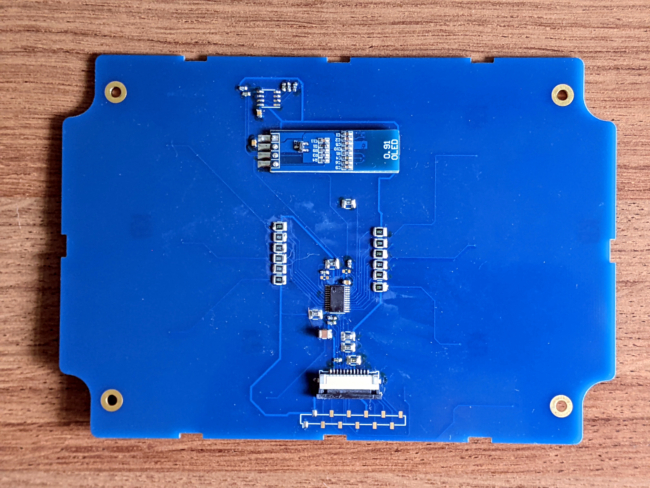
The key customization element for Aludel is the faceplate. It’s a circuit board that can deliver a beautiful custom design to match any customer request. But on the inside, each faceplate has the same interface using a flat cable connection to the base board. Current versions of the faceplate feature a a screen, an EEPROM to identify the board, and a port expander that drives buttons, LEDs, and whatever else you need for the hardware UI.

The beauty of this is that electrically, it all just works. Need an nRF52, nRF9160, ESP32, STM32, or RP2040? They all already exist in Feather form factor. Need to change the type of temperature sensor you’re using? Want to add RS485, CANbus, MODBUS, 4-20 ma communication, or some other connectivity protocol? The hardware is ready for it–at most you might need to spin your own adapter board.

Now skeptics may look at the size of this with one abnormally high-arched eyebrow. But remember, this is a proof-of-concept platform. You can set it up for your prototyping, then take the block elements and boil them down into your final design. Prematurely optimizing for space means you will have many many more board runs as the parts change.

When you do a production run and your chip is no longer available, the same concepts will quickly allow you to test replacements and respin your production PCB to accommodate the changes.

Zephyr Alleviates your Firmware Headaches

“But wait!” you cry, “won’t someone think of the firmware?”. Indeed, someone has thought of the firmware. The Linux Foundation shepherds an amazing Real-Time Operating System called Zephyr RTOS that focuses on interoperability across a vast array of processor architectures and families. Even better, it handles the networking stack and has a standardized device model that makes it possible to switch peripherals (ie: sensors) without your C code even noticing.

We use Zephyr to maintain one firmware repository for the Aludel hardware that can be compiled for STM32F40, nRF52840, nRF9160, and ESP32 using your choice of Ethernet, WiFi, or Cellular connections. How is that even possible?

&i2c0 {
	bme280@76 {
		compatible = "bosch,bme280";
		reg = <0x76>;
		label = "BME280_I2C";
	};
};

&spi1 {
	compatible = "nordic,nrf-spi";
	status = "okay";
	cs-gpios = <&gpio0 3 GPIO_ACTIVE_LOW>,
	           <&gpio0 27 GPIO_ACTIVE_LOW>,
	           <&gpio1 8 GPIO_ACTIVE_LOW>;
	test_spi_w5500: w5500@0 {
		compatible = "wiznet,w5500";
		label = "w5500";
		reg = <0x0>;
		spi-max-frequency = <10000000>;
		int-gpios = <&gpio0 2 GPIO_ACTIVE_LOW>;
		reset-gpios = <&gpio0 30 GPIO_ACTIVE_LOW>;
	};
};

/ {
    aliases {
        aludeli2c = &i2c0;
        pca9539int = &interrupt_pin0;
    };
    gpio_keys {
        compatible = "gpio-keys";
        interrupt_pin0: int_pin_0 {
			gpios = < &gpio0 26 GPIO_ACTIVE_LOW >;
			label = "Port Expander Interrupt Pin";
		};
	};
};

Zephyr uses the DeviceTree standard to map how all of the hardware is connected. A vast amount of work has already been done for you by the manufacturers who maintain drivers for their chips and supply .dts (DeviceTree Syntax) files that specify pin functions and mappings. When writing firmware for your projects you supply DeviceTree overlay files that indicate sensors, buttons, LEDs, and anything else connected to your design. The C code looks up each device to receive all relevant information like device address, GPIO port/pin assignment and function.

const struct device *weather_dev = DEVICE_DT_GET_ANY(bosch_bme280);
sensor_sample_fetch(weather_dev);
sensor_channel_get(weather_dev, SENSOR_CHAN_AMBIENT_TEMP, &temp);
sensor_channel_get(weather_dev, SENSOR_CHAN_PRESS, &press);
sensor_channel_get(weather_dev, SENSOR_CHAN_HUMIDITY, &humidity);

The hardware abstraction doesn’t stop there. Zephyr also specifies abstraction for sensors. For instance, an IMU will have an X, Y, and Z output — Zephyr makes accessing these the same even if you have to move to an IMU from a different manufacturer due to parts shortages. You update the overlay files for the new build, and use a configuration file to turn on any specific libraries for the change, but the code you’re maintaining can continue on as if nothing happened.

Of course there are caveats which we cover in the talk. There is no one-size-fits-all in embedded engineering so you will eventually need to define your own .dts files for custom boards, and add peripherals that are unsupported in Zephyr. This is not a deal breaker, there is a template example for adding boards (and I highly recommend watching Jared Wolff’s video on the subject). And since Zephyr is open source, your customizations can be contributed upstream so others may also benefit.

Hardware will never again be the same

Electronics manufacturing will eventually emerge from the current shortages. But there are no signs of this happening soon, and it’s been ongoing for two years. We shouldn’t be trying to return to “normal”, but planning a better future. That’s what Golioth is doing for the Internet of Things. Choosing an IoT management platform shouldn’t require you to commit to one type of hardware. Your fleets should evolve, and our talk outlines how they can evolve. Golioth helps to manage your diverse and growing hardware fleet. Golioth is designed to make it easy to keep track of and control all of that hardware, whether that’s 100 devices or 100,000. Take Golioth for a test drive today.

How to use Ubidots data visualization

Golioth and Ubidots have teamed up to make it easy to visualize your Internet of Things device data. Ubidots makes it easy to white-label visualizations to produce a branded version of your service for end customers; you can also create end-users, in order to allow access to custom dashboards.

Our partnership has produced an integration that makes it a snap to connect your device data to an Ubidots dashboard so that it looks great for you and for your clients. Today I’ll walk you through the process of setting up a connection.

Ubidots data visualization dashboard

What you need to get started

To get started you just need a few basic things:

  • An account on Golioth (sign up)
  • An account on Ubidots (sign up)
  • A device that is sending data to Golioth

Creating your accounts is pretty easy; Golioth has a free dev tier, and Ubidots has a free Educational/Personal use option or a free trial period for their Business users. Everyone who has followed our Getting Started guide will already has a Golioth account.

If you don’t already have a device set up to send data, you can use the Golioth LightDB Stream example. It will simulate temperature data and send it back to the Golioth Cloud, a perfect dataset for your first Ubidots dashboard!

Setting up a connection between Golioth and Ubidots

To connect Golioth and Ubidots we need to take the follow steps:

  1. Configure an Ubidots plugin
  2. Configure a Golioth output stream
  3. Set up an Ubidots dashboard

1. Configure the plugin in Ubidots

Ubidots has a plugin specifically for Golioth. But before configuring the plugin we want to make sure we have a token to use for this project. From the Ubidots dashboard, click your profile picture in the upper right, choose API Credentials and click More under the tokens menu that appears. This will open the API Credentials page.

How to create an ubidots token

Use the plus sign to add a new token, then use the pencil icon to edit the name of the token.

Next, choose DevicesPlugins from the top menu. Click the plus to add a plugin, and choose Golioth. Click the arrow icon to get to the plugin configuration menu.

Choose the token you just created from the dropdown menu. In the LightDB Stream field, use the name of the endpoint where your device is sending data.

If you have a nested JSON, like {"env":{"temp":20.5}}, then you would set this value to “env” and the Ubidots plugin would pick up all of the key/value pairs inside of that JSON object.

If you are following along with the Golioth Stream sample, leave the LightDB Stream field blank, since we publish to the root-level directly. You can see in the code example below, we are setting the temperature value to the root-level “temp” key.

err = golioth_lightdb_set(client,
			GOLIOTH_LIGHTDB_STREAM_PATH(&amp;amp;quot;temp&amp;amp;quot;),
			COAP_CONTENT_FORMAT_TEXT_PLAIN,
			str_temperature,
			strlen(str_temperature));

Click the right arrow, give your plugin a name and description, and click the check mark icon to save. You will be redirected to a list of your plugins.

[screenshot]

Click on the one you just created and then select Decoder from the left sidebar.

Generally speaking, this page is already configured to work. We need to copy the Ubidots HTTPs Endpoint URL and use it to create a Golioth Output Stream in the next step.

If you want to learn more about the data format so that you can customize the decoder on this page, look at the DeviceStreamMessage in our Event Types documentation. For today’s example, the defaults will work.

2. Configure a Golioth output stream

Choose Ubidots as Output Stream

In the Golioth Console, select Output Streams from the left sidebar, click on Create an Output Stream, and choose Ubidots from the list.

Give your new Output Stream a name, and choose DEVICE_STREAM_TYPE as the event filter. The HTTPS Endpoint URL comes from the Ubidots dashboard. So does the auth token, which you can copy from the Ubidots dashboard by clicking your avatar in the upper right and choosing API Credentials(this reveals a panel that lets you copy tokens to the clipboard). Click save to finish setting up your Output Stream.

3. Set up an Ubidots dashboard

We’re ready to start visualizing! At the top of the Ubidots dashboard, select DataDashboards. You can create a new dashboard using the icon (sometimes called a “hamburger menu”) in the upper left.

On your new dashboard, click Add new Widget and choose a Gauge from the list.

Ubidots dashboard gauge settings

In the data section, click Add Variable, choose your device, and select the data you want to show. If your device is not listed, the endpoint may be configured wrong, or the device has not yet sent any data. There is a Logs section in the Ubidots plugins settings page that will be helpful in troubleshooting the issue.

The rest of the settings in this dialog decide how your data will be displayed. Set the name of the widget, and choose the range that suits you best before clicking the check mark icon to save the changes.

Temperature gauge

Now you have a gauge that shows temperature readings from your device. Of course there are many other visualization methods available to match your needs, so spend some time playing around with your new Ubidots dashboard!

Node-RED is a graphical programming tool that makes it easy to interact with web-based events. It’s called a “Low-code” solution because you can do a lot without writing much code. I love it because it’s the right balance of handling the hard stuff for me. Initial ease of use, while still making it possible to drop in custom code when I need it. I’ve been using that to control my IoT devices on the Golioth Cloud, and today I’m sharing how I do it.

Note: the concept of a node will be highlighted with bold text throughout this article to help clarify we’re discussing one of the blobs shown on screen in Node-RED

Why use Node-RED with Golioth

Earlier this year Ben Mawbey showed us how he uses Node-RED to manipulate data as it arrives on the Golioth cloud. This approach listens for realtime data using WebSockets. But this has a couple of limitations:

  • We will only see the data when it changes
  • We aren’t able to send or update data using WebSockets.

On that second point, the Golioth REST API lets us send/update data and query stored data.

Node-RED is a good choice here, since it’s relatively easy to set up a connection to WebSockets and the REST API. It’s powerful enough to do any data manipulation we want. It does need to run on a server, but on the upside that means it is always running and can be accessible to multiple end users via any web browser, no need to install an app. Let’s dive in!

Prerequisites

This example assumes you have already taken care of the following:

  • a Node-RED server
    • The Get Started page offers several solutions like running it locally on a Raspberry Pi, or on a cloud server
  • Golioth account, and a device added on the Golioth Console
    • As always, our getting started guide will walk you through all of these details
    • You can follow the demo below without having a hardware device, we just need to create a device on the Golioth Console to send data back and forth to the cloud

Connect Node-RED to WebSockets

The secret sauce in connecting a WebSocket is the URL which includes the Golioth API key. Go to the Golioth Console and choose API Keys from the left sidebar to create a new key:

The exact formatting of the WebSockets URL is detailed on our reference page, but I’ll show you how to do it here. Notice the three pieces of important data in the diagram below: project id, device id, and finally the API key.

I have chosen to connect to the dataendpoint to monitor LightDB state data. (If you want to monitor LightDB stream you can change data to stream.)

wss://api.golioth.io/v1/ws/projects/node-red-demo/devices/62695497404e12cd12628117/data?x-api-key=ynhJQQjLautKYLxQESuqB8VJLWMEVpH7

Setting up the Node-RED flow begins by adding a WebSocket-in node and connecting it to a debug node. I have also connected a JSON node for convenient data access later.

The WebSocket-in node is configured as follows:

The WebSocket type is “Connect to” which allows us to add a new URL. Click the pencil icon or the right side of that field and in the new window paste the URL. Because we are passing the API key as part of the URL, we do not need to add a TLS configuration.

Data will only appear on this WebSocket-in node when it first arrives on the Golioth Cloud. So generate an update by going to the Golioth Console and adding the key/value pairs shown above. In the Node-RED shown in the flow setup step, notice the debug output includes the raw payload as well as the JSON object.

Connect Node-RED to REST API

Setting up the REST API connection requires a bit of code, but uses the same project, device, and API key info from the last step. Two inject nodes (that send a 1 or a 0), a function node, an https request node, and a debug node complete this flow:

The inject node and http request node need a quick settings adjustment:

Set the payload of the inject node to pass 0 or 1 as a number (not a string). In the http request node, change the method to “set by msg.method”. The magic will all happen in the function node:

Code for this function is listed below. The variables at the top are used to set up the API URL, so you will need to enter your project id, device id, API key, and the LightDB state key that makes up the endpoint (led0 in my example).

var proj_id = "node-red-demo"
var dev_id = "62695497404e12cd12628117";
var api_key = "ynhJQQjLautKYLxQESuqB8VJLWMEVpH7";
var endpoint_name = "led0";

var dev_url = "https://api.golioth.io/v1/projects/" + proj_id + "/devices/";
var endpoint = "/data/" + endpoint_name;

var data = msg.payload;

var msg = {
	"method" : "PUT",
	"url" : dev_url + dev_id + endpoint,
	"headers" : {
		"Content-Type": "application/json",
		"x-api-key": api_key
	},
	"payload" : JSON.stringify(data)
};

return msg;

This code intercepts the incoming data (which will be a 0 or 1 from the inject node), formats it as a PUT command, and sends it to the http request node which will submit it to Golioth. In this demo, clicking one of the inject nodes updates the led0 value in LightDB state.

Head over to the Golioth Console and look at the LightDB state data for your device to see the changes. In practice, you can implement the desired state versus actual state principles discussed in my recent article and use this flow to update an LED on an actual piece of hardware.

Further Exercises: Dashboard/Web App

I’ve covered a lot of ground in this article and unfortunately have run out of column inches. But before signing off, I want to mention the potential for turning Node-RED flows into web apps.

The Node-RED dashboard node adds a UI which can be loaded on any browser. It looks spectacular with almost no work from us. Here you can see I’ve set up a display that shows the state of the LED, displays the latest value of the counter, and adds two buttons to turn the LED on or off.

If you want to test this out, here is an export of this flow that you can import into your Node-RED.

A word of caution: your flow contains an API key for accessing device information on Golioth. This must be kept secure. Please make time to review how to secure Node-RED and ensure that you authenticate users if you decide to build and share a web interface.

How to connect to Golioth with the ESP-IDF
PLEASE NOTE: This post was published in April of 2022. In July 2022, we released the Golioth ESP-IDF SDK, which is our recommended path for developing with the ESP-IDF. The post below is a great look “under the hood” to see what it took to connect to Golioth CoAP endpoints before our ESP-IDF SDK existed.

Golioth has great support for ESP32 devices. While our official SDK is built on the Zephyr RTOS, and we understand that there are some use cases where you might need to use the ESP-IDF instead.

The good news is that Golioth uses the CoAP protocol. So anything that can authenticate with Golioth and communicate over CoAP can be use with our platform. The ESP-IDF includes some CoAP examples, and allows pre-shared keys to be used for authentication, which means it will work with Golioth.

In this article, I’ll show you how to use VS Code to develop an embedded application that will connect to the Golioth Platform using the ESP-IDF instead of Zephyr. Let’s dive in.

Requirements

To follow this tutorial, you first need to have

  • A Golioth account
  • A Golioth project with at least one device
  • PSK-ID and PSK of your device
  • Visual Studio Code (VS Code) pre-installed

If you followed the Golioth Getting Started guide, you have already satisfied the first three requirements and will just need to install VS Code.

Install the ESP-IDF in VS Code

The ESP-IDF can be installed from VS Code. I suggest following this quick tutorial to install the ESP-IDF extension for VS Code, even if you already have manually installed it. We’ll only use the Graphical Interface provided by the extension in this tutorial.

Create a coap-client project from the ESP-IDF examples

Open the VS Code command pallet (ctrl+shift+p) and search for “ESP-IDF: New Project“

In the New Project window, enter:

  • project name: coap-golioth-hello
  • project location: <path-to-your-project>/
  • ESP-IDF board: custom board
  • ESP-IDF Target: Esp32 module
  • Serial Port: choose the serial port that your device is connected (in my case, /dev/ttyUSB0)

Click on “Choose Template” button, then click in the selection box and select “ESP-IDF” option

Next, a new windows will be open with ESP-IDF samples.

Scroll down and go to Protocol section and select coap_client sample option. Then click on “Create project using template coap_client”.

A status will appear at the bottom right corner showing the progress.

When finished, a new window will appear on the bottom right asking if you want to open the recently created project in a new window.  Click Yes.

After you create the Project and open it in VS Code, you’ll see the project structured as shown above.

Set up the Golioth platform as the CoAP destination

You will not need to change the the sample code contained in the main folder to make this tutorial work. The only change needed is to create a configuration file and set some variables.

To create the complete config file, we’ll use the menuconfig tool that the ESP-IDF extension makes available for us. Click the gear button in the VS Code bottom tool bar:

A new SDK Configuration Editor window will open:

We will set some configs in this windows.

First, at the left menu bar, click the Example CoAP Client Configuration:

Next, set the following values:

  • Target Uri to coaps://coap.golioth.net/hello
  • Preshared Key (PSK) to the PSK of your device which you’ll find in the Golioth Console
  • PSK Client Identity to the PSK-ID of your device which you’ll find in the Golioth Console
  • WiFi SSID and WiFi Password to the name and password of your WiFi network

There’s one last setting needed before saving your configuration. In the left menu bar, go to CoAP configuration and set the CoAP Encryption method to Pre-Shared Keys.

Finally, click save.

When your configuration is saved, the ESP-IDF extension will make some changes in your structure. It creates an sdkconfig.old file that contains the previous config before saving the new one, and also a new sdkconfig file that contains all the new configuration variables.

At this point, our tutorial is ready to be built and flashed to the device. If you check the Golioth Console before you first run the example, you’ll notice the device is reported as offline. If we did everything right, that’s about to change!

Run the CoAP example on ESP32

To build the firmware, click the cylinder button at the bottom tool bar and wait for the build process finish:

After the build finishes, ensure your device is connected to the USB port, click the flash button and, again, wait for the process to finish:

At this point, you have the firmware running on your device. But how can we see if it’s running properly?  Just click the monitor button, and you’ll start to see all the logs coming from your device through the serial port:

Above, you see some logs generated when the device is booting which includes some interesting information about the device.

Below, you can see logs related to the Golioth communication itself. As we set our Target Uri to coap.golioth.io/hello, this endpoint sends back a hello message every time the device connects to it:

So, from the device perspective, you can see that it managed to connect to the Golioth, right?

But let’s see from the Golioth Console perspective. Go to the Device section in the console and you will see the device is now reported as online:

Conclusion

At this point we can see that connecting a device to the Golioth using the Espressif ESP-IDF and the CoAP protocol is not hard. This post serves as a “Hello World!” to get the connection up and running. Now that you’ve done that, you can easily transfer data between your ESP32 and Golioth.

Espressif has included a lot of examples with their VS Code extension that will help you better understand how to use it and are worth further study. In my next tutorial I’ll continue using the CoAP protocol but this time we’ll see how to send a LightDB Stream package, which includes time-series data perfect for visualizing the information being collected by your devices.

Golioth has premier support for certain hardware platforms, including the Espressif ESP32 platform. In this post and associated videos, we will show you how to get started using Golioth and Zephyr on the ESP32 platform.

Re-Introducing Support for the ESP32

Long time Golioth watchers will note that we once had older versions of the videos below on our YouTube channel. Everybody is doing reboot movies these days, right?

We recorded new videos to showcase the updated onboarding process for developers to get started, including directions for getting started using Golioth. Previous videos showed a command line interface as the main way to interface to the Golioth cloud. Then and now, users could use goliothctl to query devices and pull data from the data streams on the Cloud such as LightDB State and LightDB Stream. Since then, the Golioth Console is the recommended way for users to get started. The graphical interface of the Golioth Console makes it even easier to add and provision new devices to a user’s Dev Tier account. A couple of clicks and you have a set of credentials that you can then add to your actual device (in this case, an ESP32).

Now that your device is provisioned, our Getting Started with ESP32 video shows an updated installation of Zephyr RTOS and how it can connect to the Golioth Cloud to send your first “hello” message. This is a walkthrough of our written directions on the topic, available on our docs site. There is a secondary video that shows the full walkthrough of installing the Zephyr toolchain for the ESP32.

Why we like the ESP32 and Zephyr

So why the ESP32? As a hardware designer, I don’t think it shines in any particular area, except for one. It is almost never the lowest power WiFi solution, nor is it the most powerful processor. It’s definitely a low cost processor, but high volume applications often have access to a range of parts that can meet price targets. It’s not the tooling, as it even uses a less common Xtensa core instead of an Arm core. What I like most about it is: you can buy it. In the current chip shortage, we have seen the ESP32 “on the shelves” throughout the time we have been developing.

On the software side, we like that the Espressif team has also enabled Zephyr support. They are still working on adding new features, including MCUboot support, which enables Over-The-Air updates for ESP32 based projects with Golioth. Zephyr is not their primary software support, as Espressif develops ESP-IDF, which is a custom FreeRTOS implementation for ESP32-based parts. While we don’t support ESP-IDF directly in our SDK, we have content coming out soon showing how users can directly connect to the Golioth cloud using ESP-IDF over CoAP. Overall, we like that the Espressif team and the surrounding community is devoted to extending capabilities of their parts to many different types of software and Real Time Operating systems, and giving it back to the community. We try to match this ethos.

Should you try the ESP32?

The ESP32 represents an affordable, available platform for you to try out Golioth on a real device. If you follow our docs or follow along with the videos below, you can expect to have a fully functional IoT device by the end of the tutorials. From there, you can go from a single prototype to scaling up a fleet of thousands of devices without needing a “cloud team” to manage your various services on the cloud.

Videos

The line between the hardware and software worlds continues to blur. One advantage is the range of software tools that are coming into the hardware and firmware space, such as “Continuous Integration, Continuous Deployment” (CI/CD). This ensures each commit of code to a repository is immediate run against a slate of tests, compiled using a standardized compiler, and deployed to eligible devices for testing. What if your IoT firmware deployments happened automatically just by typing git push?

In this post and the associated video, Lead Engineer Alvaro Viebrantz talks about a sample project that compiles and delivers firmware to eligible devices automatically using GitHub Actions. Follow along in our repository on the Golioth Labs page.

Note: The arduino-sdk repository showcased in this post is deprecated. GoliothLabs has two experimental repositories that may work as replacements:

Compiling in the cloud?

Most embedded engineers hear “cloud compilation” and start shaking their head no. Having an IDE or a local toolchain is the expectation for fast iteration and direct debugging of code using tried and true methods. But being “local only” also runs into dependencies that might be on your machine versus your co-worker’s machine. What’s worse, you might be lulled into a false sense of security and never venture past having a single machine that is capable of compiling critical device firmware. (Don’t believe me? Ask a long time firmware engineer about the steps they had to go through to keep that old computer running to compile code for the legacy project.)

Moving your final (production) builds to the cloud is beneficial because it removes localized dependencies. Distributed teams are increasingly common. Now when an engineer in Brazil, the US, Poland–or any other place your teammates might be–commit code to a repo, it receives the same treatment. If you have GitHub actions (or equivalent hooks) set up on your repository, it kicks off a compilation on a container on the cloud. The output firmware is then uploaded to Golioth. As we see in the video, it’s still possible to build on a local machine, but the standardization is very helpful as you move towards scaling your product and making production grade firmware.

Walking through the demo

Let’s recap the steps taking place in the video and discuss what is relevant about each step.

  • Build firmware locally
    • This showcases that while the toolchain is available on the cloud, it’s not only on the cloud. Developers can still create a local image for testing.
  • Load initial firmware to the device
    • Since the firmware is responsible for reacting to new firmware on the Golioth Cloud, we need to load an initial image to start checking whether an update is available. As Alvaro mentions, the firmware recognizes that the same version loaded on the device initially is also the latest on the cloud, so no action is taken.
  • Creating device credentials using the hardware ID
    • Golioth allows you to set a range of different IDs to help identify devices in the field. This is especially important as your fleet grows. As part of the provisioning process, Alvaro shows how the code on the firmware image can also extract a unique identifier that is programmed into the silicon at the factory, so it is possible to always verify which device is being identified, all the way down to the silicon.
  • Generate device credentials on Golioth
  • Set WiFi/Golioth credentials over the Console
    • Setting device credentials allows the Golioth Cloud to validate a device is able to talk to the network. Alvaro demonstrates using a serial connection with the device to add these credentials, a recent improvement that will enhance device programming in the factory or as users provision a new device.
  • Device connects and begins to send logs and LightDB State data
  • Make a small change and commit to the repo. Push a git tag.
    • Pushing the change to the repository and adding a tag is what alerts the GitHub actions logic to start compiling a new firmware image.
  • The firmware is built in the cloud as part of GitHub actions.
    • For this build, Alvaro is using our Arduino SDK along with PlatformIO. This is in a container that the GitHub action boots up and uses to standardize the firmware build.
  • The artifact is pushed to the Golioth cloud
    • As part of the setup process, the user will need to generate an API key to place on GitHub in order to allow GitHub to push the new firmware issue as an Artifact on Golioth.
  • Create a release using the Console and roll out the firmware to the eligible device.
    • This is a manual process in the video, but a user could also utilize the REST API in order to create a Release and set the release to be eligible for rollout to a set of devices that are tagged on Golioth (different than GitHub tags). Remember: Any action possible on the Console can be scripted using the REST API.

Extending the demo

One theme that is obvious throughout this video is the focus on moving your product to production. Programming devices as they come off the line is no small task and something we will continue to make content about here at Golioth. And future videos will describe methods for running real-world tests on hardware, something we are interested in given our support of hundreds of boards.

In the current demo, Alvaro shows loading credentials over serial. Past examples have also shown Bluetooth credentialing using MCUmgr. We’d love to hear more about how you’re creating your devices and how you want to program things as you move towards production. Please join us on our Discord or on our Forums to discuss more.

Looking for direct help getting your devices into production? Reach out at
The following post was written about Thread in April 2022. We are leaving it here for historical purposes, but we suggest that you check out some of our more recent work with Thread on the Golioth Reference Design template and using commercially available Thread Border Routers.

Golioth is a flexible device management solution that allows you to manage devices that have IP addresses. This includes devices connecting over Ethernet, cellular, and Wi-Fi. Today we’re showcasing a demo of a Thread-based device. Utilizing the Golioth Console and API endpoints, it’s possible to manage a wide array of devices provisioned on the internet through a Thread Border Router. This enables even more low-power devices to reliably push data back to the internet for processing on the cloud.

In this post and the associated video, we show a demo of how developers can try out using Golioth to manage Thread based devices.

What is Thread?

Thread is a network protocol for low power IoT devices. It uses 6LoWPAN for mesh communications, in our case on 2.4GHz. In the examples above, we showcase Thread using OpenThread on an nRF52840 from Nordic Semiconductor. Multiple hardware vendors have Thread-based solutions, using Zephyr or other firmware solutions. Vit Prajzler shows how he is using the OpenThread documentation to build different types of devices that form a Thread mesh network, including a Radio Co-Processor (RCP) and a Full Thread Device (FTD).

Set up a Border Router

A Border Router is an element on a Thread Mesh network that allows the entire network to communicate with the broader internet. Each individual device (Node) has an IPv6 address, which allows Golioth to manage specific devices on a mesh.

While it’s possible to buy a few off-the-shelf Border Routers, we showcase building one using commonly available components. Vit is using a Linux computer (a Raspberry Pi), along with an nRF52840 dongle configured as an RCP to route network traffic from the mesh to the rest of the internet. In the case of his Thread network, Vit needs to include a translation layer (called NAT64) to talk from his IPv4-based router to the IPv6-based Thread network. In the future, when Vit gets an IPv6 address assigned to his home network from his ISP, no conversion will be required.

OpenThread software on a Linux device like a Raspberry Pi also has a web interface for managing connected devices. This is a useful way to visualize your network and the location of the Border Router within that network.

Using the Golioth interface in the Zephyr SDK

Once your Border Router has been set up, you can use the Golioth Zephyr SDK to compile an image for your device using OpenThread. In the video above, Vit is compiling for an nRF52840 (dongle). Once this device is loaded with Zephyr-based firmware and added to the mesh network–in this example, connecting directly to the Border Router–the device acts like any other IP connected device. It has an IPv6 address and can ping the address of the Border Router. It can also connect to various Golioth endpoints.

Vit demonstrates button presses and boot commands being logged in Zephyr, which then display over the UART. However, Zephyr logs are also tied to the Golioth logging end point (from the Thread network connection), so they can be viewed on the Golioth web console. As Vit presses a button on the Zephyr based device, the log message almost instantaneously shows up on the cloud.

Extending the examples

Towards the end of the video, Chris and Vit discuss how (Open)Thread-based devices built with Zephyr work very similarly to any other IP-based devices connecting to Golioth. This means that the other features that Golioth provides–such as control using LightDB State, or easy time series data tracking using LightDB Stream–is already in there. And yes, that means Firmware Updates as well. We’ll be showcasing these more in future videos.

We’re excited to bring Golioth and internet connectivity to even more devices, including the kind of teeny tiny low power ones that Thread enables. Please stop by the Golioth Discord or the Golioth Forums to ask questions and discuss the next device you’re working on!

Interested in Thread in a commercial application? Contact us at


Datacake makes beautiful dashboards for your IoT data. Golioth delivers the tools you need to manage your IoT hardware fleets. What if the two platforms worked well together? They do!

We’ve partnered with Datacake for an integration that easily connects your device data to create visually stunning presentations.

Demo

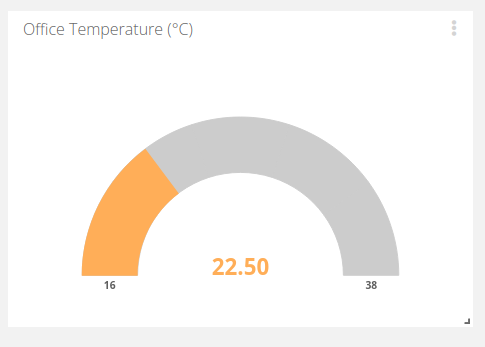
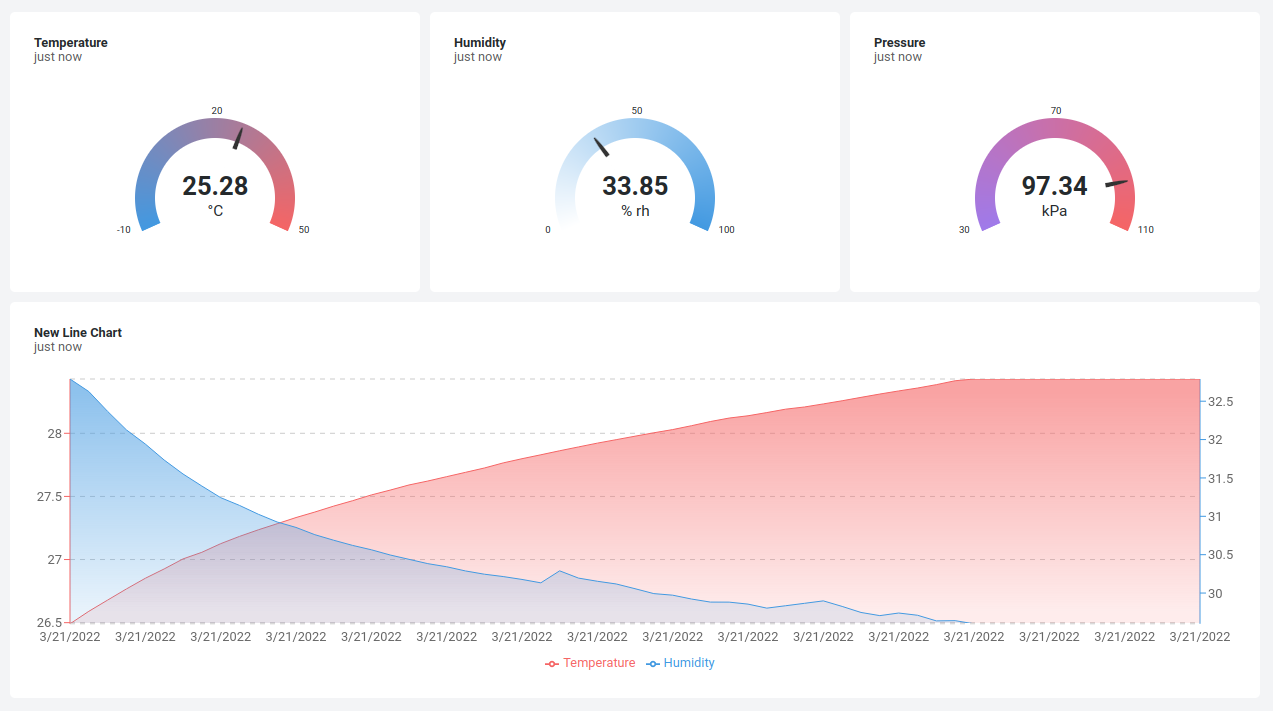
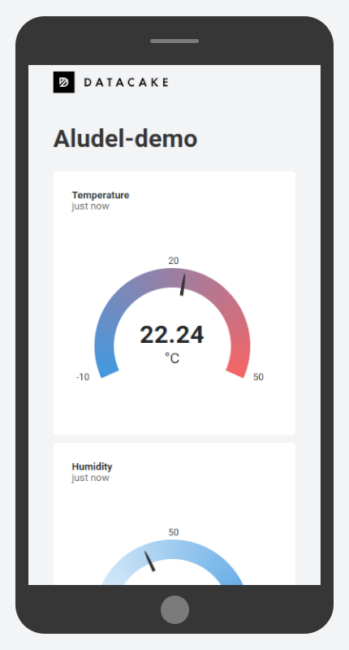
You’ll have no problem packing all kinds of display data into one computer screen with this setup. But one added bonus when working with Datacake is that you can generate publicly viewable links that include a dashboard optimized for mobile viewing. Think of sending your prospective customers a link to a sleek dashboard with live data from the proof-of-concept hardware you just bootstrapped.

Our demo today uses the temperature, humidity, and pressure data from a BME280 sensor, but the pattern is easily adapted to any visualization you need.

Setting up a Datacake Connection

Golioth and Datacake have integrations in place to communicate between the two platforms, so there are only a few steps to complete setup:

  1. Find your Golioth device ID
  2. Add a device on Datacake
  3. Use the Datacake endpoint to set up a Golioth output stream
  4. Select the specific data to visualize on your Datacake dashboard

For this demo, the weather-sensor sample code was used to stream temperature, humidity, and pressure. This will send real data from a BME280 sensor, or send simulated data if a sensor is not available.

Step 1: Golioth device ID

The prerequisite for this step is to have a device set up on Golioth to stream data. We have a free Dev Tier, so if you haven’t done so yet, register your account and set up a device.

Golioth Device ID

In the Golioth Console, select Devices from the left sidebar and click on your device in the resulting list. In the device view, as shown above, copy the Id, which we’ll need when adding a device in Datacake.

Step 2: Add a device in Datacake

The prerequisite for this step is to have a Datacake account. Your first two devices are free, so to give this guide a try, sign up for Datacake.

Add a device in Datacake

Once you have logged in, choose Devices from the left sidebar menu, then click the blue Add Device button in the upper right. As you can see above, you first click the API button at the top, select the New Product from template tile, and select Golioth.io from the list. Scroll down and click the blue Next button.

Datacake add device id and name

The resulting window asks us to enter a Serial Number, this the device ID we copied from the Golioth console in the previous step. (NOTE: double check that there are no spaces before or after your device ID.) Give this device a Name that makes sense to you. After clicking the Next button you will be asked to choose a plan for this device. There is a free plan option.

Datacake endpoint URL

You will be returned to the Device page. Click on the name of your newly created device and choose the Configuration tab. Scroll about half way down the page until you see the HTTP Endpoint URL. We need to give this to Golioth to authorize the output stream.

Step 3: Configure the Golioth Output Stream for Datacake

Back in the Golioth Console, select Output Streams from left sidebar menu, then select Datacake from the resulting list.

Golioth output stream configuration for Datacake

The Name field can be anything of your choosing. Paste the endpoint URL from Datacake into the HTTP Endpoint URL box as shown above, and click save.

Golioth Output Stream test

It’s a good idea to test the Webhook connection to Datacake that we just created to make sure it is working. After clicking save on the Webhook, choose the Custom Test tab in the window that appeared, and click Send Test Event.

Datacake show logs

Back in the configuration page of your Datacake device you will see a Show logs button in the right side of the HTTP Payload Decoder section. When you click it, a dialog opens. Wait a few seconds and you will see our {"data":{"hello":"world"},… test message appear. Success!

Step 4: Choose the data to show on your dashboard

Datacake sets up a default dashboard for Golioth data to display temperature, humidity, and pressure data. It expects data packets to stream in that look like the code below.

{
  "data": {
    "environment": {
      "humidity": 37.325195,
      "press": 98.508472,
      "temp": 23.46
    }
  },
  "device_id": "622fb52aa50e6c807d269a31",
  "project_id": "datacake-demo",
  "timestamp": {
    "nanos": 206247513,
    "seconds": 1647879865
  }
}

You can customize the Datacake interface to use the data of your choosing. In your device’s configuration tab, scroll down to the HTTP Payload Decoder section.

Important here is the var data assignment that you see highlighted in the screenshot. This should map to the object in your JSON data that holds the key/value pairs you wish to access. Look a few lines lower (44, 49, and 54 in the Datacake example) and you will see the values being mapped to field names for graphing on Datacake.

There is a Golioth specific guide in the Datacake documentation that goes into detail about these field values, and how to further test the decoder set up.

If you have been following along so far, and have a device actively sending data, then all you need to do is to click the Save button for the decoder settings to take effect and the the graphs will begin displaying live data. Click the Dashboard tab at the top of your device page and the Temperature, Humidity, and Pressure gauges will appear. In this view it’s easy to add more widgets and play around with how the data is presented. This is also where you can generate a public link to your dashboard.

Better visuals in less time

Datacake dashboard

Your customers want to know what’s going on with their IoT fleets. Being able to build out professional quality visualizations quickly is both impressive, and a way to free yourself up to work on other rollout issues. That’s why we continue to add to the Output Stream options here on Golioth and we’re particularly excited about this partnership with Datacake. You should give it a try!

What if you could open a text document on a device, write code, click save, and everything magically starts working? This is the promise of high level programming languages like CircuitPython. Golioth Labs now has an SDK to utilize the language’s fast prototyping capabilities. In addition to Golioth’s cloud functions, it’s super easy to pass data from a networked device up to the Golioth cloud. Click save to stream IoT device data to the cloud!

What is CircuitPython?

Adafruit created CircuitPython (CP), which started as a hardware specific fork of MicroPython (MP). Both CP and MP are based upon the ideas of the Python3 programming language, such as using an interpreter and basing language syntax on whitespace separators. The challenge is that the interpreter must live on a much smaller target than most computers running Python; fitting all of that into 128K of flash and 32K of RAM is a challenge! The hardware specific ports of CP encompass many of the Adafruit boards, but are really targeted around the chipset on those boards. Targets like the Microchip SAMD21 and SAMD51, the Raspberry Pi RP2040, the ESP32-S2, and more. The project continues to grow, both from Adafruit’s ongoing contributions and from a strong community contributing to the project.

Developing for prototyping

One of the strongest features of a language like CP is the ability to quickly iterate code. The “click save and your code starts running” is in contrast to the traditional method of compiling code on an external device (ie. your laptop), downloading it through a debugger (ie. a J-Link), debugging the code, and then watching the output. Because the CP interpreter is on the device itself, it processes the code as the device starts. While this means there is less room for user code, it is a much faster turn around once you click save.

During Golioth “Office Hours” on our community Discord (happening every Wednesday at 1 pm EST / 10 am PST), we had users asking for a faster way to prototype. Golioth developed an SDK in the “Golioth Labs” section of GitHub to interface with the Golioth API(s). This allows users with CircuitPython based programs to connect their IoT devices to the cloud and pass data back to Golioth. Much like the Arduino SDK experiment repo by Golioth Labs, we are interested in trying to extend the functionality of the Golioth cloud to many different platforms. If you have a hardware platform you would like supported, please post about it on our community forum!

Transport? I just want to get there!

As Alvaro points out in the video below, the transport layer is not something the user needs to care about with the Golioth CircuitPython SDK; any time you are working with a Golioth hosted SDK, you will be working at a higher level than the transport layer of communication, such as CoAP or MQTT. Many IoT platforms stop at the transport layer, notably MQTT examples. By moving up to working with APIs to LightDB State or LightDB Stream, you get additional functionality on the device side and you can better maintain your data on the Golioth console. Users always have the option to work at a lower level and peek under the hood at how the communication is happening. For people wanting to get started quickly, it’s important to have a high level way to start streaming data to the cloud.

Getting started with CircuitPython and Golioth

In the demo below, Alvaro showcases a sample setup using the following

First follow the Getting Started Guide to program your chosen hardware with the .UF2 file that represents the underlying CP tools, such as the interpreter and the code required to make your specific microcontroller into a CircuitPython based device.

The next step is hooking up the MicroMod device to the ESP32 modem using jumper wires. Read your board documentation to find an accessible UART port (TX/RX). Once completed, this enables the (Bluetooth based) nRF52840 to communicate over a UART connection to the modem and gain a connection to the internet using the ESP32’s WiFi interface. Credentials for the WiFi modem to connect to a local hotspot are sent from the nRF52840 to the ESP32 using AT Commands early in the CircuitPython program.

The example code on the Golioth CircuitPython SDK primarily lives in code.py. The device first connects using credentials for the WiFi network and PSK information for validating onto the Golioth cloud contained within secrets.py. After the UART is configured, the main processor (nRF52840 in the example below) starts communicating with the modem. In Alvaro’s example, he is sending the internal temperature of the processor using LightDB stream. He is able to send an update down to the board using LightDB State to remotely turn on an LED on the board, which is listening for changes on the /led path, similar to other examples that use LightDB State.

Watch the demo

It all comes together in the video below. Learn about how Golioth and CircuitPython pair to make a great combination for prototyping your next sensor project.

This guest post is contributed by Ben Mawbey, a community member who is active on the Golioth Discord and frequently takes part in Office Hours.

Data wants to be visualized. The impact of showing a customer a slick plot of the information their devices have been collecting is massive compared to pointing at a few hundred lines of text from a log file or database query.

I was looking for some sort of dashboard or charting application for a demo for a sensor system we’ve built. I figured this will appease the clients’ need for pretty pictures over boring reports. I found exactly what I needed, and it only took me about 30 minutes to get it up and running.

Grafana graphing data

This looks great, even if you have no idea what the graphs mean! Let’s dig into how to get from numbers in a database to pretty pictures in a dashboard.

Pieces of the Puzzle: Golioth WebSockets, Node-RED, InfluxDB, and Grafana

Golioth is brilliant at getting your device data from the real world up to the cloud, climbing the IoT bean-stalk some would say. While abstracting some of the trickiest IoT problems, Golioth can present your time-series data as a convenient cloud resource using LightDB Stream service. By leveraging the built-in WebSockets support and some open-source tools we can rapidly store, manipulate and display this data!

Grafana is the open-source blockbuster for this application and can be easily set up to graph sensor data directly from Golioth LightDB Stream using the REST API. This has two major drawbacks:

  • Grafana must periodically poll for new data
  • While LightDB Stream does provide convenient data retention, I prefer to use my own data storage

Enter InfluxDB, the time-series database powerhouse and an ideal companion to Grafana when talking about IoT real-time applications. This pairing is so popular that the InfluxDB data source integration is baked right into Grafana! By utilizing InfluxDB to store our sensor data, we can perform more complex queries much faster.

The question remaining is how to shuffle data from Golioth to InfluxDB? There are many potential solutions to this hurdle, but my favorite is Node-RED which defines itself as a low code programming tool for wiring up event-driven systems.

Node-RED editor window

Node-RED uses graphical flows to connect data sources and destinations, bending protocols and translating data formats in innumerable ways

Node-RED has exploded in popularity and provides all sorts of integrations to connect your systems together. It provides simple blocks to perform actions and a slick graphical interface to wire up your data flows. Conceptually Node-RED acts as our rule engine to process and direct data.

Dashboards: Grafana and InfluxDB

System diagram

Grafana is immensely powerful at providing example custom views, data transformations, and alerting. That said, it is only as good as the quality of data you can provide. Having a tightly coupled InfluxDB instance with carefully curated data via Node-RED, allows you to quickly configure complex data queries on large datasets with low latency.

Before we can play with Grafana the first step is InfluxDB setup. After you’ve installed InfluxDB, create a new database on your InfluxDB instance:

> CREATE DATABASE golioth

Configure the InfluxDB Data Source in your Grafana instance by clicking the gear icon on the left sidebar, choosing and adding a data source, then searching for the InfluxDB plugin. Here’s how I’ve set up my data source:

Grafana InfluxDB source configuration

Assuming you have some data in your DB, we can quickly create a new time-series dashboard panel in Grafana and query the dataset using this integration:

Grafana panel configuration

This simple query shows how we structured the data in the DB, allowing us to select from a particular measurement, specifying a specific device identity tag and aggregating data points with specific time buckets. Adjusting the time range instantly updates the graph from our local InfluxDB instance.

Now how do we get the data from Golioth into InfluxDB?

Node-RED

Several networking integrations are provided with Node-RED. Presently the most relevant to Golioth would be HTTP nodes for REST API requests and the WebSockets node which is the easiest to configure.

You can see your sensor data collecting in the Golioth LightDB Stream by using the Golioth Console web interface:

Golioth Console showing LightDB stream data

We can use Node-RED flows to connect to Golioth via WebSockets and store the resulting data in our local DB:

NodeRED editor window

The nodes in this flow were set up as follows, taking care to give them appropriate names making it obvious to see their function. All of the nodes I’m using should come as part of every Node-RED installation except for the InfluxDB nodes. But don’t worry, these are trivial to install. On Linux is looks something like this:

cd ~/.node-red
npm install node-red-contrib-influxdb
sudo systemctl restart nodered.service

WebSockets Node:Node-RED websockets

First set up the credentials to your Golioth project using your generated API key and connect to the WebSockets LightDB Stream endpoint.

Debug Node:Node-RED debug

Drop a few of these nodes along the way and click the small green button to turn the debug log on. This is super handy to check data coming through and make sense of it.

JSON Node:Node-RED json

The LightDB Stream endpoint provides us with a JSON object representation containing our sensor data as well as meta information such as the data timestamp and device identity. This node allows us to parse this JSON into a javascript object so that we can work with it more easily in subsequent nodes.

Change Node:Node-RED change node

This node clearly shows the power of Node-RED as we can craft any sort of data manipulations or transformation.

We could do without this node and jump straight to InfluxDB, however, should any malformed data arrive we risk polluting the DB with bad data. By selectively transforming the incoming data and mapping it into a new object we can not only filter only good packets and arrange the measurement names but also add tags to build a solid data representation in the DB making our queries far more powerful.

InfluxDB Out Node:

Node-RED InfluxDB input nodeNode-RED InfluxDB server settings window

Finally, we can configure the data connection to our InfluxDB instance, set appropriately for your server configuration and database created earlier.

Assuming your flow is set up correctly, you should be able to see data collecting in your database. We know it works, but as I mentioned before, this visual is not going to impress our customers.

InfluxDB data

Revisiting the Grafana panel we previously created, you can see InfluxDB data is now being plotted!

Grafana graphing data

Corner Cases

One of the downsides of WebSockets is their ethereal nature, should there be some temporary connectivity issue, any data packets would be lost from the point of view of your InfluxDB database. A solution around this could be to set up another flow that executes periodically to sync with the LightDB Stream using the REST API. Node-RED could then be configured to check this data and add any missing values into the InfluxDB instance and prevent consistency issues.

Another concern with open-source self-hosted systems is security. It can be challenging to secure your server and services should they be public-facing. If you are handling sensitive data then it would be best to consult with an expert in this field. Fortunately, all of the tools discussed have subscription-based cloud services available that sort all of this out in the background.

Conclusion

Being able to set up a simple demo like this in less than 30 minutes demonstrates the power and flexibility of these modern open-source solutions. Coupled with the reliability and maintenance advantages of the Docker system, it’s a breeze to test locally on your desktop or Raspberry Pi and then deploy to production a moment later on your cloud server of choice. The rules engine and ease of wiring up blocks provided by Node-RED opens up a massive pool of possibilities, from countless other integrations to building intelligent processes. One such idea I would like to explore is integrating a device provisioning process into the flow such that we can link a device to a dataset or location during deployment or maintenance.