The conference season is in full swing, and the Golioth team will be showing off device cloud hardware demos at Embedded World in Nuremberg.
With the past few years of virtual meetings, we’re relieved that we can finally connect with our friends and colleagues in person. We’d love to see you swing by the Golioth booth to say hi. You’ll find us as among the Zephyr Project exhibits at Booth #4-170 in Hall 4.
The show floor is going to be pretty hectic, so if you want to get together for an more in-depth conversation, we’re happy to schedule a meeting in advance. Email the DevRel team and let us know.
A preview of the Golioth hardware demos
We had so much fun putting together a set of awesome hardware demos to show what we’ve been working on since coming out of stealth mode a year ago and completing our beta phase back in November. If you’re interested in trying out anything you see here, our Dev Tier is free for your first 50 device!
OpenThread
The new hotness on the IoT block is OpenThread, an open-source implementation of Thread. This mesh networking protocol is officially known as 802.15.4 and it works extremely well with Golioth’s device management cloud—we have already published our demo code, and have a full guide and blog post ready to roll next week while we’re at the conference.
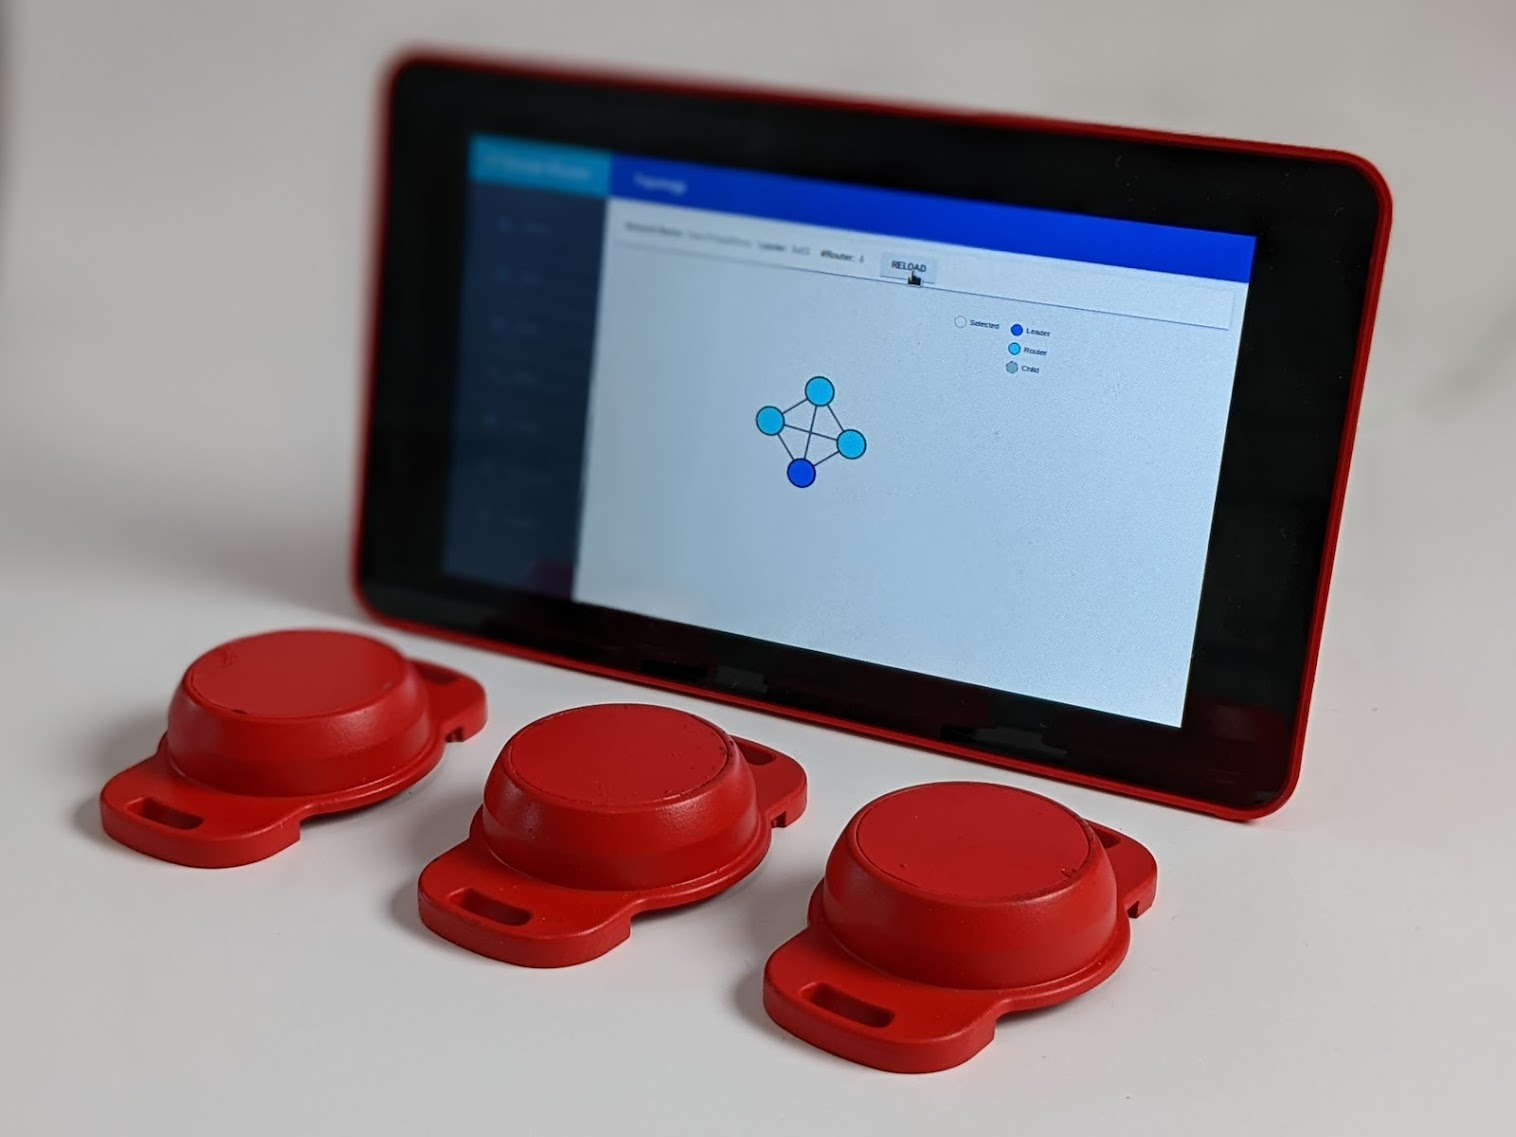 Our demo uses a Raspberry Pi as the “border router”, although any Linux device will work nicely. A Nordic Semiconductor nRF52840 dongle connects to the Pi, acting as the radio co-processor (RCP) so that the Pi can communicate with the other devices on the Thread network. We’re connecting three Laird BT510 nodes (also based on the nRF52840) to build out the network.
These devices all have IPv6 addresses and connect to the wider internet via the border router. Of course Golioth is secure by default, so all communications are encrypted. You get the best features of Golioth, from full-featured data management to over-the-air (OTA) firmware upgrades.
IoT Devices reacting to one another
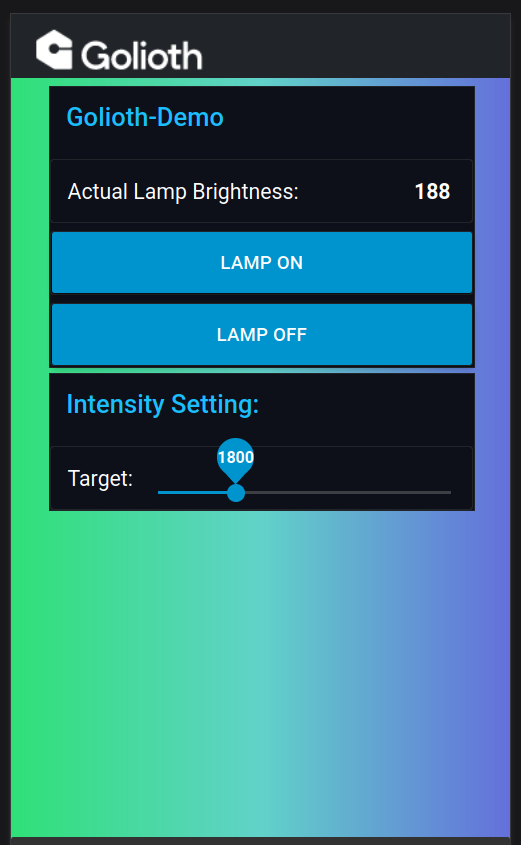 As we showed at the recent Zephyr Developer Summit, we color-coded all of our demos for easy reference. The Green Demo shows off the interconnected features of Golioth. It’s based around the concept of using smart grow lights in a greenhouse to supplement natural sunlight.
A light intensity sensor reports back the actual readings. If it’s a cloudy day, lower intensity readings are detected and the grow lights automatically swing into action, modulating their power usage to dial in the target light intensity. This saves energy, while ensuring the greenhouse yield and harvest dates aren’t affected by the fluctuation of natural light.
The target intensity can be set remotely through the Golioth Console. But for fun, we also made a dashboard you can load on your phone to adjust the setting.
Output Streams for your cloud team’s favorite platform
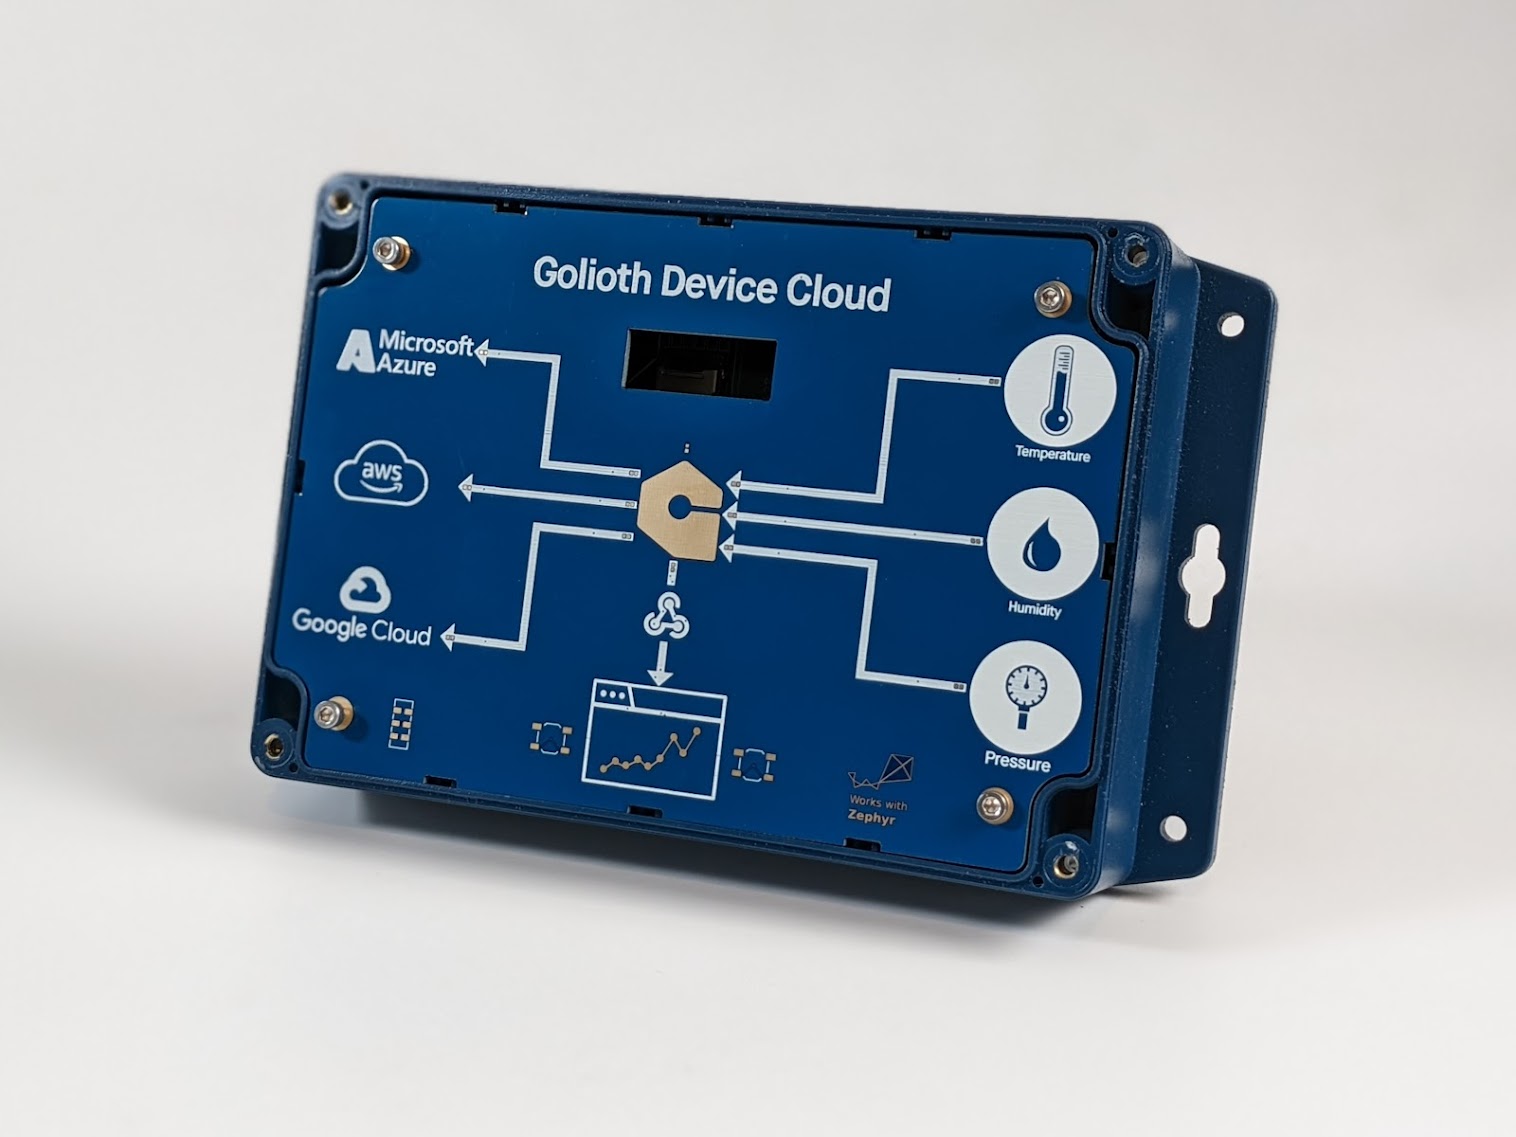 Your device data is stored on the Golioth Cloud and easy to work with. But your cloud team may already have infrastructure in place on a platform like Microsoft Azure, Amazon AWS, or Google Cloud Platform. No sweat! We can seamlessly connect to those with our output streams feature.
The Blue demo at our Embedded World booth shows off the ability to select which weather sensors (temperature, humidity, pressure) are being recorded, and select between sending the data to any of the three cloud platforms. This is also a great option if your team ever decides to move to a different cloud. You can put multiple output streams in place in order to test out the new setup before moving your production servers.
Mapping data and visualizing everything
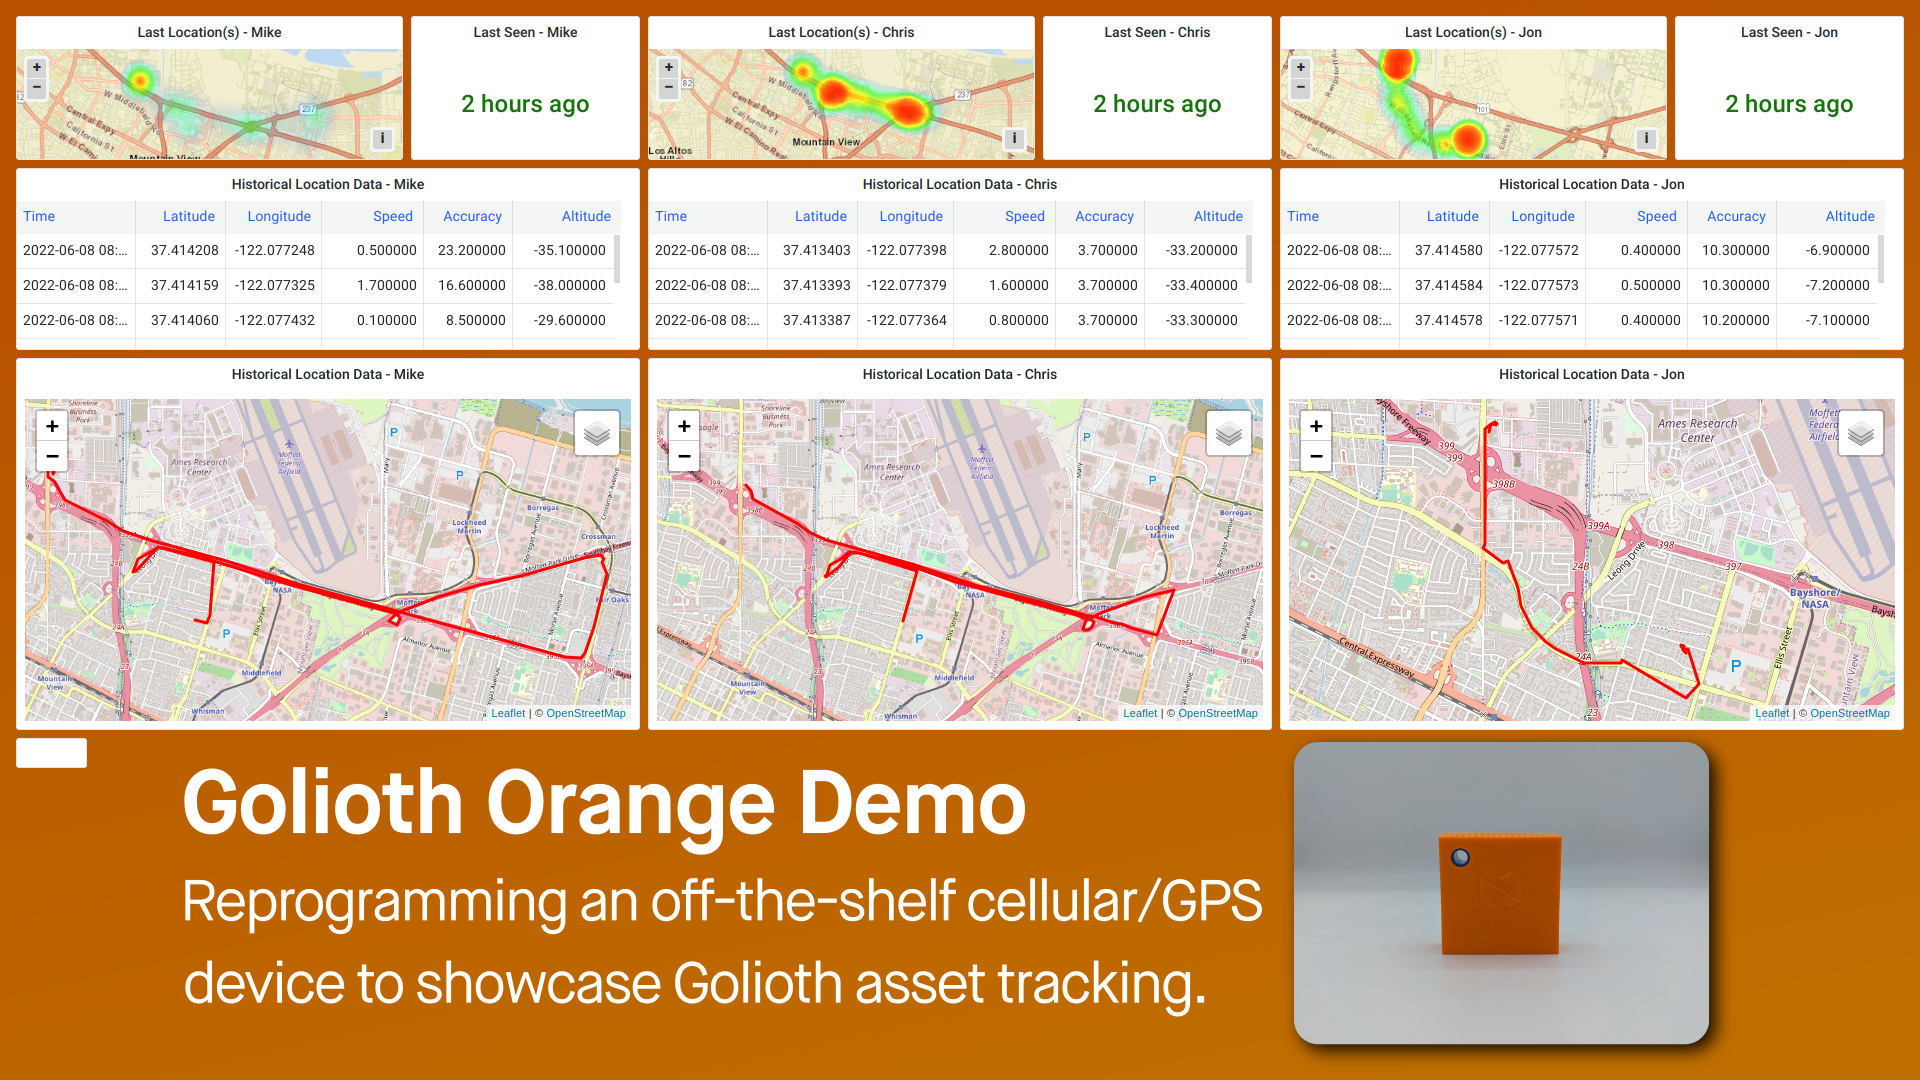 Golioth’s Orange Demo started as a way to show that commercially-available hardware can be used with our platform. The Nordic Thingy91 is a cellular device that includes GPS, a sensor suite, and a rechargeable battery. This demo uses it as an asset tracker, caching GPS readings and uploading them to Golioth every few minutes.
But data is only useful if you can do something with it. We used the Grafana platform to visualize the data on a map interface. In fact, we have built up Grafana dashboards for all of the demos. It’s easy to make the data wow your customers with this interface. You can plot historical data using our REST API, and real-time data appears as soon as it’s received thanks to the open source Grafana plugin we wrote earlier this year.
Embedded World through Golioth’s eyes
Alas, only a small part of the IoT community will make it to Embedded World this year. Don’t worry, we’ll be posting video walkthroughs of our demos on our YouTube channel shortly after the conference. But don’t forget to follow us on Twitter as well, we’ll make sure to share the coolest things we see at the conference. And the offer to set up a chat is still good, even if it’s not in real life—the Developer Relations hotline is open!
