One of the most useful services in the Golioth Zephyr SDK is the ability to observe data changes on the cloud. A device can register any LightDB endpoint and the Golioth servers will notify it whenever changes happen. If your device is a door lock, an example endpoint might be “lock status”, which you would want to know about a server-side state change immediately.
This is slightly more complex to set up than something like a LightDB ‘Set’ API call. ‘Observe’ requires a callback function to handle the asynchronous reply from the Golioth servers. Today we’ll walk through how to add Golioth LightDB Observe functionality to any Zephyr application by:
- Adding a callback that is called every time observed data changes
- Registering the callback with a data endpoint
- Ensuring that
golioth_on_connectis registered with the Golioth client
These techniques are all found in our LightDB Observe sample code which acts as the roadmap for this article.
Prerequisites
Today’s post assumes that you already have a device running Zephyr and you have already tested out an app that uses the Golioth Zephyr SDK. If you’re not there yet, don’t worry. You can sign up for our free Dev Tier that includes up to 50 devices, and follow the Golioth Quickstart Guide.
Your Zephyr workspace should already have Golioth installed as a module and your app (probably in main.c) is already instantiating a Golioth system client. Basically, you should see a block like this one somewhere in your code:
#include <zephyr/net/coap.h>
#include <net/golioth/system_client.h>
static struct golioth_client *client = GOLIOTH_SYSTEM_CLIENT_GET();
If you don’t, checkout out our How to add Golioth to an existing Zephyr project blog post to get up to speed before moving on.
1. Add a callback function for observed data changes
The goal of this whole exercise is to enable your device to perform a task whenever data changes at your desired endpoint. Remember: Golioth LightDB endpoints are configurable by you! Whatever data you’d like to monitor, you can customize it to your needs.
The first thing we’ll do is create a callback function that will perform the task.
static int counter_handler(struct golioth_req_rsp *rsp)
{
    if (rsp->err) {
        LOG_ERR("Failed to receive counter value: %d", rsp->err);
        return rsp->err;
    }

    LOG_INF("Received: %.*s  Length: %d", rsp->len, rsp->data, rsp->len);

    return 0;
}
The callback receives an object (rsp) from Golioth containing the data, data length, and any error codes. The first portion of this callback checks the error code. Line 8 prints a log message that displays the data received, and it’s length.
If your endpoint contains more than just one value, it may be useful to parse the JSON object and store the values. Also keep in mind that this callback will execute on the golioth system client thread, which is a different thread than the “main” thread running your application. This means:
- The callback function should return quickly (under 10 ms). If that’s not enough time, you can use a Zephyr Workqueue to schedule the work on another thread.
- If access to global data is required, access to the data must be protected by a mutex to avoid data races between threads.
2. Registering the callback with a data endpoint
static void golioth_on_connect(struct golioth_client *client)
{
    int err = golioth_lightdb_observe_cb(client, "counter",
                     GOLIOTH_CONTENT_FORMAT_APP_JSON,
                     counter_handler, NULL);

    if (err) {
        LOG_WRN("failed to observe lightdb path: %d", err);
    }
}
Now we register the observation using the golioth_lightdb_observe_cb() API call. The parameters passed to this function include:
- The Golioth
clientobject - The endpoint to observe, “counter” in this case.
- The format, in this case we’ve chosen JSON. For CBOR, see the LightDB LED sample which demonstrates using CBOR serialization.
- The name of the callback function we created in the previous section
- An optional user_data value. This can be used to pass any 4-byte value which could be a discrete value, a pointer to some data structure, or
NULLif you don’t need it.
Notice that we’re registering the observe callback inside of a golioth_on_connect() function. This is recommended as the observation will be re-registered any time the the Golioth client connects. Without this, your device may miss observed changes if its internet connection becomes unstable. Observed data is sent to the device at the time a callback is registered, and each time the data changes on the Golioth cloud.
3. Add the processing function to on_message
This step is small but important, and seems to be the one I frequently forget and then scratch my head when my callback isn’t working.
Whenever a message is received from Golioth, the Golioth system client executes a callback that we usually call on_message. For our observed callbacks to work, we need to tell on_message about our coap_replies array.
static void golioth_on_message(struct golioth_client *client,
                   struct coap_packet *rx)
{
    /*
     * In order for the observe callback to be called,
     * we need to call this function.
     */
    coap_response_received(rx, NULL, coap_replies,
                   ARRAY_SIZE(coap_replies));
}
By calling Zephyr’s coap_response_received(), the CoAP packet will be parsed and the appropriate callback will be selected from the coap_replies struct (if one exists).
4. Ensuring that golioth_on_connect is registered with the Golioth client
The final step is to make sure that the oberseve callback is registered each time the Golioth system client connects.
client->on_connect = golioth_on_connect;
golioth_system_client_start();
This should be done in main() before the loop begins. The golioth_client struct should have already been instantiated in your code, in this example it was called client. The code above associates our callback function and starts the client running.
Observed data in action
Now that we’ve tied it all together, let’s test it out. Here’s the terminal output of my Zephyr app:
*** Booting Zephyr OS build zephyr-v3.2.0  ***


[00:00:00.878,000] <inf> golioth_system: Initializing
[00:00:00.878,000] <dbg> golioth_lightdb: main: Start LightDB observe sample
[00:00:00.878,000] <inf> golioth_samples: Waiting for interface to be up
[00:00:00.878,000] <inf> golioth_samples: Connecting to WiFi
uart:~$ Connected
[00:00:11.191,000] <inf> net_dhcpv4: Received: 192.168.1.159
[00:00:11.191,000] <inf> golioth_wifi: Connected with status: 0
[00:00:11.191,000] <inf> golioth_wifi: Successfully connected to WiFi
[00:00:11.191,000] <inf> golioth_system: Starting connect
[00:00:13.042,000] <inf> golioth_system: Client connected!
[00:00:13.857,000] <inf> golioth_lightdb: Received: null Length: 4
[00:00:29.526,000] <inf> golioth_lightdb: Received: 42 Length: 2
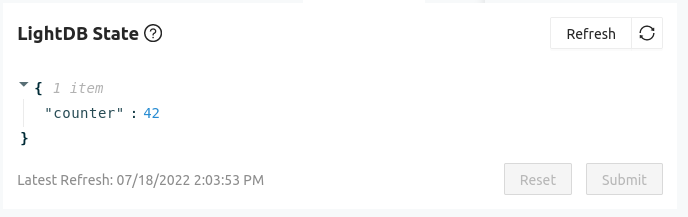
You can see that at boot time, the observed data will be reported, which is great for setting defaults when your device first connects to observed data. In the above example, the endpoint did existon the Golioth cloud when teh device registered so a payload of null (with length 4) was returned. About 16 seconds later a payload of 42 is received. That’s when I added the endpoint and value in the Golioth Console.
On the cloud, this is an integer, but the device receives payloads as strings. You’ll need to validate received data on the device side to ensure expected behavior in your callback functions (beyond simply printing out the payload as I’m doing here). Give it a try for yourself using our LightDB Observe sample code.
Observing LightDB data gives your devices the ability to react to any changes without the need to poll like you would if you were using the golioth_lightdb_get() function. In addition to being notified each time the data changes, you’ll also get the current state when the observation is first registered (ie: at power-up). Single endpoints, or entire JSON objects can be observed, making it possible to group different types of state data to suit any need.
If you still have questions, or want to talk about how LightDB Observe works under the hood, head over to the Golioth Forum or ping us on the Golioth Discord.
