In this article, we showcase how to use Wireshark–an open source, free network analysis tool–to troubleshoot wireless mesh networks set up using OpenThread, Zephyr, and Golioth. The tooling shown here can also be used for other Thread-based devices, assuming you understand the layers of the network. We used these tools internally to help us when get Thread devices to connect with Golioth and take advantage of all of the features we have to offer IoT device makers.
Building Thread Networks
Golioth started building out Thread networks when several users approached us about their interest in creating Golioth-managed Thread devices. We created example projects to show our users how to create mesh networks of custom low-power sensors and connect them back to the internet. We benefit from the fact that Thread network devices are IPv6 devices (thanks to 6LoWPAN), and that they talk over the CoAP protocol, all of which aligns very well with Golioth capabilities. We showed this in our most recent blog post about custom Thread nodes connecting through an OpenThread Border Router (OTBR) back to Golioth and transmitting information that can be displayed anywhere on the web.
Hardware and firmware engineers can utilize the Golioth Zephyr SDK to implement a wide range of features on Thread nodes and interact with those nodes like any other internet-connected device. In the Golioth Red Demo showcased at a number of recent live events, we had nodes that could report back sensor data and react to stimulus from the cloud; future versions could also get firmware updates directly from the cloud.
As in any hardware and firmware development process, things didn’t always go according to plan. When we were troubleshooting our early Proof of Concept, we needed to check which part of the chain was not passing packets along. We broke out Wireshark to start sniffing packets and figured out that there was a mismatch in the number of bytes being sent (since fixed). We think this kind of pinpoint accuracy in troubleshooting is a tool that all our users should have in their toolbox.
Good Security is meant to slow you down
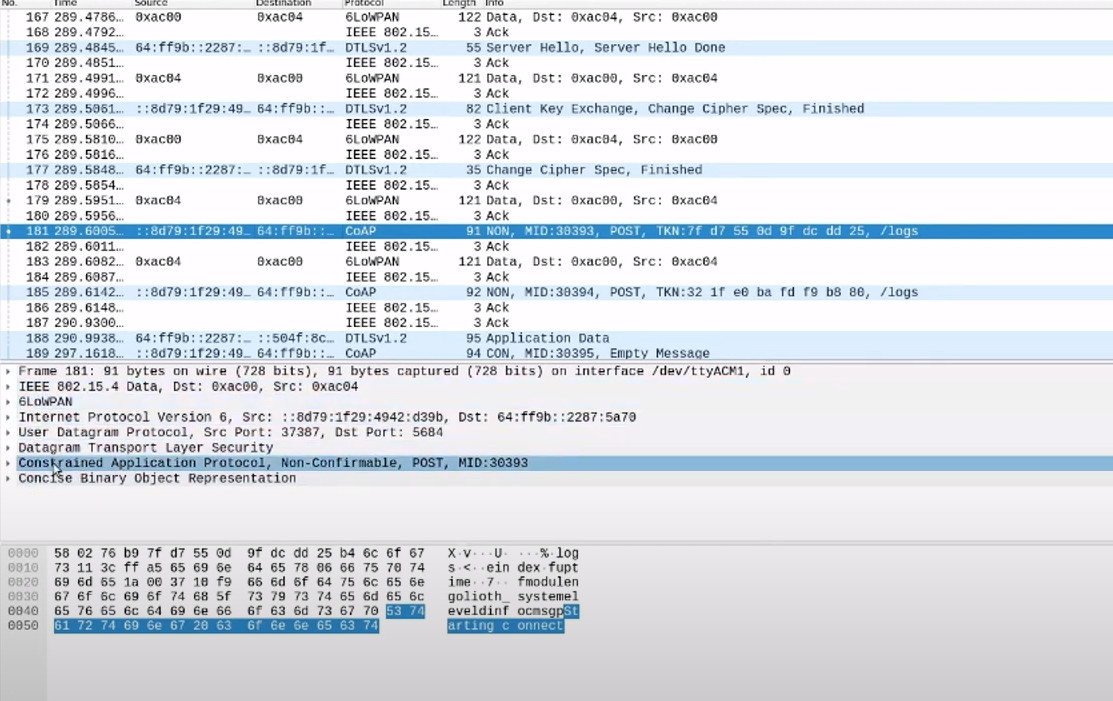
Golioth is secure by default, which means all packets going to our Cloud must be encrypted. Normally, this is a feature! You don’t want anyone with a packet sniffer to be able to see plain-text data. However, when you do want to see what’s inside a packet during troubleshooting, you need to make sure you have the keys to unlock everything. You also need to make sure you have the tools properly configured for the various layers involved in Thread networks. These will be the steps we review below and in the video.
Setting up a sniffer
In order to use Wireshark to troubleshoot a Thread network, you’ll need the following:
- An nRF52840 Dongle
- A computer running Wireshark
Pretty simple!
The first step is getting the tools onto the dongle. Much like the dongle was used as a Radio Co-Processor on the Open Thread Border Router, we’ll be using a different set of firmware to sniff radio packets and hand them over USB to the computer. This firmware is specific to 802.15.4, which is the Physical and MAC layer used by Thread. Download the firmware from Nordic Semiconductor and load it onto your dongle and you’re ready to go!
Next you need to be able to interact with the output of the dongle. This includes installing a python script in Wireshark that is located in the Nordic Semiconductor repository. Around the 2:15 mark in the video, Mike shows where and how to install this in Wireshark.
Configuration Settings
Other important parts of the video include things like:
- 3:45Choosing the correct 802.15.4 channel (channel 15 for most Golioth examples)
- 5:00Network settings for Wireshark to capture Thread network traffic
- 7:15Adding a Pre-Shared Key (PSK) to decrypt DTLS packets
Once those configuration steps are done, you can view wireless traffic coming from your Thread node, through each of the layers, up to the Golioth servers, onto specified endpoints like /logs. In the decoded payload area (bottom window), you can also see the messages that are actually being sent, in this example a log message saying “starting connect”.
Tools for when you need them
Wireshark and plugins developed by the community make for a powerful set of tools for troubleshooting network problems. We hope that our examples and tutorials allow you to quickly deploy a Thread network and build out custom Thread nodes; but when you need a bit more insight or are looking to try something new, Wireshark can help.
We’re here to help too! You can reach us on our Discord or Forum, and can always reach us at [email protected].
