“Internet of Things (IoT) Devices send sensor data back to the Cloud.” When I try to simplify the field of IoT for people outside the industry, that’s my go-to definition. There are, of course, other reasons to use IoT devices, but many IoT applications are about putting a sensor into the field and then taking action based on the sensor data.
At Golioth, we believe this means you need a very reliable way of reporting data back to your Cloud platform. We solve this with a feature called “LightDB Stream”. The feature is purpose built for collecting time-based data from devices in the field. In this article, we’re going to talk about how it works and how you can put it to use in your next project.
A world before LightDB Stream
In my pre-Golioth days, I didn’t think much beyond the process of getting sensor data off of the device. I knew I needed to send a reading like “temperature” to the Cloud, maybe to something like an MQTT broker. After that, it wasn’t really my concern…right?
The piece I didn’t understand was that an MQTT broker would not be enough. Brokers handle things like routing of data and allowing you to publish or subscribe (Pub/Sub) to data streams passing through the broker. The missing piece is that something needs to be “subscribed” to a particular device’s data stream to observe new readings and then registering that data into a database. Otherwise, the data inside the broker will expire, depending on the caching setting of the broker. If I want to look at data from 1 hour, 1 week, or 1 month ago, there’s no way to query that data without a database synchronized to the time it was reported.
As a hardware engineer, I don’t really understand databases or SQL queries, nor do I have much interest in learning it just to enable a temperature reading on the Cloud.
How Golioth solves theses problems
Golioth’s LightDB Stream collapses the problem down into one action: send data to the Golioth Cloud. As soon as that data hits our servers it is timestamped and placed into a database.
Using the Golioth Device SDK means you only need to understand the high level function to send data. Everything else happens “under the hood”: the SDK authenticates the device to the Cloud, ensures the data is correctly formatted, sends the data out to the endpoint, and uses error checking to ensure the data was sent properly.
Let’s look at how the high-level function calls are used when you build on top of Golioth SDKs
LightDB Stream using Zephyr RTOS
Your app will set the path to the LightDB Stream endpoint, telling the function that we’ll be sending JSON. You then send a string that has all of the information relevant to that endpoint (more on that below). The API includes both synchronous and asynchronous functions for sending data. The async functions include a callback function you can use for error checking (to ensure that the data was sent properly) and post processing. Check out the LightDB Stream Example on the Golioth Zephyr SDK.
err = golioth_stream_push_cb(client, "temp",
                 GOLIOTH_CONTENT_FORMAT_APP_JSON,
                 sbuf, strlen(sbuf),
                 temperature_push_handler, NULL);
LightDB Stream using ESP-IDF
Our ESP-IDF SDK has an even simpler implementation of writing to the LightDB Stream endpoint: it’s a single line.
If you want to try it yourself, check out the golioth_basicsexample in the Golioth ESP-IDF SDK. Line 190 of the file app_main.cis all you need to actually post integer data to the Cloud, in addition to the libraries included with the SDK.
// LightDB Stream functions are nearly identical to LightDB state.
golioth_lightdb_stream_set_int_async(client, "my_stream_int", 15, NULL, NULL);
LightDB Stream using your own solution
For the extra ambitious out there, you could roll your own device side code that allows you to connect to Golioth. This is the kind of work our wonderful firmware team does whenever they spin up a new SDK. Some of the required elements include:
- mbedtls in order to create a DTLS connection to the Golioth Cloud
- A CoAP library
- (optional) a CBOR library to encode the data
We hardly ever recommend doing this unless you are a very advanced user. Instead, our existing SDKs cover a wide swath of parts, ecosystems, and Real Time Operating Systems. If you are interested in one we don’t already cover, please let us know.
Customize data sent to LightDB Stream
Once you have the basic LightDB Stream setup done, you will want to customize the data you’re sending to best fit your IoT product’s needs.
Formatting data
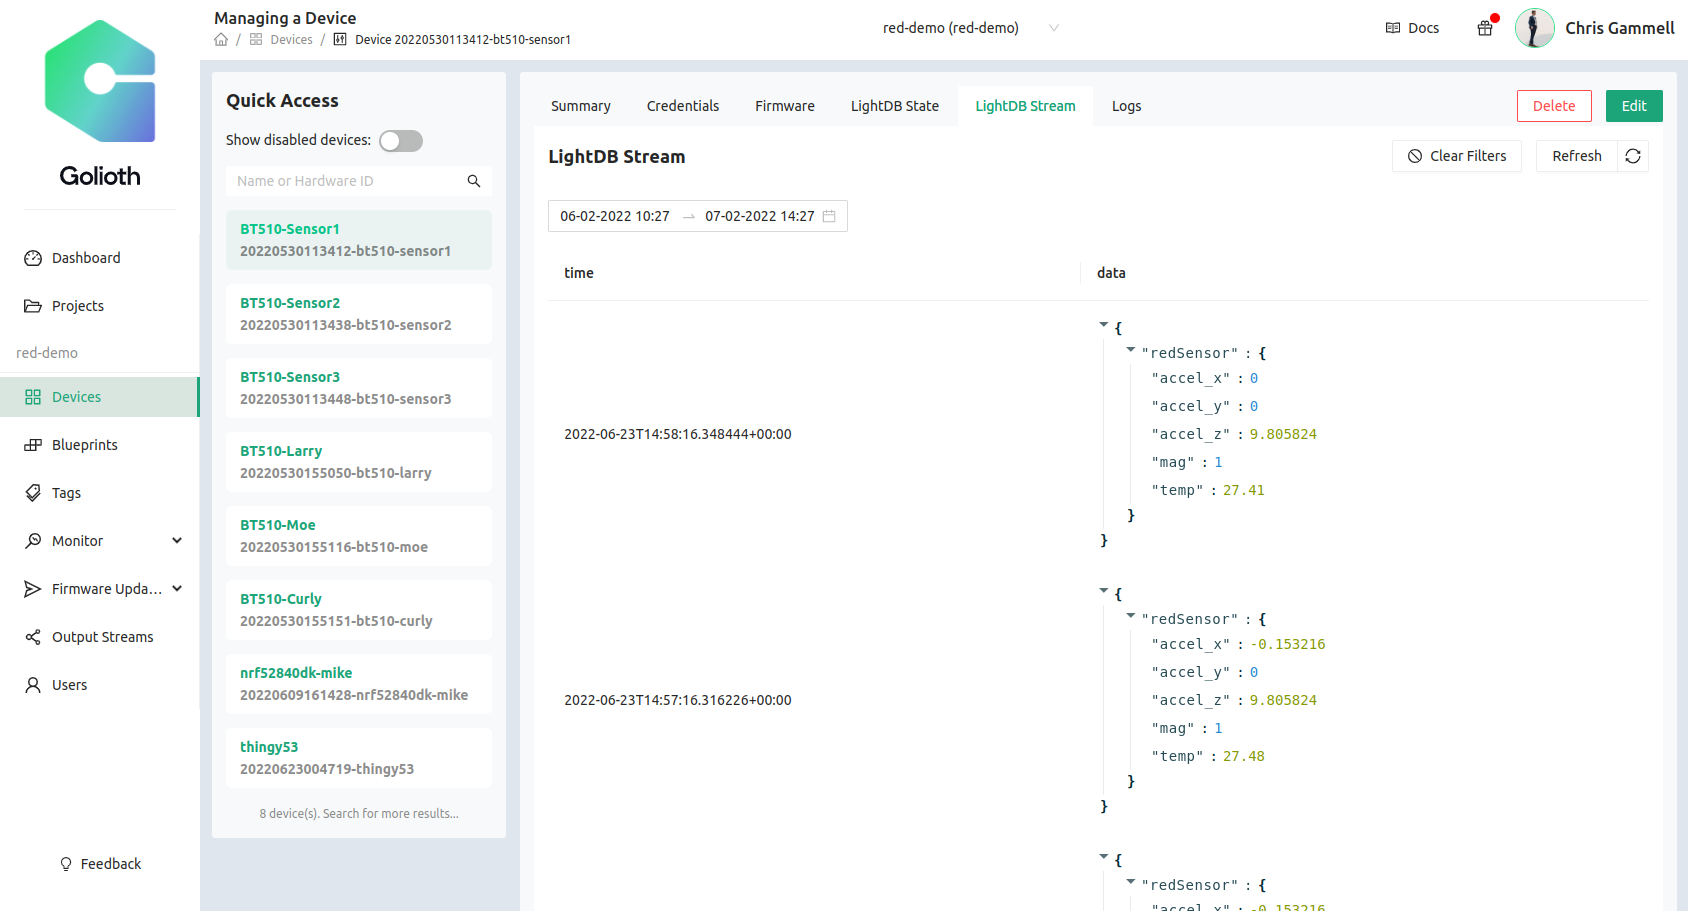
Another benefit of Golioth’s LightDB Stream, is the “flat” nature of the database implementation. Users are able to define their own data structure and change it on the fly. For instance, here is a JSON string from a recent example I was working on:
{"imu":"accel_x":-8.043840,"accel_y":0.114912,"accel_z":-4.711392,"orientation":"tipped"},"weather":{"temp":29.080000,"pressure":100.322167,"humidity":31.941406},"gas":{"co2":426.000000,"voc":3.000000},"distance":{"distance":1.548000,"prox":0.000000,"level":0.000000}}
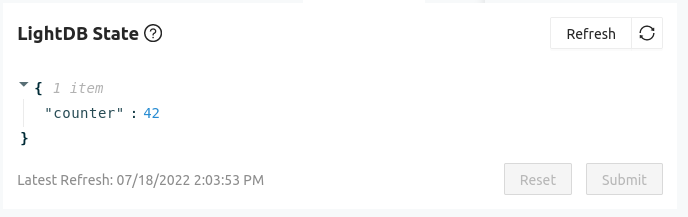
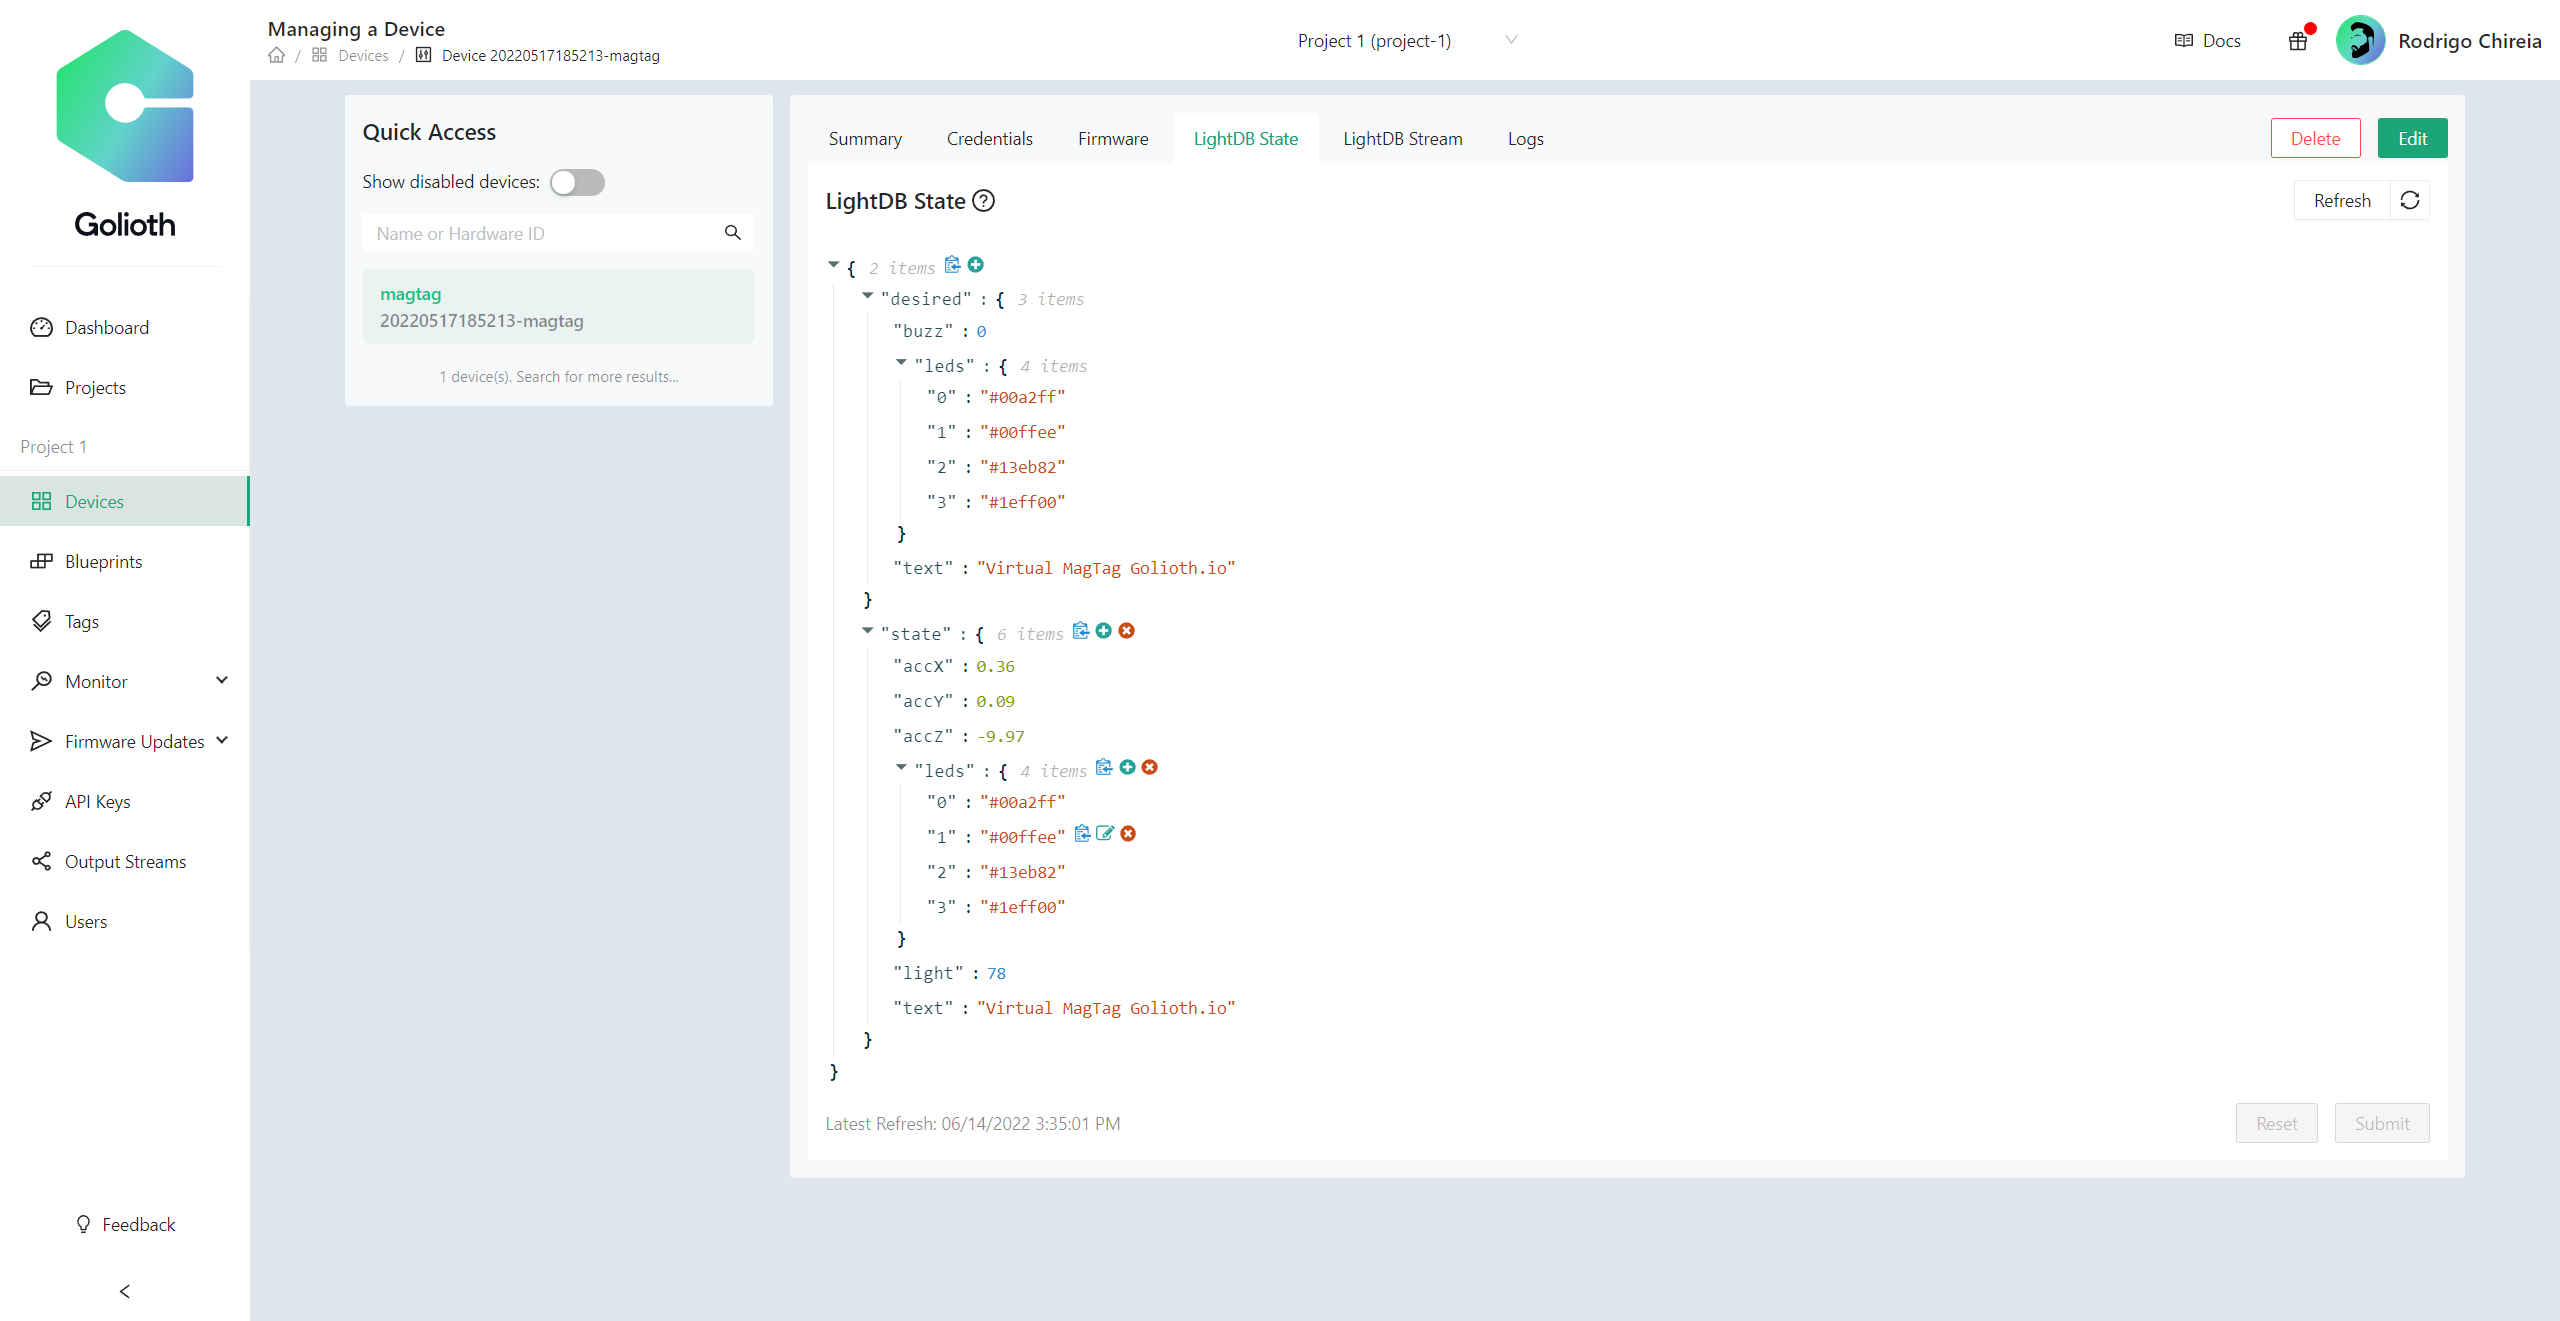
I am sending that formatted string from a device on a regular interval, with the various sensor readings inserted. Here is that same data in a more viewer friendly format on the LightDB Stream viewing page on the Golioth Console:
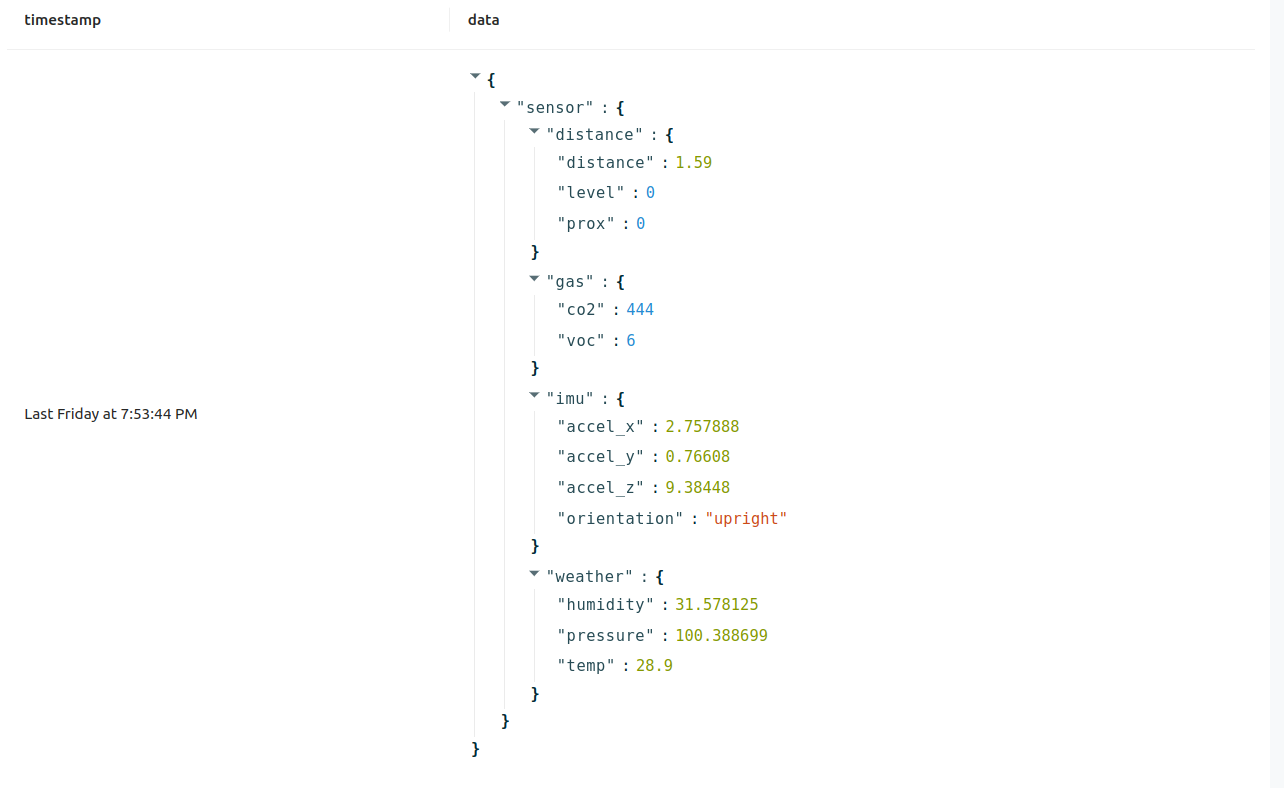
The structure of the JSON allows me to organize my data in a way that represents the various sensors on-board the device in the field. There are 4 sensors, represented by the 4 nested sets of data. Later, if I wanted to implement battery monitoring, I could start to send to a .s/battery endpoint (instead of the .s/sensor endpoint) without any changes required on the cloud side. Data would start appearing in the database seamlessly.
Adding timestamp
As I mentioned above, LightDB Stream automatically appends a timestamp when data is received at the Cloud endpoint. For most live devices, this works great: the time between when the device sends a packet and when it’s received on the Cloud is close enough that the datapoint mimics reality. But other times, this needs to be more precise. If my device is waking up for a sensor reading once per hour, but only sending data to the Cloud every 12 hours, those 12 readings being sent will all have the same timestamp and won’t represent reality.
Instead, we make it easy to append a local timestamp to any datapoint you’re sending to the Golioth Cloud. Just include a timestamp in your JSON packet and Golioth uses that field as the timestamp in the database.
We used this to great effect in our Orange Demo, which caches GPS readings and then sends them to the Cloud all at once. GPS also supplies a very accurate timestamp with each reading, making it easy to pass through to the Cloud. This way we can chart precise location, even when the sensor was out of network range for a period of time. We will discuss displaying LightDB Stream data in the next section.
Working with the output
The final piece of working with LightDB Stream is taking action on the data once it has successfully made it to the Cloud.
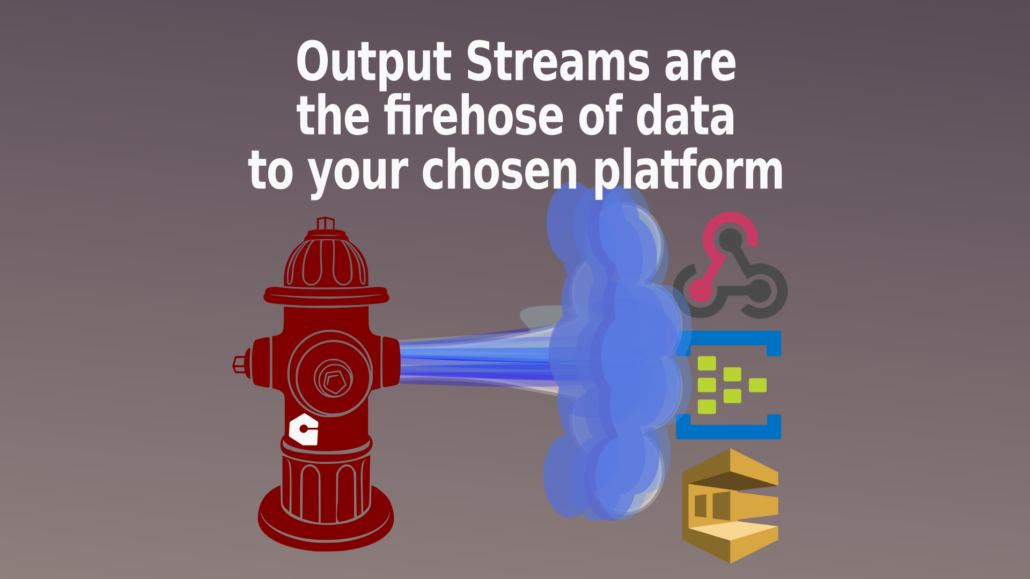
The most obvious approach is to use our Output Streams to send that data to a 3rd party platform like AWS SQS, Azure Event Hub, or Google Pub/Sub. These allow your Cloud teams to ingest data when they’re ready for it, and using Queues as the input mechanism ensures they won’t miss datapoints during high traffic times. In a more general use case, Webhooks allow users to export data in a similar manner to arbitrary visualization sites and other data ingestion engines.
It’s also possible to view the data directly using visualization platforms like Grafana. In this case, the visualization partner is actually querying the REST API (to gather data over a defined time period) or hooked into WebSockets (to get live data updates). This allows users to immediately view and take action on data.
Start using LightDB Stream Today!
All of our Device SDKs show how to use LightDB Stream with minimal code writing from the user. Just pass your sensor data up to Golioth and you’ll be on your way. Stop by our Forums, our Discord, or send us an email if you get stuck.


 Royalty free structured beams image source: https://pixabay.com/photos/structure-beams-engineering-839656/