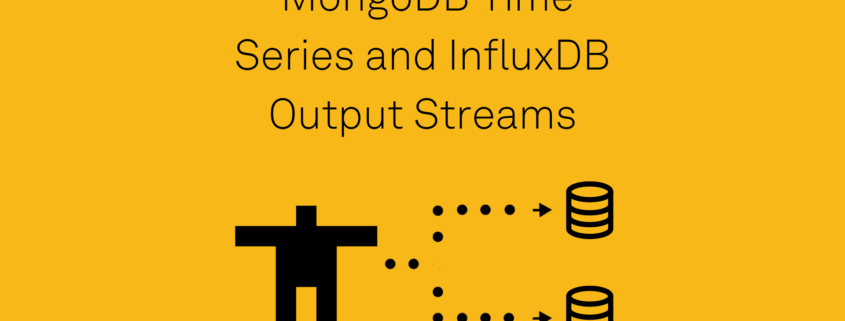
“Internet of Things (IoT) Devices send sensor data back to the Cloud.” When I try to simplify the field of IoT for people outside the industry, that’s my go-to definition. There are, of course, other reasons to use IoT devices, but many IoT applications are about putting a sensor into the field and then taking action based on the sensor data.

At Golioth, we believe this means you need a very reliable way of reporting data back to your Cloud platform. We solve this with a feature called “LightDB Stream”. The feature is purpose built for collecting time-based data from devices in the field. In this article, we’re going to talk about how it works and how you can put it to use in your next project.

A world before LightDB Stream

In my pre-Golioth days, I didn’t think much beyond the process of getting sensor data off of the device. I knew I needed to send a reading like “temperature” to the Cloud, maybe to something like an MQTT broker. After that, it wasn’t really my concern…right?

The piece I didn’t understand was that an MQTT broker would not be enough. Brokers handle things like routing of data and allowing you to publish or subscribe (Pub/Sub) to data streams passing through the broker. The missing piece is that something needs to be “subscribed” to a particular device’s data stream to observe new readings and then registering that data into a database. Otherwise, the data inside the broker will expire, depending on the caching setting of the broker. If I want to look at data from 1 hour, 1 week, or 1 month ago, there’s no way to query that data without a database synchronized to the time it was reported.

As a hardware engineer, I don’t really understand databases or SQL queries, nor do I have much interest in learning it just to enable a temperature reading on the Cloud.

How Golioth solves theses problems

Golioth’s LightDB Stream collapses the problem down into one action: send data to the Golioth Cloud. As soon as that data hits our servers it is timestamped and placed into a database.

Using the Golioth Device SDK means you only need to understand the high level function to send data. Everything else happens “under the hood”: the SDK authenticates the device to the Cloud, ensures the data is correctly formatted, sends the data out to the endpoint, and uses error checking to ensure the data was sent properly.

Let’s look at how the high-level function calls are used when you build on top of Golioth SDKs

LightDB Stream using Zephyr RTOS

Your app will set the path to the LightDB Stream endpoint, telling the function that we’ll be sending JSON. You then send a string that has all of the information relevant to that endpoint (more on that below). The API includes both synchronous and asynchronous functions for sending data. The async functions include a callback function you can use for error checking (to ensure that the data was sent properly) and post processing. Check out the LightDB Stream Example on the Golioth Zephyr SDK.

err = golioth_stream_push_cb(client, "temp",
                 GOLIOTH_CONTENT_FORMAT_APP_JSON,
                 sbuf, strlen(sbuf),
                 temperature_push_handler, NULL);
The Golioth Zephyr SDK also includes the option to send your sensor data using CBOR encoding. This is an alternative to JSON which serializes the data stream to a more compact form to save battery (less radio-on time) and bandwidth (fewer bits being transmitted).

LightDB Stream using ESP-IDF

Our ESP-IDF SDK has an even simpler implementation of writing to the LightDB Stream endpoint: it’s a single line.

If you want to try it yourself, check out the golioth_basicsexample in the Golioth ESP-IDF SDK. Line 190 of the file app_main.cis all you need to actually post integer data to the Cloud, in addition to the libraries included with the SDK.

// LightDB Stream functions are nearly identical to LightDB state.
golioth_lightdb_stream_set_int_async(client, "my_stream_int", 15, NULL, NULL);

LightDB Stream using your own solution

For the extra ambitious out there, you could roll your own device side code that allows you to connect to Golioth. This is the kind of work our wonderful firmware team does whenever they spin up a new SDK. Some of the required elements include:

  • mbedtls in order to create a DTLS connection to the Golioth Cloud
  • A CoAP library
  • (optional) a CBOR library to encode the data

We hardly ever recommend doing this unless you are a very advanced user. Instead, our existing SDKs cover a wide swath of parts, ecosystems, and Real Time Operating Systems. If you are interested in one we don’t already cover, please let us know.

Customize data sent to LightDB Stream

Once you have the basic LightDB Stream setup done, you will want to customize the data you’re sending to best fit your IoT product’s needs.

Formatting data

Another benefit of Golioth’s LightDB Stream, is the “flat” nature of the database implementation. Users are able to define their own data structure and change it on the fly. For instance, here is a JSON string from a recent example I was working on:

{"imu":"accel_x":-8.043840,"accel_y":0.114912,"accel_z":-4.711392,"orientation":"tipped"},"weather":{"temp":29.080000,"pressure":100.322167,"humidity":31.941406},"gas":{"co2":426.000000,"voc":3.000000},"distance":{"distance":1.548000,"prox":0.000000,"level":0.000000}}

I am sending that formatted string from a device on a regular interval, with the various sensor readings inserted. Here is that same data in a more viewer friendly format on the LightDB Stream viewing page on the Golioth Console:

The structure of the JSON allows me to organize my data in a way that represents the various sensors on-board the device in the field. There are 4 sensors, represented by the 4 nested sets of data. Later, if I wanted to implement battery monitoring, I could start to send to a .s/battery endpoint (instead of the .s/sensor endpoint) without any changes required on the cloud side. Data would start appearing in the database seamlessly.

Adding timestamp

As I mentioned above, LightDB Stream automatically appends a timestamp when data is received at the Cloud endpoint. For most live devices, this works great: the time between when the device sends a packet and when it’s received on the Cloud is close enough that the datapoint mimics reality. But other times, this needs to be more precise. If my device is waking up for a sensor reading once per hour, but only sending data to the Cloud every 12 hours, those 12 readings being sent will all have the same timestamp and won’t represent reality.

Instead, we make it easy to append a local timestamp to any datapoint you’re sending to the Golioth Cloud. Just include a timestamp in your JSON packet and Golioth uses that field as the timestamp in the database.

We used this to great effect in our Orange Demo, which caches GPS readings and then sends them to the Cloud all at once. GPS also supplies a very accurate timestamp with each reading, making it easy to pass through to the Cloud. This way we can chart precise location, even when the sensor was out of network range for a period of time. We will discuss displaying LightDB Stream data in the next section.

Working with the output

The final piece of working with LightDB Stream is taking action on the data once it has successfully made it to the Cloud.

The most obvious approach is to use our Output Streams to send that data to a 3rd party platform like AWS SQS, Azure Event Hub, or Google Pub/Sub. These allow your Cloud teams to ingest data when they’re ready for it, and using Queues as the input mechanism ensures they won’t miss datapoints during high traffic times. In a more general use case, Webhooks allow users to export data in a similar manner to arbitrary visualization sites and other data ingestion engines.

It’s also possible to view the data directly using visualization platforms like Grafana. In this case, the visualization partner is actually querying the REST API (to gather data over a defined time period) or hooked into WebSockets (to get live data updates). This allows users to immediately view and take action on data.

Start using LightDB Stream Today!

All of our Device SDKs show how to use LightDB Stream with minimal code writing from the user. Just pass your sensor data up to Golioth and you’ll be on your way. Stop by our Forums, our Discord, or send us an email if you get stuck.

Building IoT systems is always a push and pull to find the balance between designs that are very rigid in their definition (hard to change later) and overly generalized (less useful for everyday development). Golioth Blueprints are a new concept which apply structure to the relationship between the Cloud and the Device. Blueprints enable more useful features throughout the life of an IoT deployment. In this post we’re going to talk about what a Blueprint is, and how it is used throughout Golioth to enhance capabilities for our users.

Flexibility is a blessing and curse

Golioth works on a wide range of hardware. That’s the blessing. We think it’s really important to meet hardware and firmware teams where they are. If a client requirement or a sourcing issue pushes you into a particular chipset + communication method, we want to support you. That’s why we have multiple SDKs, each of which can pull in a wide range of parts.

But when you “can do anything”, that means nothing is standardized. Data coming in from a temperature sensor is treated the same as data coming in from a motor controller. Firmware updates being deployed to a device in the field running on a Cortex-M7 can also be pushed to a device running on a Cortex-M0 (hardware tip: these are very different). So the curse is that the exercise of separating and protecting all of that data is left up to you. Your Cloud team might only want a piece of data or a variable, but the implications of a mistake in your data design could be severe for your very real hardware deployment.

As you’ll see below, Blueprints will help bridge the communication between the embedded team and the Cloud team. They add information that would normally be hidden somewhere, maybe in a hardware datasheet or an engineering team specification document. Like real blueprints, Golioth Blueprints help to map out how things should be built.

Why are Blueprints needed?

To put an even finer point on the topic of Blueprints, let’s discuss a real-world example. Imagine an environmental monitoring product that has the following in its Rev A version of hardware:

  • nRF9160 cellular SIP from Nordic Semiconductor (running dual Cortex-M33 processors)
  • BMP280 temperature/environmental sensor
  • 4 MB external SPI flash
  • Other supporting components

Due to sourcing issues, you can no longer get any of these parts. Yep, it’s that bad out there. Your Rev B (because you need to ship something to your customers) now has:

  • An nRF52840 processor (single core Cortex-M4)
  • A BG95 cellular modem
  • BMP680 environmental sensor
  • 8 MB of external SPI flash

In the Golioth NCS SDK, the coding differences are minimal, despite pretty extreme changes in the hardware. However, thanks to how Zephyr RTOS is set up, it will be a set of configuration files instead of completely rewriting the codebase.

This is standard fare during the chip shortage, which we wrote about last week. Some companies are taking extreme steps like this in order to continue shipping their products, basically supporting two divergent product lines that can achieve the same goals. The key point is that the software team/end customer/consumer of the data via your company’s app probably doesn’t care how the data gets from the physical world to the digital world, they just want the variables they’re looking at (ie. temperature) to be accurate.

Now that we have pretty different Rev A and Rev B boards, how do we keep everything straight when we’re maintaining these products?

Enter the Golioth Blueprint

Golioth Blueprint management menu on the Golioth Console

The Golioth Blueprint is a description of all of the relevant things on target devices. As the Blueprint continues to mature in the coming months and years, we will evolve the types of data stored in the Blueprint. For now, we lean on board definitions that are in Zephyr. For the above screenshot, you can see that we are using the Sparkfun Thing Plus nRF9160 (based on the CircuitDojo nRF9160 Feather), which is indexed on the Zephyr website and in the Zephyr/NCS codebase.

From the meta data provided by Zephyr, we can pull in things like the target chipset, memory amount, how it’s mapped, peripherals that are available, and even external sensors that are on board (an accelerometer). If you have your own board definition upstream in Zephyr, you would also see that in the Golioth Blueprint list. We are working on other ways to pull in formatted metadata around customized boards that might need to stay private. If you’re interested in that, please email us.

If you don’t have a Blueprint, say because you’re using our ESP-IDF SDK instead of Zephyr, or a completely different platform, that’s OK too. You can assign a placeholder Blueprint name to help delineate between your different hardware builds. Generally, you are not required to use a Blueprint when you are on the Golioth Console, but there are many benefits to doing so. Let’s look at some.

Over-the-Air Firmware Update

Golioth users can assign a Blueprint to their firmware updates:

Doing so means that the Firmware Release will only target a specific subset of devices. If we go back to the example above, this could be critical when the target devices have completely different processors on board; firmware built for an nRF9160 will not work on an nRF52840! Attaching a Blueprint, even without attaching additional meta information (from Zephyr board files) still allows you to track which devices are receiving updates. Memory structure information will be used for future releases, being able to target different artifacts to different segments of memory.

Settings

Our recently released Settings service uses Blueprints to deliver different settings to different devices. As a reminder, settings can apply on the following levels:

  • Project
  • Blueprint
  • Individual device

To use our example from above, you might want to have different setting when different sensors attached to your device. You could set something like “UPDATE RATE” for the project to be every 30 seconds, but maybe you want to have the Rev A boards report in twice as often because you want to average the readings on the Cloud.

If you click into a Device Management page (looking at a specific device), you will see how the settings are being applied by Project, Blueprint, or on that specific device.

Future plans for structured data

We are currently very flexible on the sensor data you are sending back over LightDB State and LightDB Stream. In the future, we hope to be able to extract sensor data from your Blueprint to have our Cloud intuitively understand the types of data that is received from your fleet. Users will benefit from being able to chart data and export to other platforms knowing that a reading is a temperature or another fixed type of reading.

Using Blueprints effectively for your next project

Golioth Blueprints are an enhancement that allows our users to keep track of the hardware they are communicating with in the field. As users’ fleets and number of SKUs grow, this will be a critical aspect to any device management platform.

Try out Golioth Blueprints today on the Golioth Console. If you need any help or would like to discuss the idea more, we have a forum, a Discord, and we can be reached at [email protected].

Today we’re announcing a new feature on the Golioth Console and on our Device SDKs that enables Remote Procedure Calls (RPCs) for all users on the platform. From the cloud, you can initiate a function on your constrained device in the field, ensure the device received and executed the command, and receive a response from the device back to the Cloud.

What is a Remote Procedure Call (RPC)?

A Remote Procedure Call allows you to call a function on a remote computing device and optionally receive a result. An easy way to think about it is you’re calling a function, like you would in any other program…you’re just doing it from another computer. In this case, you’re triggering actions from the Golioth Cloud.

RPC from the Golioth Cloud (Console)

Each device in your project has a page where you can view details about things like LightDB State, LightDB Stream, Settings, and now RPC. Our Console includes an interface to directly send RPCs to the remote device. The URL will look something like:

https://console.golioth.io/devices/<YOUR_DEVICE_ID>/management/rpc

In all of our examples, we are sending an RPC to single devices. However, they can also be triggered from the REST API. As a reminder, any function you see on the Golioth Console is available on the REST API.

One critical function of RPCs is a confirmation that the remote function has actually run. The device firmware needs to send back a success message that the function has completed, and optionally a returned value. When there is a problem connecting with your device and the RPC does not complete successfully, you will see a screen that looks like this:

An RPC sent to a device that was disconnected from Wi-Fi

Also note that round trip time is measured for all RPCs, including successful ones. Transit times will depend upon your connectivity medium, in addition to the processing time of the function on the remote device.

When an RPC successfully completes, you can click the button with 3 dots to receive the returned value. In the example and in the video, we were using a method called double that takes an integer input, multiplies it by two, and then returns the value to the Cloud. Below, you can see the result when we sent “double” method with a parameter of “37”.

RPC from the Device SDK perspective

Any new feature on Golioth has Device SDK support, in addition to the new APIs and UIs on our Web Console. Earlier this week, Nick wrote about how we test hardware and firmware at Golioth, especially when a new feature is released across the platform. Now that we support 3 SDKs (Zephyr, NCS, ESP-IDF), the testing area has increased.

In the video, the focus is on ESP-IDF, which has a simple way to set up and respond to new RPCs. First, we register the new method, so we’ll recognize the command coming from the Golioth Cloud:

The function that we tie to that newly registered RPC needs to return the RPC_OK variable for the Cloud to be alerted that the function has processed properly.

If you have satisfied these requirements in the ESP-IDF SDK and copied the format, you can customize logic to do whatever task you’d like on the remote device. Let’s look at some examples.

Use cases for an RPC

The double() example is a simple showcase of the minimum requirements to create an RPC in the ESP-IDF SDK. We send a command and a value, we return a modified value.

The remote_reset command we created and showcased in the video is more like a critical function you would want to add to your project. When you want to trigger a remote function like a reset, you want to ensure that the command was properly received, that the function executed, and then that there was output data that validated the reset has happened. In the final point, that includes inferring that the device has restarted from the log messages also being sent back to the Golioth Console. Put all together, it’s a reliable way to tell the device has been reset.

Other use cases could be as simple as sending arbitrary text to a display. You would still want to know the text has been received and properly sent to the physical display. Or perhaps you have a valve and you want to be able to send an arbitrary value to the valve, but you also want to take a reading on an encoder that measures the distance the valve has moved.

Many of these functions could also be achieved with LightDB State (which the RPC service is built upon), but the context for creating an RPC is more targeted at situations like the examples above.

What will you build?

RPCs are another way for you to communicate with your constrained IoT devices from the Golioth Cloud and to get useful information back from your devices. You can start testing out this feature today.

For more questions or assistance, check out our Forums, our Discord, or drop us a note at [email protected].


Golioth just rolled out a new settings service that lets you control your growing fleet of IoT devices. You can specify settings for your entire fleet, and override those global settings by individual device or for multiple devices that share the same blueprint.

Every IoT project needs some type of settings feature, from adjusting log levels and configuring the delay between sensor readings, to adjusting how frequently a cellular connection is used in order to conserve power. With the new settings service, the work is already done for you. A single settings change on the Golioth web console is applied to all devices listening for changes!

As you grow from dozens of devices to hundreds (and beyond), the Golioth settings service makes sure you can change device settings and confirm that those changes were received.

Demonstrating the settings service

Golioth settings service

The settings service is ready for you use right now. We have code samples for the Golioth Zephyr SDK and the Golioth ESP-IDF SDK. Let’s take it for a spin using the Zephyr samples.

I’ve compiled and flashed the Golioth Settings sample for an ESP32 device. It observes a LOOP_DELAY_S endpoint and uses that value to decide how long to wait before sending another “Hello” log message.

Project-wide settings

On the Golioth web console, I use the Device Settings option on the left sidebar to create the key/value pair for this setting. This is available to all devices in the project with firmware that is set up to observe the LOOP_DELAY_S settings endpoint.

Golioth device settings dialog

When viewing device logs, we can see the setting is observed as soon as the device connects to Golioth. The result is that the Hello messages are now issued ten seconds apart.

[00:00:19.930,000] <inf> golioth_system: Client connected!
[00:00:20.340,000] <inf> golioth: Payload
                                  a2 67 76 65 72 73 69 6f  6e 1a 62 e9 99 c4 68 73 |.gversio n.b...hs
                                  65 74 74 69 6e 67 73 a1  6c 4c 4f 4f 50 5f 44 45 |ettings. lLOOP_DE
                                  4c 41 59 5f 53 fb 40 24  00 00 00 00 00 00       |LAY_S.@$ ......  
[00:00:20.341,000] <dbg> golioth_hello: on_setting: Received setting: key = LOOP_DELAY_S, type = 2
[00:00:20.341,000] <inf> golioth_hello: Set loop delay to 10 seconds
[00:00:20.390,000] <inf> golioth_hello: Sending hello! 2
[00:00:30.391,000] <inf> golioth_hello: Sending hello! 3
[00:00:40.393,000] <inf> golioth_hello: Sending hello! 4

Settings by device or by blueprint

Of course, you don’t always want to have the same settings for all devices. Consider debugging a single device. It doesn’t make much sense to turn up the logging level or frequency of sensor reads for all devices. So with Golioth it’s easy to change the setting on just a single device.

settings change for a single device on the Golioth console

In the device view of the Golioth web console there is a settings tab. Here you can see the key, the value, and the level of the value. I have already changed the device-specific value in this screen so the level is being reported as “Device”.

[00:07:30.466,000] <inf> golioth_hello: Sending hello! 45
[00:07:40.468,000] <inf> golioth_hello: Sending hello! 46
[00:07:43.728,000] <inf> golioth: Payload
                                  a2 67 76 65 72 73 69 6f  6e 1a 62 e9 9c 17 68 73 |.gversio n.b...hs
                                  65 74 74 69 6e 67 73 a1  6c 4c 4f 4f 50 5f 44 45 |ettings. lLOOP_DE
                                  4c 41 59 5f 53 fb 40 00  00 00 00 00 00 00       |LAY_S.@. ......  
[00:07:43.729,000] <dbg> golioth_hello: on_setting: Received setting: key = LOOP_DELAY_S, type = 2
[00:07:43.729,000] <inf> golioth_hello: Set loop delay to 2 seconds
[00:07:50.469,000] <inf> golioth_hello: Sending hello! 47
[00:07:52.471,000] <inf> golioth_hello: Sending hello! 48

When I made the change. the device was immediately notified and you can see from the timestamps that it began logging at a two-second cadence as expected.

Golioth settings applied at the blueprint level

It is also possible to change settings for a group of devices that share a common blueprint. Here you will find this setting by selecting Blueprint from the left sidebar and choosing your desired blueprint.

Settings are applied based on specificity. The device-level is the most specific and will be applied first, followed by blueprint-level, and finally project-level. Blueprints may be created and applied at any time, so if you later realize you need a more specific group you can change the blueprint for those devices.

Implementation: The two parts that make up the settings service

Fundamentally, there are two parts that make our device settings system work: the Golioth cloud services running on our servers and your firmware that is running on the devices. The Golioth device SDKs allow you to register a callback function that receives settings values each time a change is made to the settings on the cloud. You choose how the device should react to these settings, like updating a delay value, enabling/disabling features, changing log output levels, really anything you want to do.

Don’t worry if you already have devices in the field. You can add the settings service or make changes to how your device handles those settings, then use the Golioth OTA firmware update system to push out the new behavior.

Take control of your fleet

Scale is the hope for most IoT companies, but it’s also where the pain of IoT happens. You need to know you can control your devices, securely communicate with them, and perform updates as necessary. Golioth has you covered in all of these areas. The new settings service ensures that your ability to change how your fleet is performing doesn’t become outpaced by your growth.

On Tuesday we announced the Golioth ESP-IDF SDK that delivers all of Golioth’s excellent features to ESP32 projects built on Espressif’s FreeRTOS-based ESP-IDF ecosystem. The APIs included in our SDK make it dead simple to set up an encrypted connection with Golioth and begin sending and receiving data, controlling the device remotely, sending your logging messages up to the cloud, and of course performing Over-the-Air (OTA) updates on remote devices.

Today we dive into the code as Nick Miller, Golioth’s lead firmware engineer, takes us on a guided tour.

What does Golioth ESP-IDF SDK deliver?

All of the best features of Golioth’s device management cloud are available in our ESP-IDF SDK. The set of APIs are quite clever and take all of the heavy lift out of your hands. This includes:

  • Set, get, and observe data endpoints on the cloud
  • Write log data back to the cloud
  • Handle Over-the-Air (OTA) firmware updates
  • API calls–in both synchronous and asynchronous options–to suit your needs

Setup: Install ESP-IDF and clone the Golioth repo

To get started you need have the ESP-IDF installed and clone the Golioth ESP-IDF SDK. Instructions are available in the readme of our git repository, and there is also a quickstart on our docs site.

Our new SDK is a component for FreeRTOS, the real-time operating system used by the ESP-IDF. It’s the same operating system and build tools you’re used to, with the Golioth SDK sitting on top so that your devices can interact with the Golioth servers.

Stepping through the Golioth-Basics example

The best way to test-drive is with the Golioth-Basics example that is included in the SDK. It demonstrates assigning Golioth credentials to your device, sending/receiving data, observing data, sending log messages, and performing over-the-air (OTA) firmware updates. The golioth_basics.c file is thoroughly commented to explain each API call in detail.

The example begins by initializing non-volatile storage, configuring a serial shell, checking for credentials, and connecting to WiFi. At that point we can start using the Golioth APIs.

Creating the Golioth system client

// Now we are ready to connect to the Golioth cloud.
//
// To start, we need to create a client. The function golioth_client_create will
// dynamically create a client and return a handle to it.
//
// The client itself runs in a separate task, so once this function returns,
// there will be a new task running in the background.
//
// As soon as the task starts, it will try to connect to Golioth using the
// CoAP protocol over DTLS, with the PSK ID and PSK for authentication.
golioth_client_t client =
        golioth_client_create(nvs_read_golioth_psk_id(), nvs_read_golioth_psk());

Everything starts of by instantiating a client to handle the connection for you. This client will be passed to all of the API calls so that the SDK knows where to send them.

Sending log messages

// We can also log messages "synchronously", meaning the function will block
// until one of 3 things happen (whichever comes first):
//
// 1. We receive a response to the request from the server
// 2. The user-provided timeout expires
// 3. The default client task timeout expires (GOLIOTH_COAP_RESPONSE_TIMEOUT_S)
//
// In this case, we will block for up to 2 seconds waiting for the server response.
// We'll check the return code to know whether a timeout happened.
//
// Any function provided by this SDK ending in _sync will have the same meaning.
golioth_status_t status = golioth_log_warn_sync(client, "app_main", "Sync log", 5);

Here you can see a log being written to Golioth. Notice that the client created in the previous code block is used as the first parameter. This logging call is synchronous, and will wait to ensure the log was received by the Golioth servers. There is also an asynchronous version available that provides the option to run a callback function when the log is received by Golioth.

Setting up OTA firmware updates

// For OTA, we will spawn a background task that will listen for firmware
// updates from Golioth and automatically update firmware on the device using
// Espressif's OTA library.
//
// This is optional, but most real applications will probably want to use this.
golioth_fw_update_init(client, _current_version);

OTA firmware updates are handled for you by the SDK. The line of code shown here is all it takes to register for updates. The app will then observe the firmware version available on the server. It will automatically begin the update process whenever you roll out a new firmware release on the Golioth Cloud.

Sending and receiving data

// There are a number of different functions you can call to get and set values in
// LightDB state, based on the type of value (e.g. int, bool, float, string, JSON).
golioth_lightdb_set_int_async(client, "my_int", 42, NULL, NULL);
// To asynchronously get a value from LightDB, a callback function must be provided
golioth_lightdb_get_async(client, "my_int", on_get_my_int, NULL);

The bread and butter of the IoT industry is the ability to send and received data. This code demonstrates asynchronous set and get functions. Notice that the get API call registers on_get_my_int as a callback function that will be executed to handle the data that arrives back from the Golioth servers.

A get command runs just once to fetch the requested data from Golioth. Another extremely useful approach is to observe the data using the golioth_lightdb_observe_async(). It works the same way as an asynchronous get call, but it will execute your callback every time the data on the server changes.

Putting it all together

In the second half of the video, Nick takes us through the process running the demo. He starts with setting up the ESP-IDF environment and compiling to code, and continues all the way through to viewing the device data on the web console.

You’re going to love working with the Golioth ESP-IDF SDK. It’s designed to deal with all the complexity of securely connecting and controlling your IoT devices. The API calls are easy to understand, and they make it painless to add Golioth to existing and future ESP-IDF based projects. Give it a try today using our free Dev Tier.

We’d love to hear what you’re planning to build. You can connect with us on the Golioth Discord server, ask questions over on the Golioth Forums, and share your demos by tagging the Golioth account on Twitter.

One of the most useful services in the Golioth Zephyr SDK is the ability to observe data changes on the cloud. A device can register any LightDB endpoint and the Golioth servers will notify it whenever changes happen. If your device is a door lock, an example endpoint might be “lock status”, which you would want to know about a server-side state change immediately.

This is slightly more complex to set up than something like a LightDB ‘Set’ API call. ‘Observe’ requires a callback function to handle the asynchronous reply from the Golioth servers. Today we’ll walk through how to add Golioth LightDB Observe functionality to any Zephyr application by:

  1. Adding a callback that is called every time observed data changes
  2. Registering the callback with a data endpoint
  3. Ensuring thatgolioth_on_connect is registered with the Golioth client

These techniques are all found in our LightDB Observe sample code which acts as the roadmap for this article.

Prerequisites

Today’s post assumes that you already have a device running Zephyr and you have already tested out an app that uses the Golioth Zephyr SDK. If you’re not there yet, don’t worry. You can sign up for our free Dev Tier that includes up to 50 devices, and follow the Golioth Quickstart Guide.

Your Zephyr workspace should already have Golioth installed as a module and your app (probably in main.c) is already instantiating a Golioth system client. Basically, you should see a block like this one somewhere in your code:

#include <zephyr/net/coap.h>
#include <net/golioth/system_client.h>
static struct golioth_client *client = GOLIOTH_SYSTEM_CLIENT_GET();

If you don’t, checkout out our How to add Golioth to an existing Zephyr project blog post to get up to speed before moving on.

1. Add a callback function for observed data changes

The goal of this whole exercise is to enable your device to perform a task whenever data changes at your desired endpoint. Remember: Golioth LightDB endpoints are configurable by you! Whatever data you’d like to monitor, you can customize it to your needs.

The first thing we’ll do is create a callback function that will perform the task.

static int counter_handler(struct golioth_req_rsp *rsp)
{
    if (rsp->err) {
        LOG_ERR("Failed to receive counter value: %d", rsp->err);
        return rsp->err;
    }

    LOG_INF("Received: %.*s  Length: %d", rsp->len, rsp->data, rsp->len);

    return 0;
}

The callback receives an object (rsp) from Golioth containing the data, data length, and any error codes. The first portion of this callback checks the error code. Line 8 prints a log message that displays the data received, and it’s length.

If your endpoint contains more than just one value, it may be useful to parse the JSON object and store the values. Also keep in mind that this callback will execute on the golioth system client thread, which is a different thread than the “main” thread running your application. This means:

  • The callback function should return quickly (under 10 ms). If that’s not enough time, you can use a Zephyr Workqueue to schedule the work on another thread.
  • If access to global data is required, access to the data must be protected by a mutex to avoid data races between threads.

2. Registering the callback with a data endpoint

static void golioth_on_connect(struct golioth_client *client)
{
    int err = golioth_lightdb_observe_cb(client, "counter",
                     GOLIOTH_CONTENT_FORMAT_APP_JSON,
                     counter_handler, NULL);

    if (err) {
        LOG_WRN("failed to observe lightdb path: %d", err);
    }
}

Now we register the observation using the golioth_lightdb_observe_cb() API call. The parameters passed to this function include:

  1. The Golioth client object
  2. The endpoint to observe, “counter” in this case.
  3. The format, in this case we’ve chosen JSON. For CBOR, see the LightDB LED sample which demonstrates using CBOR serialization.
  4. The name of the callback function we created in the previous section
  5. An optional user_data value. This can be used to pass any 4-byte value which could be a discrete value, a pointer to some data structure, or NULL if you don’t need it.

Notice that we’re registering the observe callback inside of a golioth_on_connect() function. This is recommended as the observation will be re-registered any time the the Golioth client connects. Without this, your device may miss observed changes if its internet connection becomes unstable. Observed data is sent to the device at the time a callback is registered, and each time the data changes on the Golioth cloud.

3. Add the processing function to on_message

This step is small but important, and seems to be the one I frequently forget and then scratch my head when my callback isn’t working.

Whenever a message is received from Golioth, the Golioth system client executes a callback that we usually call on_message. For our observed callbacks to work, we need to tell on_message about our coap_replies array.

static void golioth_on_message(struct golioth_client *client,
                   struct coap_packet *rx)
{
    /*
     * In order for the observe callback to be called,
     * we need to call this function.
     */
    coap_response_received(rx, NULL, coap_replies,
                   ARRAY_SIZE(coap_replies));
}


By calling Zephyr’s coap_response_received(), the CoAP packet will be parsed and the appropriate callback will be selected from the coap_replies struct (if one exists).

4. Ensuring that golioth_on_connect is registered with the Golioth client

The final step is to make sure that the oberseve callback is registered each time the Golioth system client connects.

client->on_connect = golioth_on_connect;
golioth_system_client_start();

This should be done in main() before the loop begins. The golioth_client struct should have already been instantiated in your code, in this example it was called client. The code above associates our callback function and starts the client running.

Observed data in action

Now that we’ve tied it all together, let’s test it out. Here’s the terminal output of my Zephyr app:

*** Booting Zephyr OS build zephyr-v3.2.0  ***


[00:00:00.878,000] <inf> golioth_system: Initializing
[00:00:00.878,000] <dbg> golioth_lightdb: main: Start LightDB observe sample
[00:00:00.878,000] <inf> golioth_samples: Waiting for interface to be up
[00:00:00.878,000] <inf> golioth_samples: Connecting to WiFi
uart:~$ Connected
[00:00:11.191,000] <inf> net_dhcpv4: Received: 192.168.1.159
[00:00:11.191,000] <inf> golioth_wifi: Connected with status: 0
[00:00:11.191,000] <inf> golioth_wifi: Successfully connected to WiFi
[00:00:11.191,000] <inf> golioth_system: Starting connect
[00:00:13.042,000] <inf> golioth_system: Client connected!
[00:00:13.857,000] <inf> golioth_lightdb: Received: null Length: 4
[00:00:29.526,000] <inf> golioth_lightdb: Received: 42 Length: 2

You can see that at boot time, the observed data will be reported, which is great for setting defaults when your device first connects to observed data. In the above example, the endpoint did existon the Golioth cloud when teh device registered so a payload of null (with length 4) was returned. About 16 seconds later a payload of 42 is received. That’s when I added the endpoint and value in the Golioth Console.

On the cloud, this is an integer, but the device receives payloads as strings. You’ll need to validate received data on the device side to ensure expected behavior in your callback functions (beyond simply printing out the payload as I’m doing here). Give it a try for yourself using our LightDB Observe sample code.

Observing LightDB data gives your devices the ability to react to any changes without the need to poll like you would if you were using the golioth_lightdb_get() function. In addition to being notified each time the data changes, you’ll also get the current state when the observation is first registered (ie: at power-up). Single endpoints, or entire JSON objects can be observed, making it possible to group different types of state data to suit any need.

If you still have questions, or want to talk about how LightDB Observe works under the hood, head over to the Golioth Forum or ping us on the Golioth Discord.

Golioth is a device management cloud that is easy to add to any Zephyr project. Just list the Golioth Zephyr SDK as a module in your manifest file and the west tool will do the rest. Well, almost. Today I’ll walk through how to add Golioth to an existing Zephyr project. As an example, I’ll be using our hello sample. We chose this because it already has networking, which makes explaining things a bit easier. Generally any board that has led0 defined in the device tree and you can enable networking should be a good fit. What we want to do here is showcase the elements that allow you to add Golioth, so let’s dive in!

0. Understanding the west manifest

A Zephyr workspace is made up of a number of different code repositories all stored in the same tree. Zephyr uses a west manifest file to manage all of these repositories, including information like the origin URL of the repo, the commit hash to use, and where each repository should be placed in your local tree.

Think of the manifest as a code repository shopping list that the west update command uses to fill up your local Zephyr tree. There may be more than one manifest file, but today we’ll just focus on the main manifest.

1. Add Golioth to the west manifest

Start by locating your manifest file and opening it with a code editor.

~/zephyrproject $ west manifest --path
/home/mike/zephyrproject/zephyr/west.yml

Under projects: add an entry for the Golioth Zephyr SDK (highlighted in the abbreviated manifest sample below).

manifest:
  defaults:
    remote: upstream
 
  remotes:
    - name: upstream
      url-base: https://github.com/zephyrproject-rtos
 
  #
  # Please add items below based on alphabetical order
  projects:
      # Golioth repository.
    - name: golioth
      path: modules/lib/golioth
      revision: v0.2.0
      url: https://github.com/golioth/golioth-zephyr-sdk.git
      import:
        west-external.yml
    - name: canopennode
      revision: 53d3415c14d60f8f4bfca54bfbc5d5a667d7e724
...

Note that I have called out the v0.2.0release tag. You can set this to any of our release tags, to main, or to a specific commit.

Now run an update to incorporate the manifest changes:

west update

2. Select libraries to add to the build

We use KConfig to build in the libraries that Golioth needs. These changes are made in the prj.conf file of your application.

The first set of symbols deals with Zephyr’s networking stack. Of course every Internet of Things thing needs a network connection so you likely already have these symbols selected.

# Generic networking options
CONFIG_NETWORKING=y
CONFIG_NET_IPV4=y
CONFIG_NET_IPV6=n

Golioth is secure by default so we want to select the mbedtls libraries to handle the encryption layer.

# TLS configuration
CONFIG_MBEDTLS_ENABLE_HEAP=y
CONFIG_MBEDTLS_HEAP_SIZE=10240
CONFIG_MBEDTLS_SSL_MAX_CONTENT_LEN=2048

Now let’s turn on the Golioth libraries and give them a bit of memory they can dynamically allocate from.

# Golioth Zephyr SDK
CONFIG_GOLIOTH=y
CONFIG_GOLIOTH_SYSTEM_CLIENT=y
 
CONFIG_MINIMAL_LIBC_MALLOC_ARENA_SIZE=256

Every device needs its own credentials because all connections to Golioth require security. There are a few ways to do this, but perhaps the simplest is to add them to the prj.conf file.

# Golioth credentials
CONFIG_GOLIOTH_SYSTEM_CLIENT_PSK_ID="220220711145215-blinky1060@golioth-settings-demo"
CONFIG_GOLIOTH_SYSTEM_CLIENT_PSK="cab43a035d4fe4dca327edfff6aa7935"

And finally, I’m going to enable back-end logging. This is not required for connecting to Golioth, but sending the Zephyr logs to the cloud is a really handy feature for remote devices.

# Optional for sending Zephyr logs to the Golioth cloud
CONFIG_NET_LOG=y
CONFIG_LOG_BACKEND_GOLIOTH=y
CONFIG_LOG_PROCESS_THREAD_STACK_SIZE=2048

I separated each step above for the sake of explanation. But the combination of these into one block is the boiler-plate configuration that I use on all of my new projects. See this all as one file in the prj.conf from our hello sample.

3. Instantiate the Golioth system client and say hello

So far we added Golioth as a Zephyr module and enabled the libraries using KConfig. Now it’s time to use the Golioth APIs in the main.c file.

The first step is to include the header files and instantiate a golioth_client object. The client is used to manage the connection with the Golioth servers. Including the coap header file is not strictly required to establish a connection, but it is necessary for processing the responses from Golioth, so I always include it.

#include <net/coap.h>
#include <net/golioth/system_client.h>
static struct golioth_client *client = GOLIOTH_SYSTEM_CLIENT_GET();

I also add a callback function to handle messages coming back from the Golioth cloud. Technically this is optional, but if you want two-way communication with the cloud you need it!

/* Callback for messages received from the Golioth servers */
static void golioth_on_message(struct golioth_client *client,
                   struct coap_packet *rx)
{
    uint16_t payload_len;
    const uint8_t *payload;
    uint8_t type;
 
    type = coap_header_get_type(rx);
    payload = coap_packet_get_payload(rx, &payload_len);
 
    printk("%s\n", payload);
}

In the main function, I register my callback, start the Golioth client, and call the golioth_send_hello() API.

/* Register callback and start Golioth system client */
client->on_message = golioth_on_message;
golioth_system_client_start();
 
while (1) {
    /* Say hello to Golioth */
    int ret = golioth_send_hello(client);
    if (ret) {
        printk("Failed to send hello! %d\n", ret);
    }
    else printk("Hello sent!\n");
}

When successful, the golioth_send_hello() call will prompt for a message back from the server which includes the name of the sending device. This is printed out by the golioth_on_message() callback.

Hello sent!
Hello blinky1060
Hello sent!
Hello blinky1060
Hello sent!
Hello blinky1060

Extra Credit: Back-end Logging

Observant readers have noticed that I enabled back-end logging using KConfig symbols but I didn’t use it in the C code. Here’s the really awesome part: just use Zephyr logging as you normally would and it will automatically be sent to your Golioth console.

At the top of main.c, include the log header file and register a logging module.

#include <logging/log.h>
LOG_MODULE_REGISTER(any_name_you_want, LOG_LEVEL_DBG);

In our C functions, call logs as you normal would.

LOG_ERR("An error message goes here!");
LOG_WRN("Careful, this is a warning!");
LOG_INF("Did you now that this is an info log?");
LOG_DBG("Oh no, why isn't my app working? Maybe this debug log will help.");

Now your log messages will appear on the Golioth console!

Further Reading

This covers the basics of adding Golioth to an existing Zephyr project. You can see the steps all in one place by looking at the Golioth code samples. Here are the examples that you’ll find immediately useful:

  • Hello – basics of connecting to Golioth and sending log messages (what was covered in this post)
  • Lightdb Set – send data to Golioth
  • Lightdb Observe – device will be notified whenever an endpoint on the Golioth cloud is updated

To go even deeper, you can see how we use the Golioth Over-the-Air (OTA) firmware update feature, and how to use the Zephyr settings subsystem for persistent credential storage. And remember, the Dev Tier of Golioth includes the first 50 devices, so you can try all of this out for free.

Image from Todd Lappin on flickr

Thread (and its common implementation known as OpenThread) is a networking technology that is quickly gaining adoption due to the forthcoming Matter standard. Thread has been around for many years, but as it grows, it becomes more accessible using off-the-shelf firmware and hardware. So it’s accessible, but maybe not all that straightforward. This post will help with that.

As we have more customers talking to us about using Golioth as a management layer for both Matter solutions and for standalone industrial Thread networks, we thought we should expand our tools to better fit the needs of engineers designing new systems.

In this article and associated examples, we will show you how to set up a network at home using common components. We’ll build a custom device that is communicating back over that network utilizing features of Golioth that extend the networking layer: over-the-air firmware updates, time series data tracking, command/control structures, and instant logging.

Parts of this Thread Guide

In the past, we have written about the basics of getting a Thread demo up and running, and shown it working on video. Today we build upon that work and showcase a new set of resources so you can build your own Thread network with custom devices.

  • YouTube video – A walkthrough of the setup steps and troubleshooting steps with a newly provisioned Thread network.
  • A tutorial site – Follow along with a simplified set of directions for replicating what we have built. We think is the shortest path towards getting a working Thread network on your desk or bench.
  • Code repository – Start from working code on the node devices to see how you can customize code and have your sensor data streaming back to Golioth quickly.
  • This blog post

Getting Started

The majority of the step-by-step instructions are contained in the tutorial site for Golioth and OpenThread. If you’re interested in immediately replicating and then extending our setup, head over to the tutorial site to learn more.

Let’s take a higher level look at the OpenThread Border Router (OTBR), OpenThread nodes, and Golioth device management layer that make up this Thread network example.

OpenThread Border Router  (OTBR)

This is the key part in a Thread network, as it allows any arbitrary number of nodes that are communicating with one another (meshing) to then reach the outside internet. Each Thread device has an IPv6 address, which is great: That means a node that is meshing with 30 other nodes and connected to the internet (through an OTBR) is directly addressable from the internet. That’s an important piece. We might expect a higher power WiFi based device to have an IP address (assigned from a router), but probably not a low power sensor. The OTBR does a lot of the routing of information and translation of packets coming from node devices.

We build a DIY version of the OTBR because there aren’t many commercially available (yet). We use a Raspberry Pi and an nRF52840 Dongle to create a pipeline out to the wider internet.

OpenThread Nodes

In our first video/blog about Thread, we had nodes talking to the internet through an OTBR. However, the nodes only blinked and sent back logging messages and we didn’t give detailed instructions on how to build them. In the tutorial site and the video, we show how we can execute arbitrary code to do higher level functions, like data logging. We use the Laird Connectivity BT510, which is a sensor node built with the Nordic Semiconductor nRF52840. It also has a range of sensors built in and is contained in a waterproof case. We think it’s a great platform for building a small, reliable Thread network and we used it in our Red Demo that we showcased at the 2022 Zephyr Developer Summit and Embedded World.

The BT510 is a board already supported in Zephyr, which means we can very easily compile firmware for it and access all of the sensor drivers that are built into Zephyr, no custom out-of-tree code required. We use the OpenThread networking stack that is native to Zephyr, and the Golioth SDK, which allows each node to be pre-configured to talk to the Golioth servers. We then enable things like LightDB Stream to regularly send back sensor data from the device through the Thread network.

Golioth Device Management Layer

The Golioth Device Management Layer/Platform is already ready for you. If you don’t have an account, you can sign up on the Golioth Console, which will guide you through creating your first device on the platform; you can use the credentials for that digital version of a device to control your first Thread node.

Once your Thread device is connected, you’ll be able to see how often the device is connecting, view the latest data and logs being sent back from the device, and check which firmware versions are on each device. Any data sent to the Golioth platform from a Thread node can be aggregated into an external visualization platform, or wholesale exported to 3rd party services (AWS, Azure, GCP) using Output Streams.

What will you build?

We are sharing the know-how to build a Thread network. Following this guide enables all of your devices on the Thread network to communicate back to the wider internet. As a hardware engineer, I don’t really want to mess about with the network layer, I just want something that works. Instead, I’d rather focus on the end application and building end devices (nodes) that are useful to customers and users.

With Golioth, Zephyr, OpenThread, and some off-the-shelf hardware, you can get started quickly and you can start to connect custom devices with a powerful interface to the internet. What will you build? Please let us know on our Discord, Forum, or on Twitter.

Have you tried to use the Golioth Web Console yet? The interface delivers access and control for your entire IoT fleet. This means sending and receiving data in real-time, checking on the state of each device (including current firmware revision), reading logs from the hardware, and more.

Did you know that you can create your own User Interface (UI) like this using any stack you want? That’s because we used REST and WebSocket APIs to build the Golioth Console, and those same APIs are available for you to build any application to fit for our needs.

In this blog, post I will show how simple it is to set up a custom UI project using the Golioth APIs.

To demonstrate, we built a web interface around the image of an Adafruit MagTag, a development board we use for our developer training program. It’s pretty cool to click a button on the the image above and see the device in your hand react. Let’s dive in as I cover the necessary steps to pull it all together.

Golioth Cloud

We begin by using the Golioth Web Console to setup a project and create API Keys. You can also follow the authentication docs where it has a guide for you to do the same but using Golioth Command Line Interface (CLI).

  1. Sign-up/Sign-in on the Golioth Web Console
    • If you created a brand new account, you will see a QuickStart Wizard that guides you through the process of creating a new project and adding a new device
  2. Choose your project using the project selector at the middle-top (I’m calling mine Project 1)
  3. Create an API Key to authenticate on the API’s:
    • Clicking on Create, select API Key and hit Create at the pop-up;
  4. Create a Device
    • Go to Devices at the sidebar and hit Create
    • I’m calling mine magtag, and generating credentials automatically

Firmware

LightDB State - MagTag

LightDB State – MagTag

My physical MagTag is running the latest version of the MagTag Sample using Golioth’s Arduino SDK. With that firmware, my device is set up to use LightDB State to read and set data. That means it will listen for changes on the desired endpoint and update it’s status both physically and on the cloud’s state endpoint to match.

Note: The arduino-sdk repository showcased in this post is deprecated. GoliothLabs has two experimental repositories that may work as replacements:

This state pattern is related to the concept of Digital Twin, which you can read more on our desired state vs. actual state blog post.

Front-end

The front-end was bootstrapped using Vite’s react-ts template. I’m also using Mantine as a component library for this application.

To set up our connection to both the REST and WebSocket APIs, we first need to understand how it should be built. For that, you can easily go to Golioth REST API Docs and Golioth WebSocket API Docs and follow through those steps.

The gist of it is that we need a few pieces of information to authenticate. This includes the Golioth API URL, the project ID we are targeting, and an API key from that project. Since we’re going to target a specific device as well, I also added the Device ID.

With those fields, we’re able to connect and listen to state changes using the WebSocket API. But we also want to display the current state, and be able to update the desired state from here.

Displaying Current State

The data coming from the current state allows us to build a virtual replica of the MagTag on the UI. With some CSS magic we can display its text, leds and light.

{
  "accX": 0.32,
  "accY": 0.11,
  "accZ": -9.89,
  "leds": {
    "0": "#00a2ff",
    "1": "#00ffee",
    "2": "#00ff84",
    "3": "#04ff00"
  },
  "light": 34,
  "text": "Golioth"
}

The theme is also reacting to the light sensor readings from the device. The UI changes to dark mode if the light level is low.

Setting Desired State

To set the desired state, we’re going to send some POST requests using our REST API, using the same API Keys that we input on the form.

LEDs:

Using a modal and a color picker, we can select the colors and press Save.

URL:

https://api.golioth.io/v1/projects/project-1/devices/6283eedd71e8739f42672114/data/desired/leds

Payload:

{
    "3": "#ff0000"
}

Using the same modal and form, we can set all leds states, by clicking on top of the led position.

Text:

Using the same logic, we can also use a modal and a textarea to set the text, with preserved line breaks.

URL:

https://api.golioth.io/v1/projects/project-1/devices/6283eedd71e8739f42672114/data/desired

Payload:

{
    "text": "MagTag"
}

Buttons:

Buttons don’t have an actual state, so here I just added some boxes on top of their positions on the MagTag image.

This way, when we click on them, the application will change the desired buzz state to true.

URL:

https://api.golioth.io/v1/projects/project-

/devices/6283eedd71e8739f42672114/data/desired/buzz

Payload:

true

LightDB State Result:

"desired": {
  "buzz": true,
  "leds": {
    "0": "#ff0000",
    "1": "#00ffee",
    "2": "#00ff84",
    "3": "#1ad57a"
  },
  "text": "MagTag"
}

The device is also listening for changes on the desired state, so when the buzz state changes to true, the device will take action. In this case, the actual MagTag will emit a buzz, and then change the desired buzz state back to 0.

Just a taste of what you can do with a custom UI

The simple steps I’ve shown here are just the beginning of what you can accomplish with your own custom user interface. If you are managing fleets for a customer, you may want to give them a simpler interface that only includes relevant controls and data. Whether it’s a Digital Twin like the MagTag in my example, or more traditional web interface, knowing that Golioth will work for any web-control need you come across is yet another powerful tool to have at your disposal.

See it in action