Golioth recently released Output Streams. This new feature is immediately available to all users on their Golioth Console account. It allows you to pipe every event happening on the Golioth backend out to the cloud of your choice. Golioth’s capabilities as a device infrastructure provider (fleet management, OTA firmware update, device state maintenance, and deep device logging) can now be decoupled from the data storage and processing portion of your IoT deployment. When integrating with your internal or external cloud team, piping large volumes of data into their system is now as easy as flipping a switch.
How Golioth Users Access Data
You have hundreds or thousands of devices sending data back to the Golioth cloud. How do you get at that data? There are now 3 different ways you can access your device data:
- REST API
- WebSockets
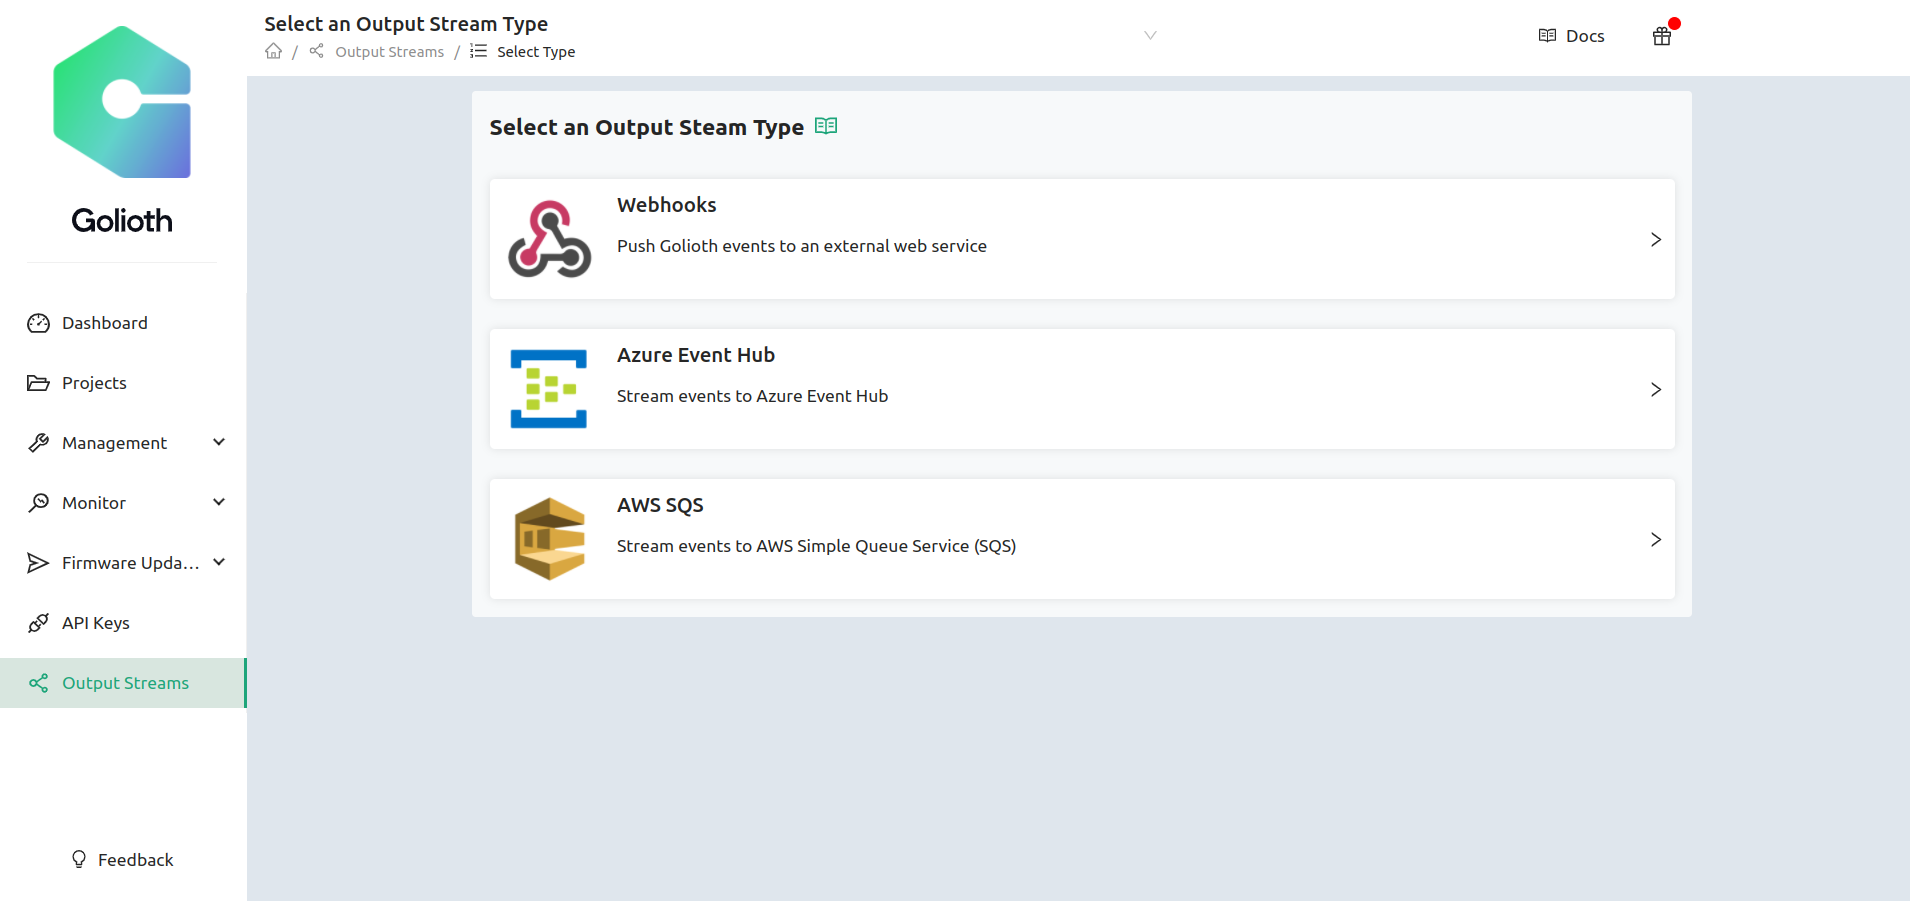
- Output Streams (including AWS SQS, Azure Event Hubs, and Webhooks)
REST API
Our REST API gives you access to all of the data on the platform, but on a per-request basis. So if you know you have a smart switch #5633 is out in the world at job site #1324, you might want to know the current status of that switch. You could send a GET request to the LightDB State variable that determines whether the switch is on or off. Or you could send a POST request to actually change the state of that switch. If you’re using LightDB Stream instead, you could do a GET request for the latest piece of data.
The key point is that you have to specifically call for variables in the platform (polling). If someone was flipping that switch every 3 seconds, but you only check every minute, you’re not going to catch every time that it switches. What’s more, you won’t get all of the other rich data that the Golioth platform collects around events. It’s still useful to be able to read and write the data, but doesn’t capture everything.
WebSockets
Websockets are a feature we introduced a few months ago and then made a Grafana plugin for listening to them. These are more direct connections to subscribe to realtime data. So if you were interested in not just the current state of the switch described above, but wanted to see a chart of (albeit boring) data showing the switch’s state, you could capture that by using LightDB Stream and WebSockets. Each of those switch events would be a “high” or “low” on the chart. Using WebSockets, you could point a Grafana instance to watch that variable and it would immediately update as the new switch data is available on the Golioth Cloud. Instead of polling, as would be required when using the REST API, the real time chart will update automatically.
Output Streams
Output Streams are an even richer way of outputting data from the Golioth Cloud. This is useful if you wanted to know not only the time that the switch changed state, but also who changed the state: was it a user flipping a physical switch on the device? Was it an app attempting to change the state of the switch to enact change in the physical world? Was it a troubleshooting command from the Golioth Console or via a REST API call? This context-rich data can now pass out of the Golioth Cloud and into the platform of your choice. When you are reviewing the data in your AWS or Azure instance, you can see that a user attempted to turn on the switch from the app on their phone at 8:30 am yesterday, and then they flipped the physical switch at 8:31. Not only is this incredibly useful data for troubleshooting problems, context-rich data can enable more meaningful software interactions for your users.
Integrations are easier
As of this writing, Golioth Output Streams support the following three integrations:
The first two are cloud specific ingestion engines for events happening outside the Amazon and Microsoft ecosystems. If your cloud team is using AWS, the SQS integration (also shown in the video below) will allow them to receive events from Golioth; you can select which events to send to AWS during Output Streams setup. Queuing (the “Q” in “SQS”) is a major feature of this input to AWS. It captures a high volume of incoming data events and buffers them for processing as your system catches up. As your Golioth deployment grows to thousands of devices or more, this will be a critical component to ensure every datapoint is captured. We will write more in the future about DevOps and large deployments using Golioth. The story for Azure Event Hubs is similar, it buffers incoming data, with some differences in setup and implementation.
Webhooks are a more generic class of Output Stream, which allows even easier integration to 3rd Party Platforms. As explained above, Output Streams enable delivery of a more context-rich piece of data to outside platforms. What’s more, many of these platforms are pre-configured to accept Webhooks. So as a user, I can now target the external platform’s address and immediately start parsing data in outside platforms such as visualization tools. Datacake did an early preview of this, showing how incoming Webhooks can be ingested and processed by their system for charting device data. Webhooks allow fast prototyping with a variety of visualization platforms.
Watch the demo and try it yourself
We discussed the nature of Output Streams and showed a demonstration of sending events to an AWS SQS instance. Watch the video below for more info or sign up for a free Dev Tier account and try Golioth Output Streams today!
