Golioth now supports Infineon parts via the ModusToolbox™. We added Golioth device management to the ecosystem a few weeks ago and the example code is available right now to run on Infineon’s line of microcontrollers talking to their Wi-Fi parts.

ModusToolbox™ (MTB) is a software support tool from Infineon Technologies. It includes partner SDKs alongside the company’s officially supported IDEs, drivers, and examples. You can pull in the Golioth example and all dependencies using the Eclipse IDE that is included in MTB, or via the command line tool.

Infineon’s PSoC™ 6 chips are feature rich 32-bit Arm microcontrollers. Paired with the Infineon 4343W, it’s a perfect platform for IoT device builders, and exactly the kind of constrained device that Golioth was built for.

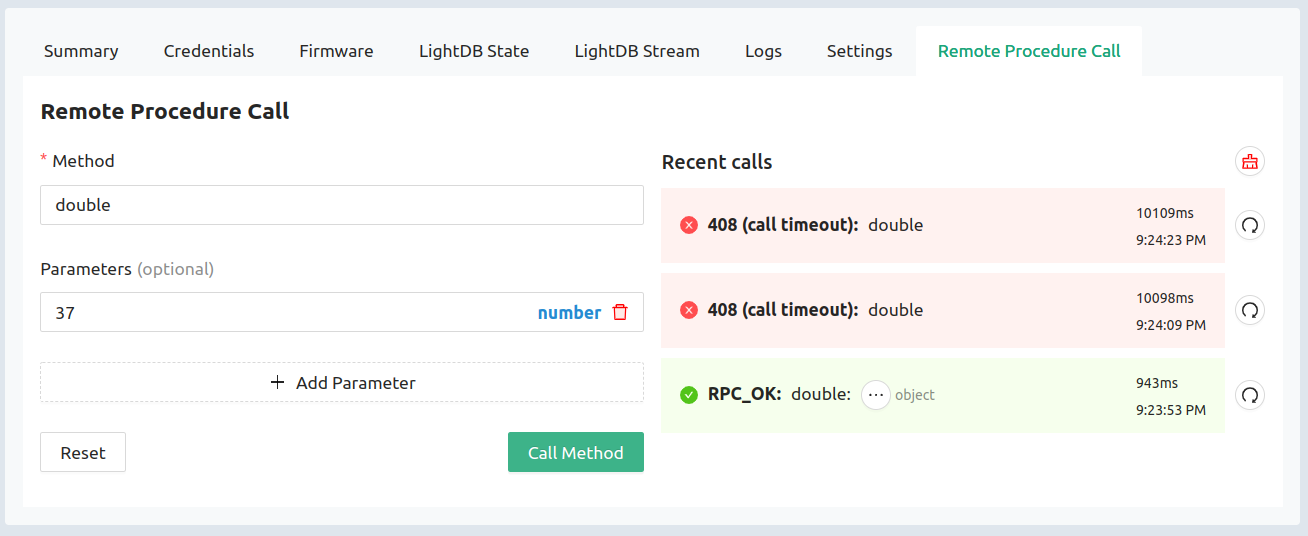
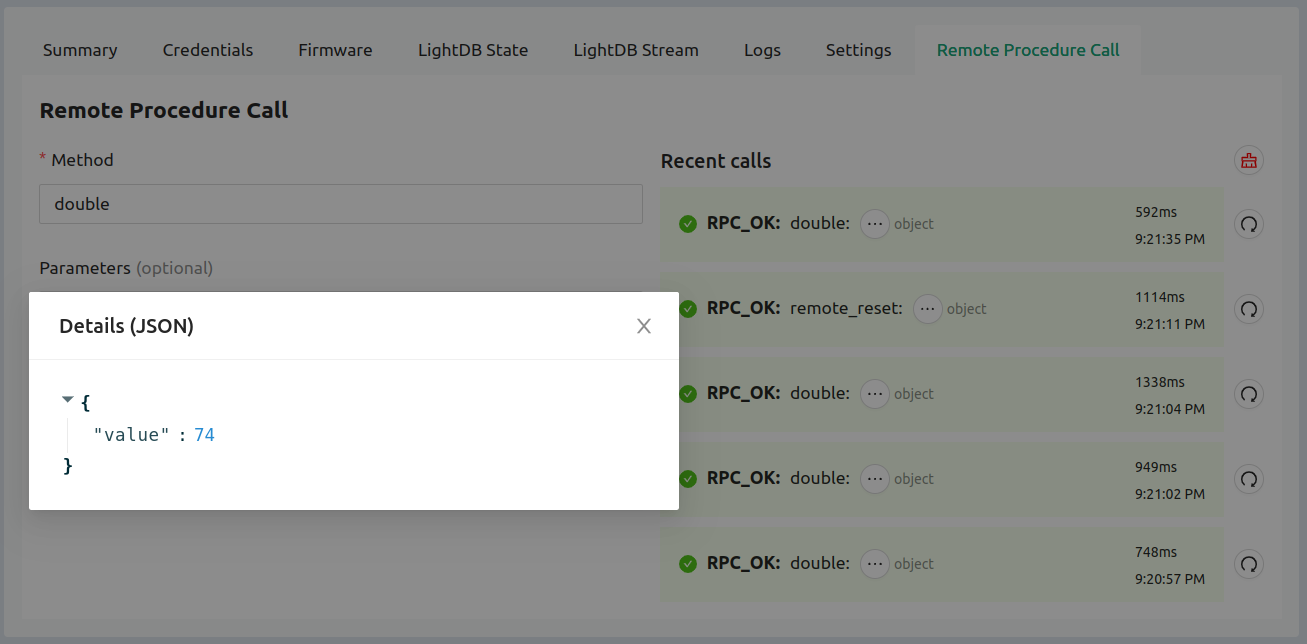
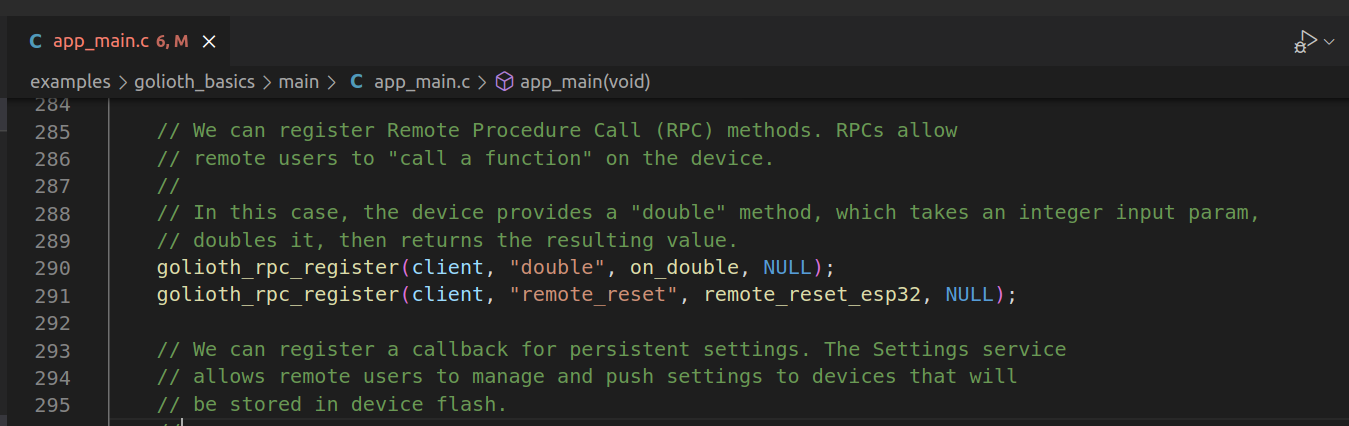
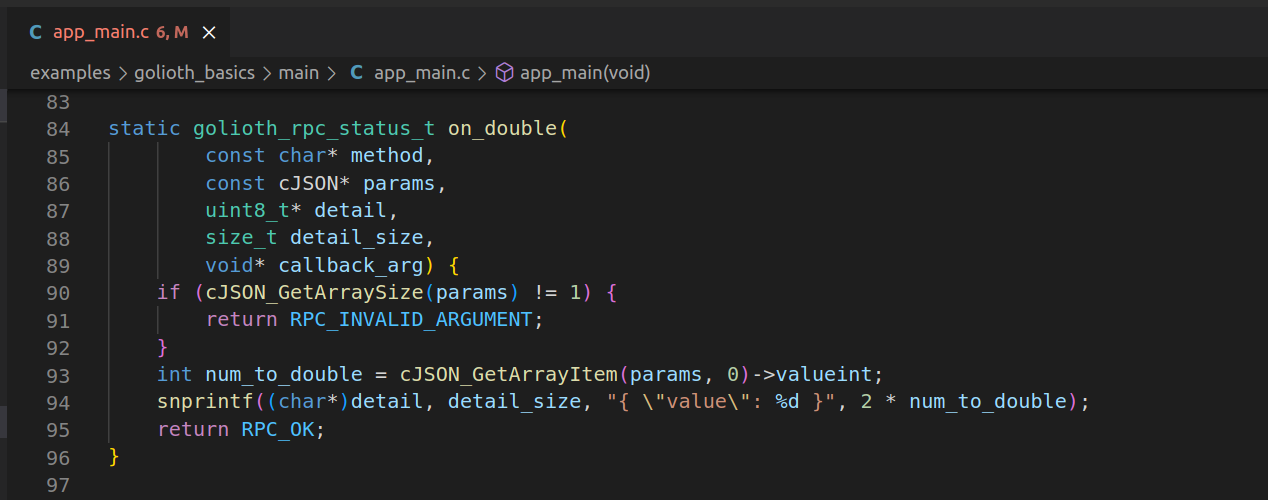
Take advantage of Over-the-Air (OTA) firmware updates, time-series databases, state data management, remote logging, plus the command/control features like remote procedure call (RPC) and the device settings service. The API calls for each of these are demonstrated and well-commented in the golioth_main.c file.

Try the Golioth example using ModusToolbox™

PSoC 6 Wi-Fi BT Prototyping Kit (CY8CPROTO-062-4343W)

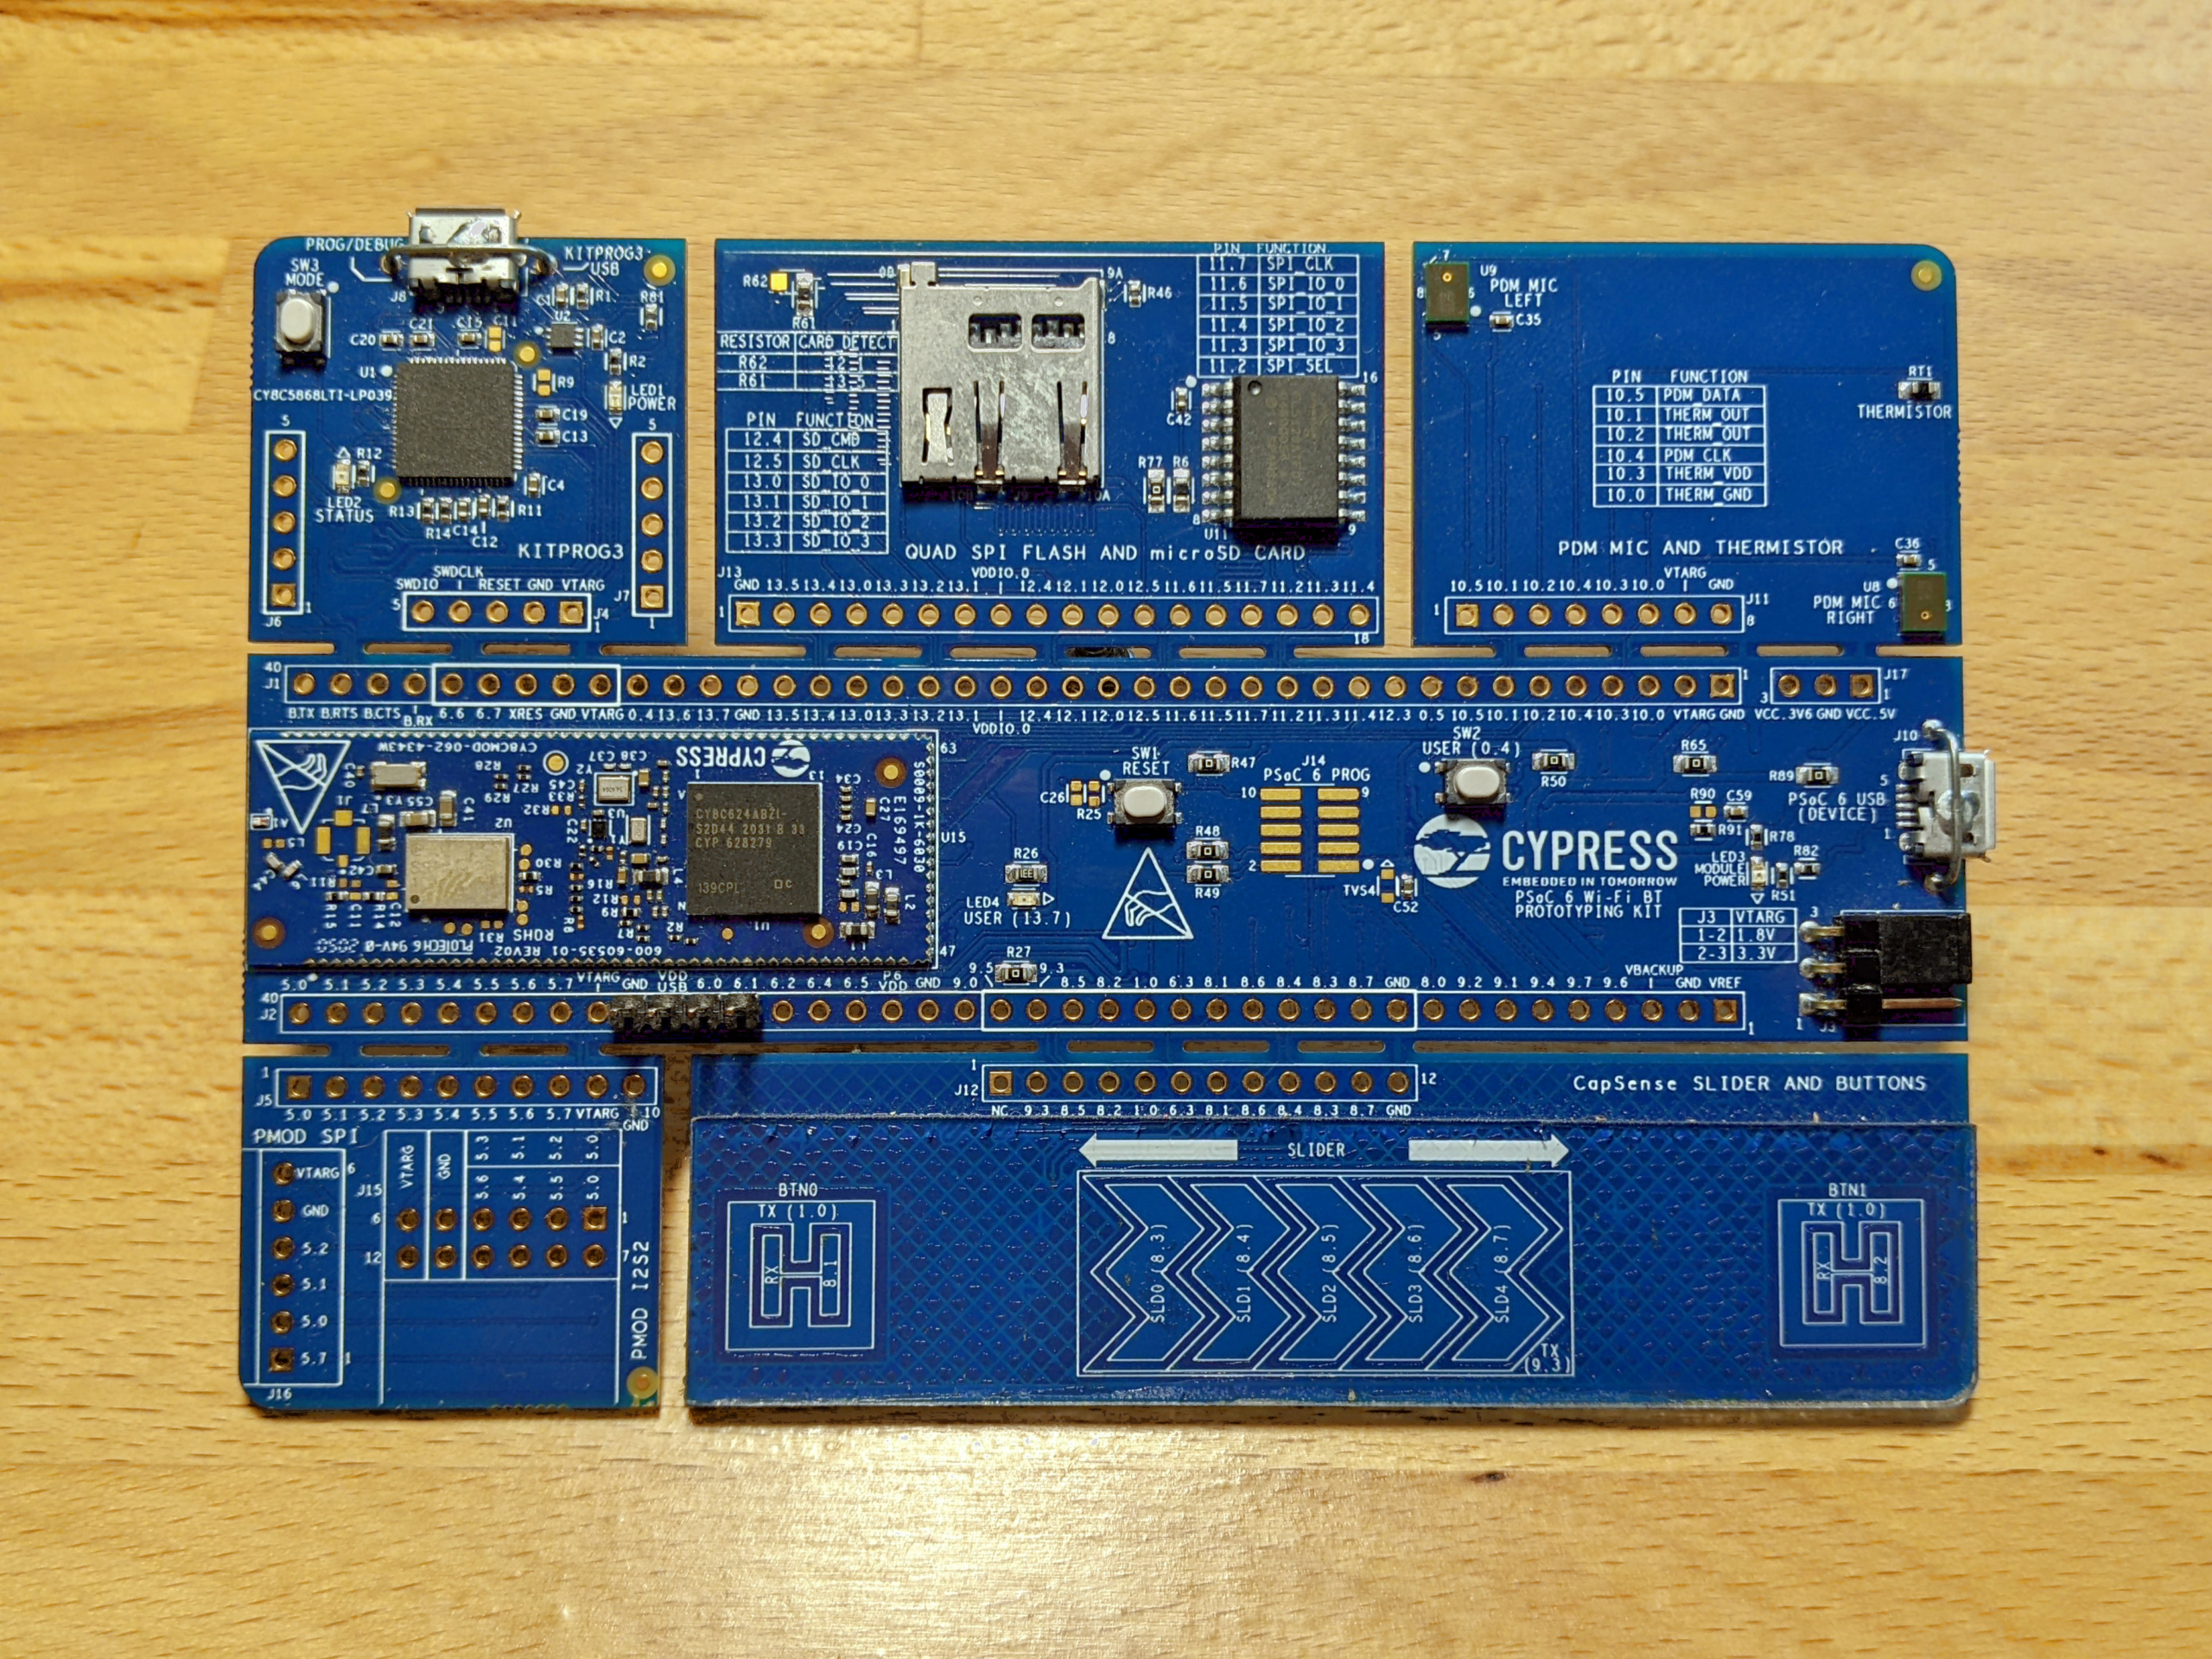
We run the Golioth example on the PSoC™ 6Wi-Fi BT Prototyping Kit (CY8CPROTO-062-4343W). Here’s how to try it for yourself:

1. Install Infineon’s ModusToolbox™

Begin by downloading and installing ModusToolbox™ for your system. Then run modustoolbox-eclipsewhich is located in the ide_3.0/eclipse/ subfolder.

2. Create a Golioth Example project

With the Eclipse IDE open, click on File→New→ModsToolbox Application. This will launch the project creator window.

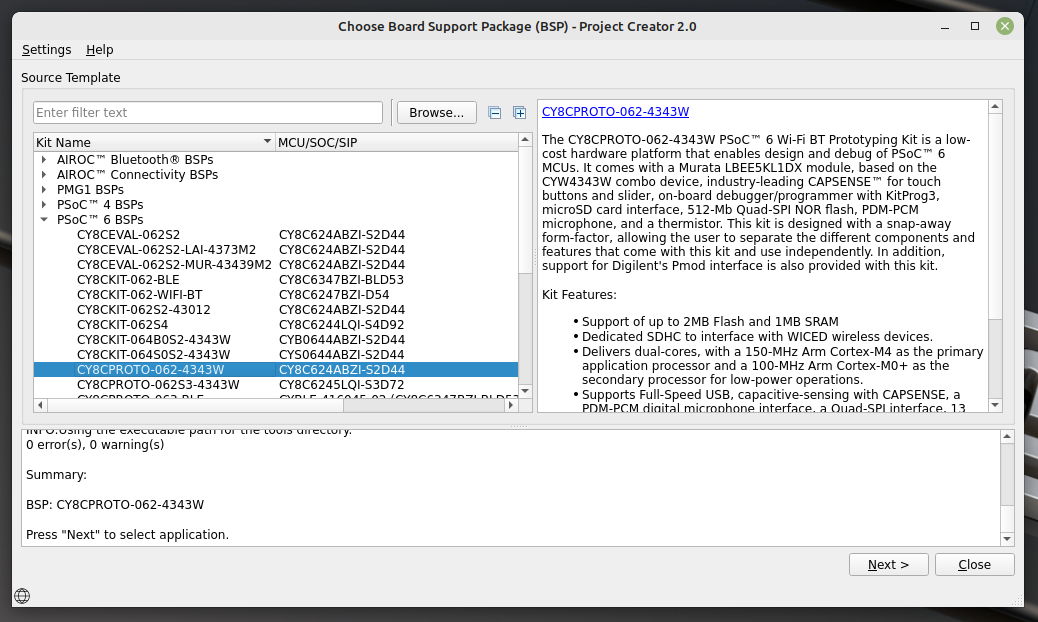
Select the CY8CPROTO-062-4343W from the list of PSoC™ 6 boards and then click next.

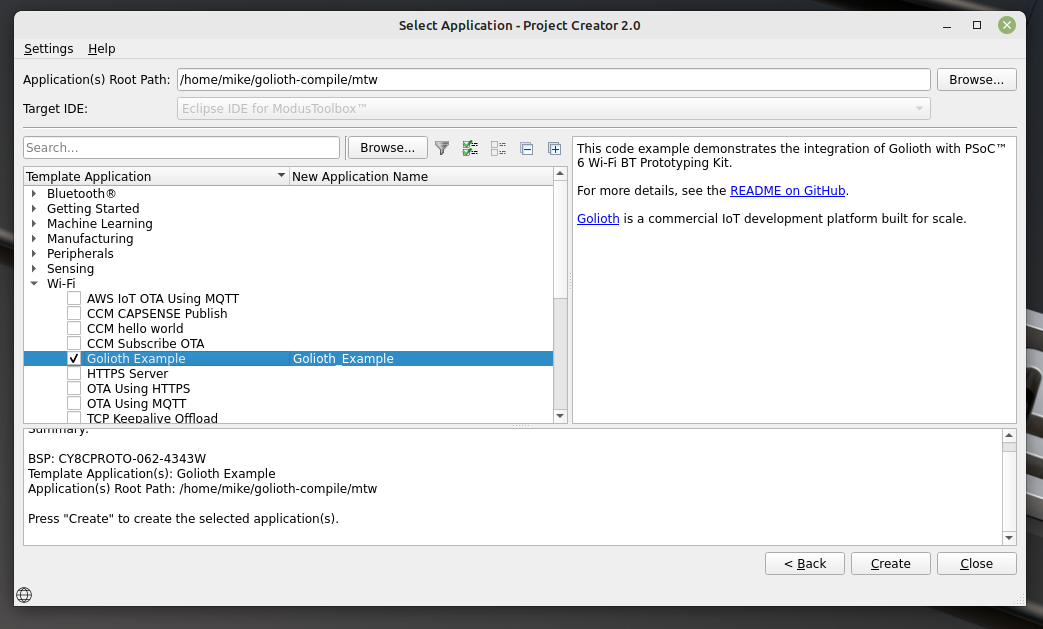
Choose the Golioth Example from the Wi-Fi list and click on the Create button. This will take a couple of minutes to clone the Golioth code and all dependencies.

3. Compile and Install MCUboot

Golioth uses MCUboot as the secure bootloader for our Over-the-Air updates. Before flashing the app to the board, we need to compile and install MCUboot. I did this using the IDE’s built-in terminal.

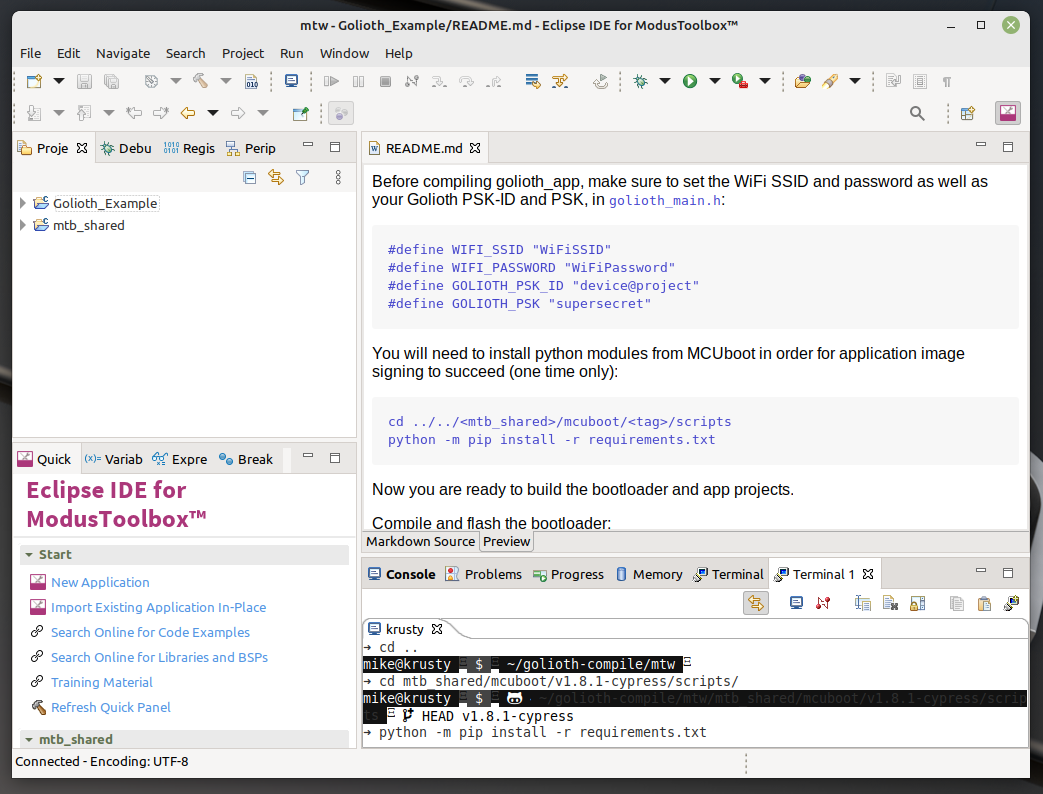
First, we need to install the MCUboot dependencies.

cd ~/mtw/mtb_shared/mcuboot/v1.8.1-cypress/scripts/
python -m pip install -r requirements.txt

Now we can compile and flash MCUboot. Remember to plug a USB cable into the KITPROG3 connector on your PSoC™ 6 devboard before running the program command:

cd ~/mtw/Golioth_Example/bootloader_cm0p/
make build_proj -j8
make program_proj

4. Compile and flash the Golioth App

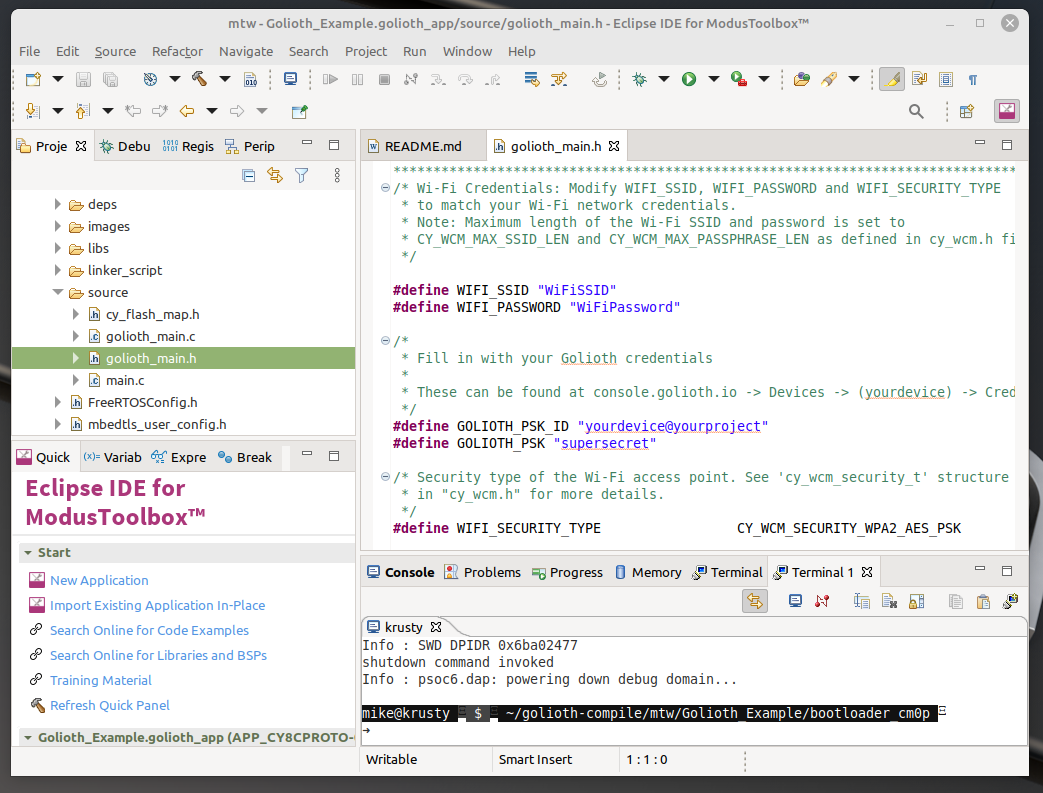
Before compiling the Golioth App we need to give it credentials to connect to Wi-Fi and also to authenticate with the Golioth server. These are set in the ~/mtw/Golioth_Example/golioth_app/source/golioth_main.hfile.

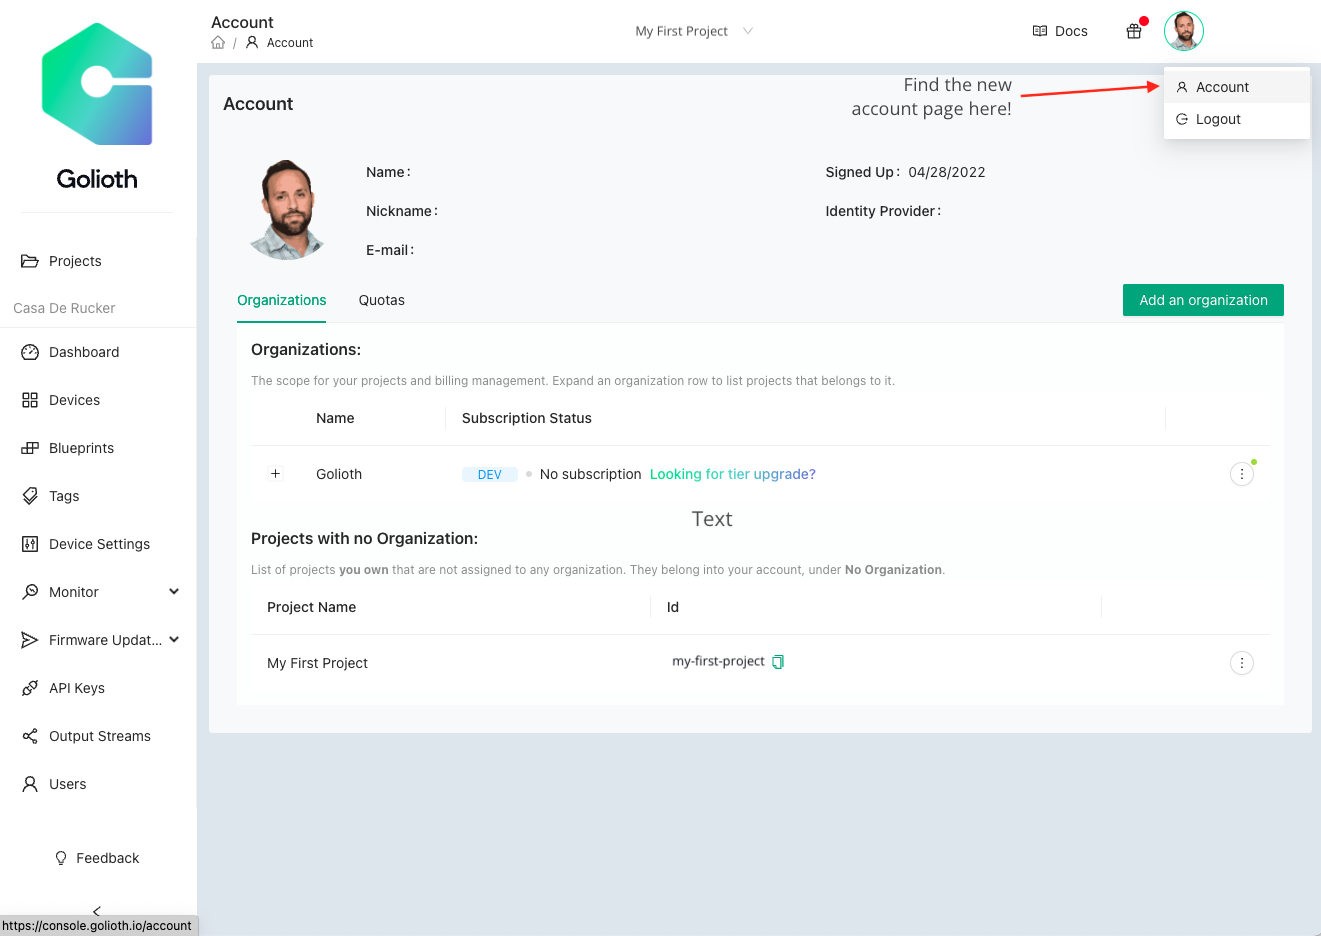
Use the Wi-Fi credentials for your local access point. Get device credentials from the Golioth Console. If you’ve haven’t yet set up an account, check out our Quickstart. (With Golioth’s Dev Tier your first 50 devices are free.)

Once you’ve saved your changes to the golioth_main.h file, use the terminal to compile and flash the app to your PSoC™ 6 board:

cd ~/mtw/Golioth_Example/golioth_app
make build_proj -j8
make program_proj

Taking the Golioth App for a test drive

[INF] MCUBoot Bootloader Started
[INF] External Memory initialized w/ SFDP.
[INF] boot_swap_type_multi: Primary image: magic=unset, swap_type=0x1, copy_don3
[INF] boot_swap_type_multi: Secondary image: magic=unset, swap_type=0x1, copy_d3
[INF] Swap type: none
[INF] User Application validated successfully
[INF] Starting User Application (wait)...
[INF] Start slot Address: 0x10018400
[INF] MCUBoot Bootloader finished
[INF] Deinitializing hardware...
External Memory initialized w/ SFDP.
=========================================================
[GoliothApp] Version: 1.0.0, CPU: CM4

=========================================================
[GoliothApp] Watchdog timer started by the bootloader is now turned off to mark.
[GoliothApp] User LED toggles at 1000 msec interval

WLAN MAC Address : 74:7A:90:D4:5F:04
WLAN Firmware    : wl0: Jul 18 2021 19:15:39 version 7.45.98.120 (56df937 CY) FWID 01-69db62cf
WLAN CLM         : API: 12.2 Data: 9.10.39 Compiler: 1.29.4 ClmImport: 1.36.3 Creation: 2021-07-18 19:03:20 
WHD VERSION      : v2.5.0 : v2.5.0 : GCC 10.3 : 2022-09-23 13:14:02 +0800
Wi-Fi Connection Manager initialized.
Successfully connected to Wi-Fi network 'MyWiFiAP'.
IP Address Assigned: 192.168.1.153
Secure Sockets initialized
I (5515) golioth_main: Waiting to Golioth to connect...
I (5638) golioth_coap_client: Start CoAP session with host: coaps://coap.golioth.io
I (5643) libcoap: Setting PSK key

I (5649) golioth_coap_client: Entering CoAP I/O loop
I (5886) golioth_main: Golioth client connected
I (5996) golioth_fw_update: Current firmware version: 1.0.0
I (6060) golioth_fw_update: Waiting to receive OTA manifest
I (6258) golioth_fw_update: Received OTA manifest
I (6258) golioth_fw_update: Manifest does not contain different firmware version. Nothing to do.
I (6260) golioth_fw_update: Waiting to receive OTA manifest
I (6322) golioth_main: Synchronously got my_int = 42
I (6323) golioth_main: Entering endless loop
I (9006) golioth_main: Callback got my_int = 42
I (9286) golioth_main: Setting loop delay to 5 s

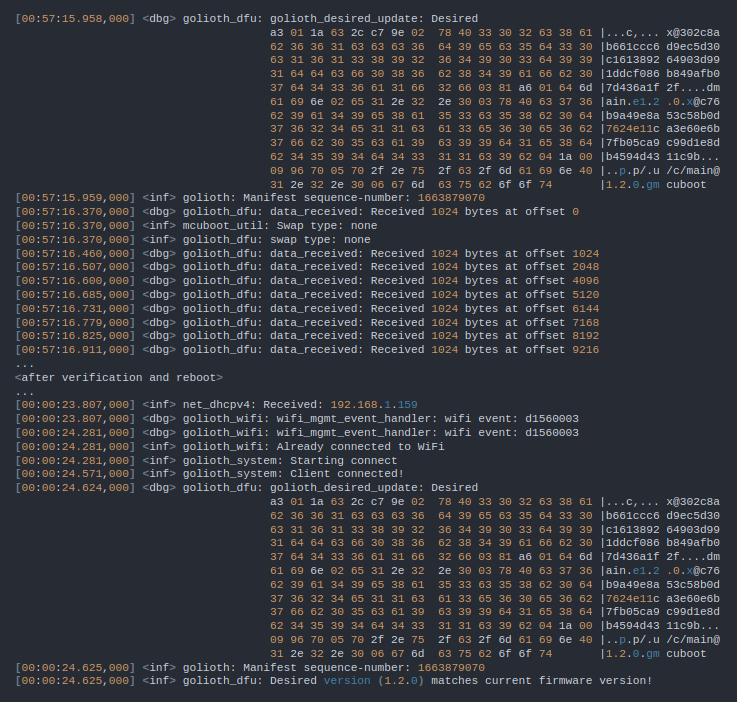
By monitoring the serial output from the device (that’s /dev/ttyACM0 on my system) we can see all the parts of the app at work. The board powers up and reports the firmware version before connecting to Wi-Fi. Once a Golioth connection is established it checks for firmware updates before it starts writing data to the cloud.

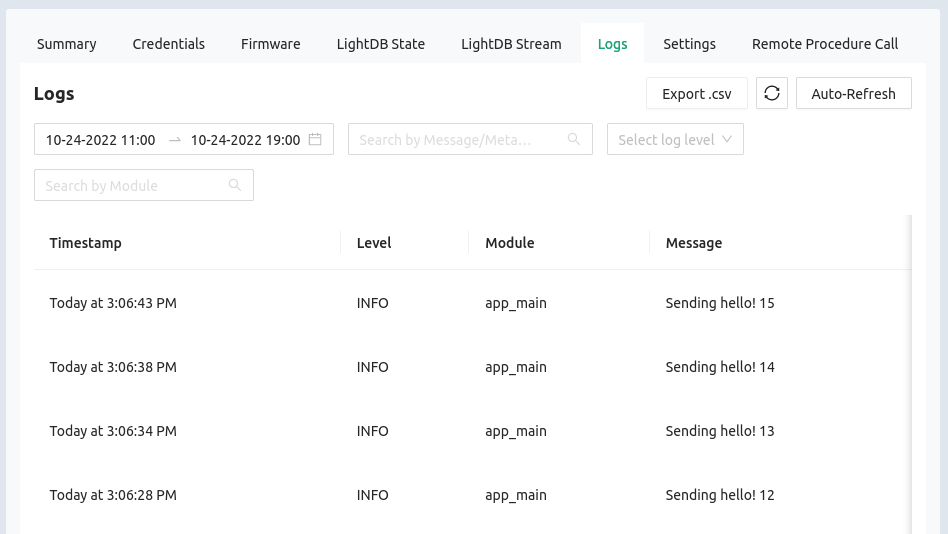
You can view device logs remotely through the Golioth console. Here we see “Sending hello!” messages arriving along with a counter.

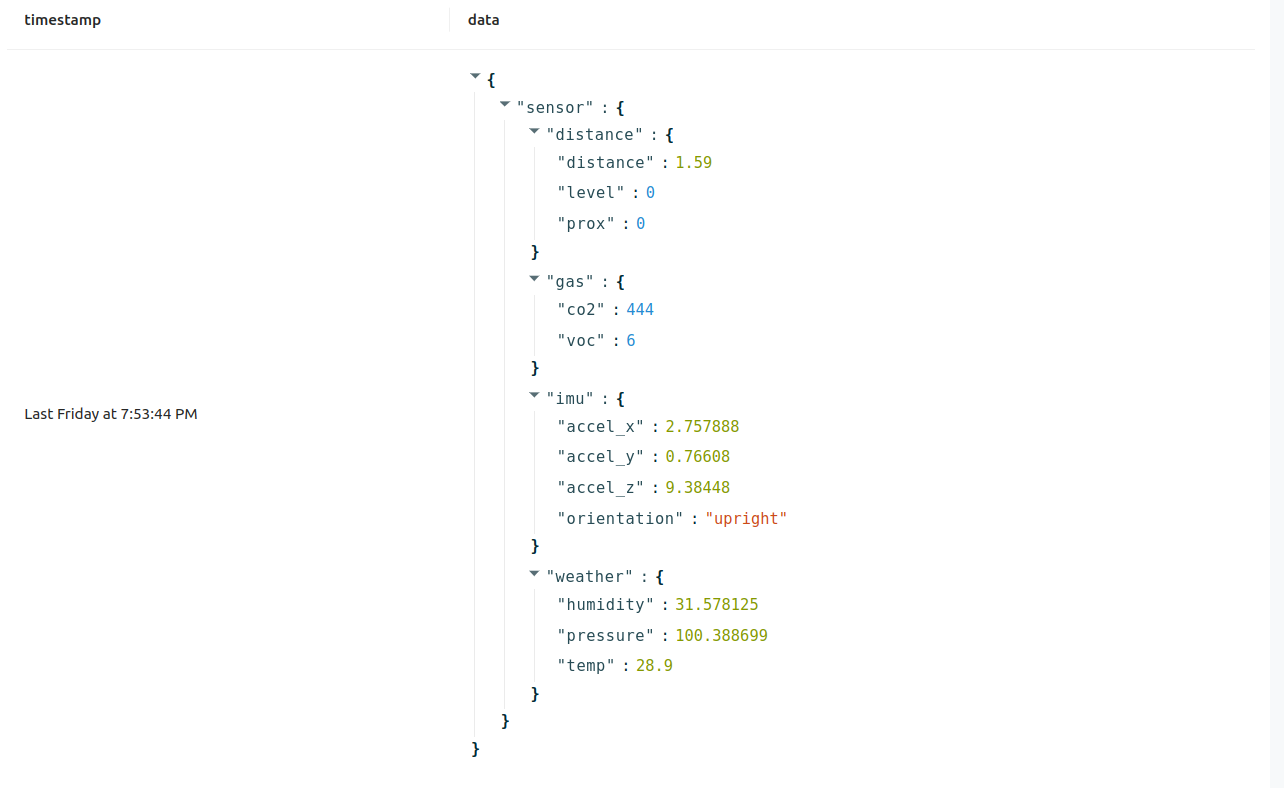
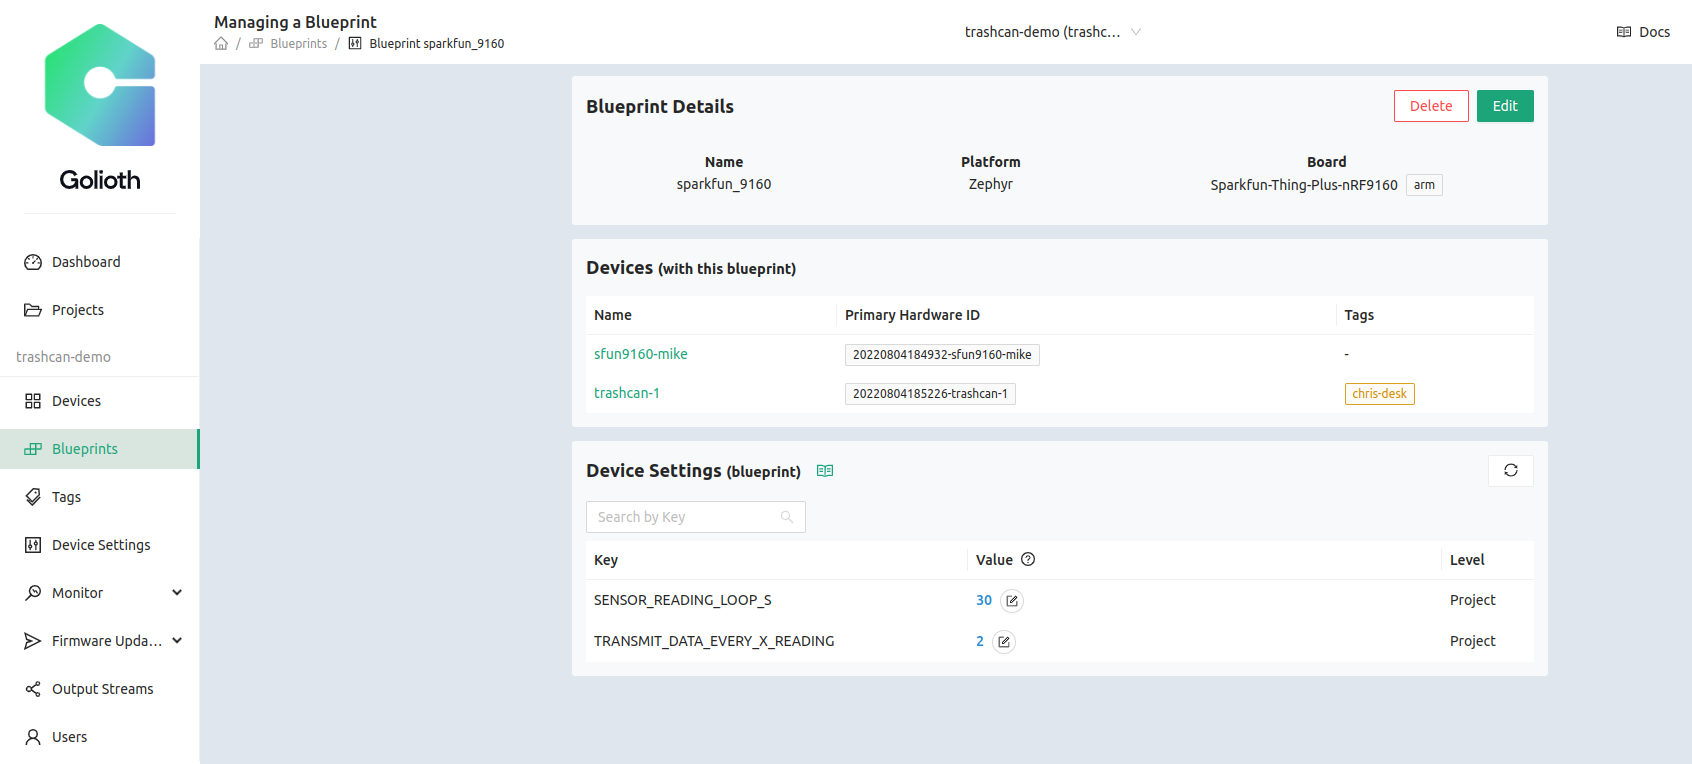
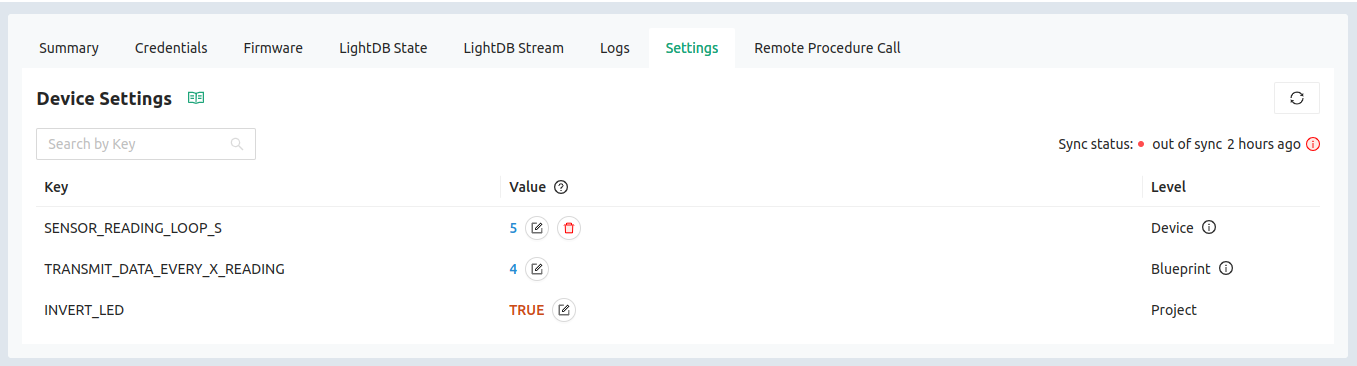
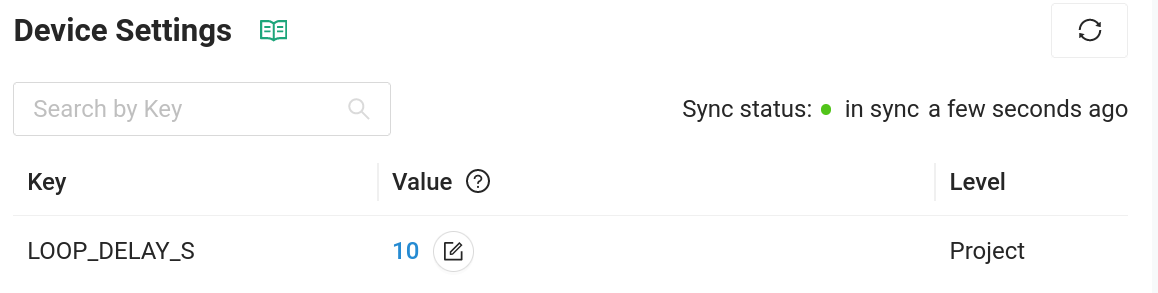
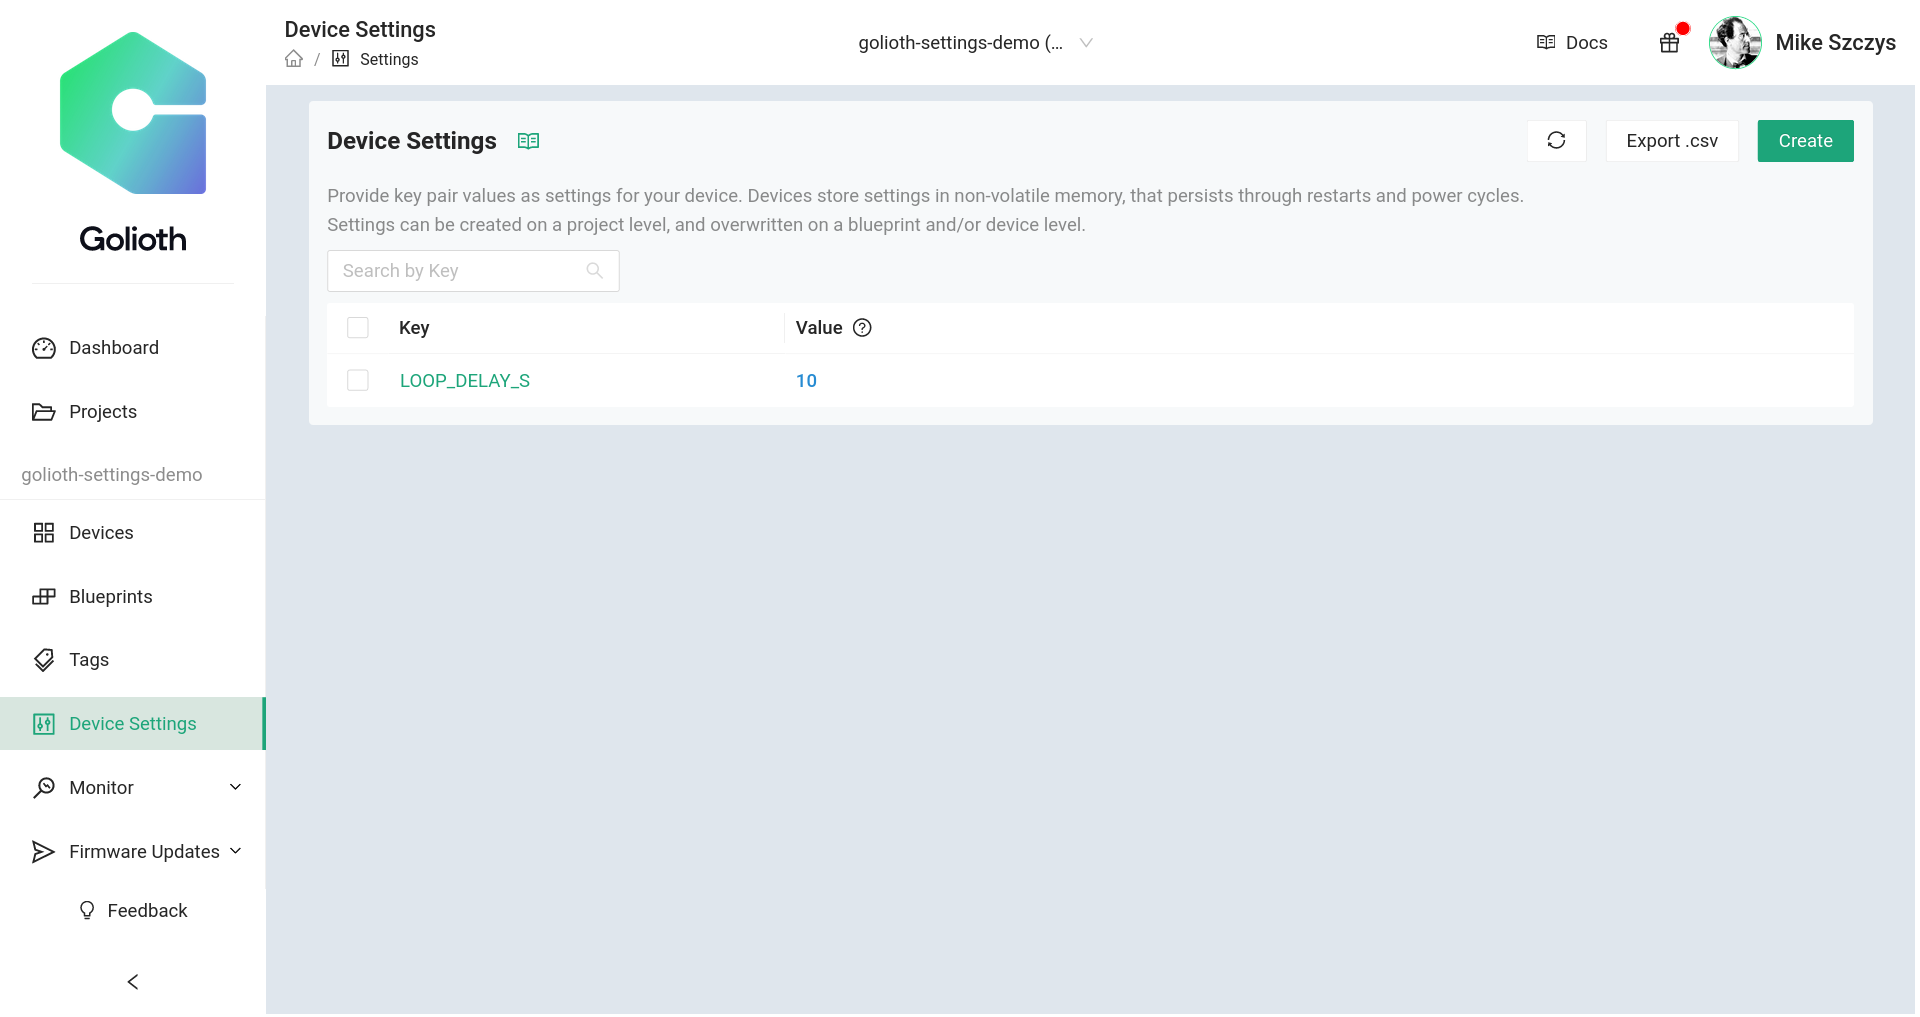
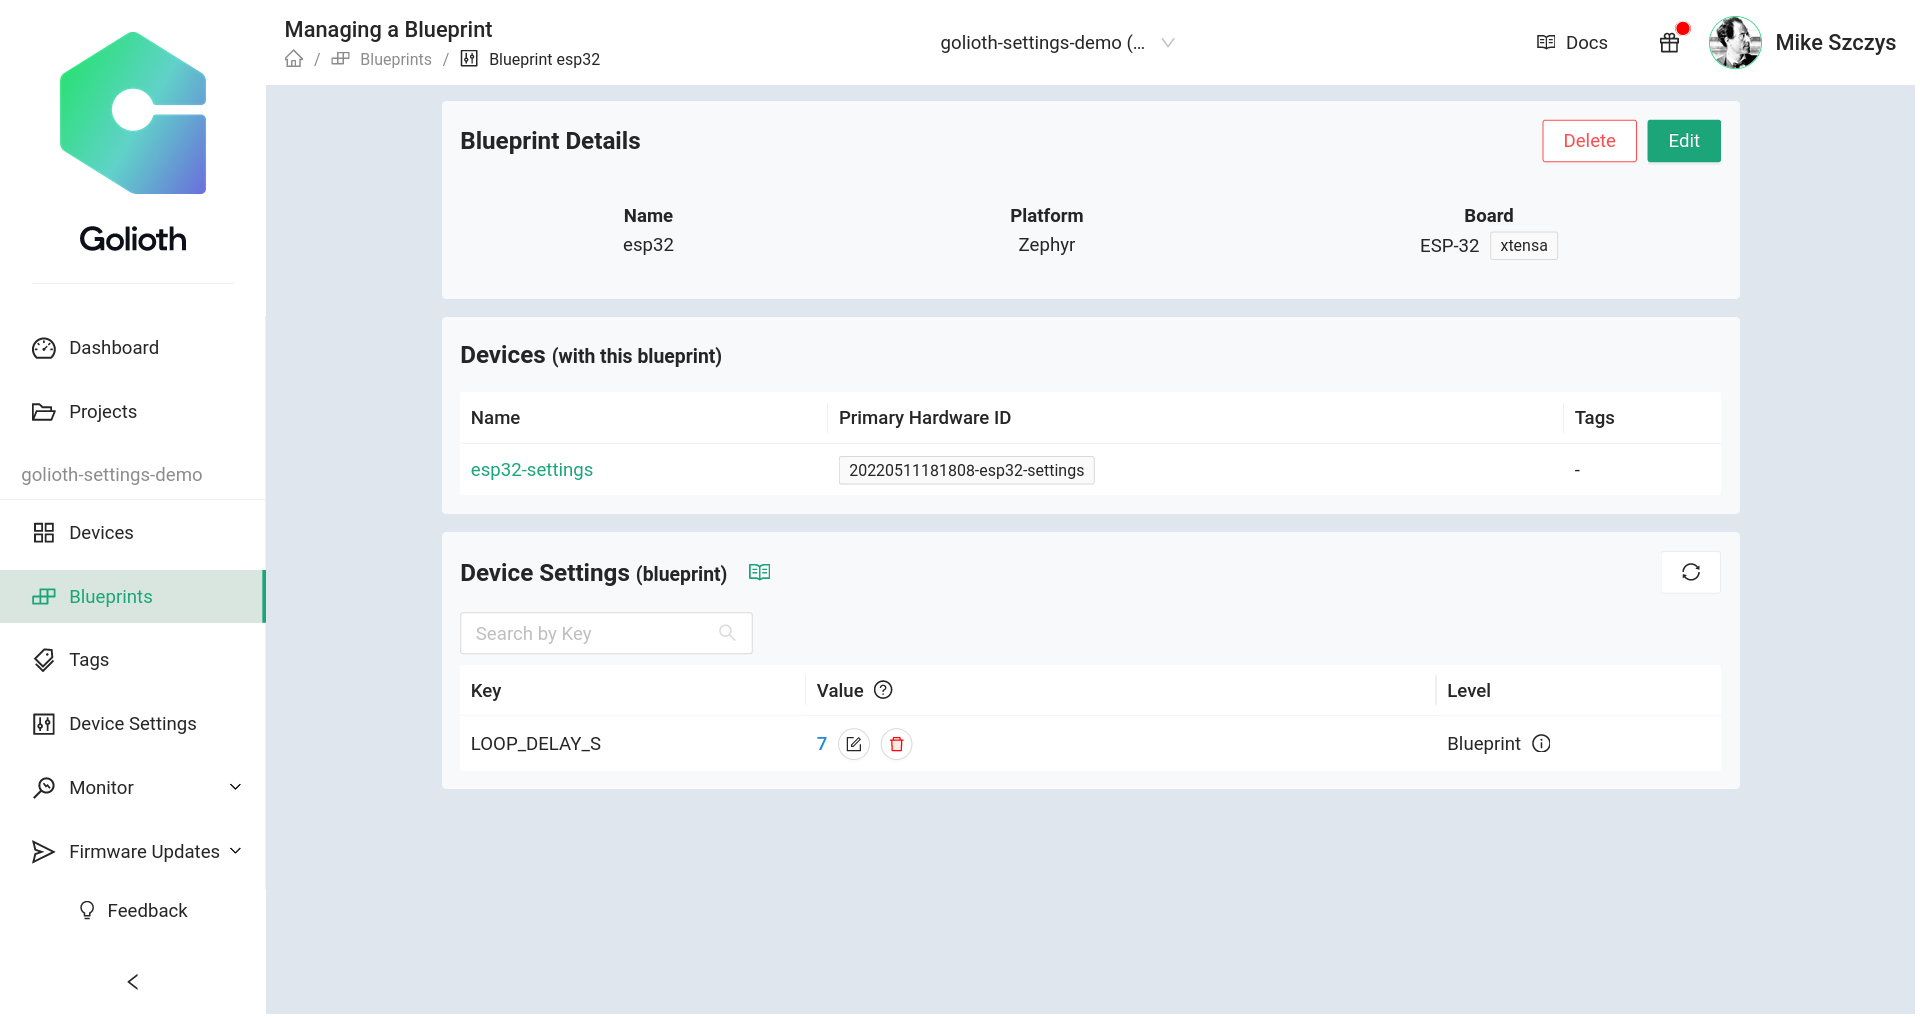
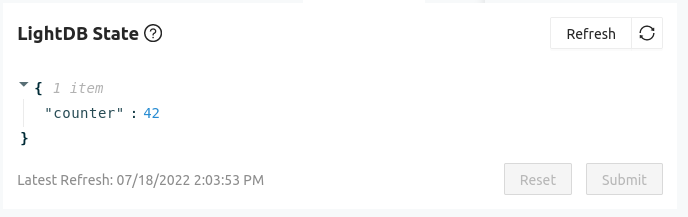
Viewing state data for this device, the counter variable is update at the same rate as the hello messages. In the Device Settings on the left sidebar of the console you can add LOOP_DELAY_S and remotely control how how many seconds the device pauses for between sending back these message. It’s a perfect way to control sensor reading frequency across your entire fleet.

Adding Golioth to existing Infineon PSoC™ 6 projects

The Golioth example that is part of ModusToolbox™ is a great blueprint for adding device management to your PSoC™ 6 projects. We’d love to hear what you’re build, and if you need some help we’re here to lend a hand. Show off your successes and post questions on the Golioth forum. Feel free to reach out to the Golioth Developer Relations team to set up a demo or discuss the needs of your IoT fleet.

The Golioth Zephyr SDK is now 100% easier to use. The new v0.4.0 release was tagged on Wednesday and delivers all of the Golioth features with less coding work needed to use them in your application. Highlights include:

  • Asynchronous function/callback declaration is greatly simplified
    • User-defined data can now be passed to callbacks
  • Synchronous versions of each function were added
  • API is now CoAP agnostic (reply handling happens transparently)
  • User code no longer needs to register an on_message() callback
  • Verified with the latest Zephyr v3.2.0 and NCS v2.1.0

The release brings with it many other improvements that make your applications better, even without knowing about them. For the curious, check out the changelog for full details.

Update your code for the new API (or not)

The new API includes some breaking changes and to deal with this you have two main options:

  1. Update legacy code to use the new API
  2. Lock your legacy code to a previous Golioth version

1. Updating legacy code

The Golioth Docs have been updated for the new API, and reading through the Firmware section will give you a great handle on how everything works. The source of truth continues to be the Golioth Zephyr SDK reference (Doxygen).

Updating to the new API is not difficult. I’ve just finished working on that for a number of our hardware demos, including the magtag-demo repository we use for our Developer Training sessions. The structure of your program will remain largely the same, with Golioth function names and parameters being the most noticeable change.

Consider the following code that uses the new API to perform an asynchronous get operation for LightDB State data:

/* The callback function */
static int counter_handler(struct golioth_req_rsp *rsp)
{
    if (rsp->err) {
        LOG_ERR("Failed to receive counter value: %d", rsp->err);
        return rsp->err;
    }

    LOG_HEXDUMP_INF(rsp->data, rsp->len, "Counter (async)");

    return 0;
}

/* Register the LightDB Get callback from somewhere in your code */
static int my_function(void)
{
    int err;
    err = golioth_lightdb_get_cb(client, "counter",
                                 GOLIOTH_CONTENT_FORMAT_APP_JSON,
                                 counter_handler, NULL);
}

Previously, the application code would have needed to allocate a coap_reply, pass it as a parameter in the get function call, use the on_message callback to process the reply, then unpack the payload in the reply callback before acting on it. All of that busy work is gone now!

With the move to the v0.4.0 API, we don’t need to worry about anything other than:

  • Registering the callback function
  • Working with the data (or an error message) when we hear back from Golioth.

You can see the response struct makes the data itself, the length of the data, and the error message available in a very straightforward way.

A keen eye already noticed the NULL as the final parameter. This is a void * type that lets you pass your user-defined data to the callback. Any value that’s 4-bytes or less can be passed directly, or you can pass a pointer to a struct packed with information. Just be sure to be mindful of the memory allocation lifespan of what you pass.

All of the asynchronous API function calls follow this same pattern for callbacks and requests. The synchronous calls are equally simple to understand. I found the Golioth sample applications to be a great blueprint for updating the API calls in my application code. The changelog also mentions each API-altering commit which you may find useful for additional migration info.

The Golioth Forum is a great place to ask questions and share your tips and tricks when getting to know the new syntax.

2. Locking older projects to an earlier Golioth

While we recommend updating your applications, if you do have the option to continue using an older version of Golioth instead. For that, we recommend using a west manifest to lock your project to a specific version of Golioth.

Manifest files specify the repository URL and tag/hash/branch that should be checked out. That version is used when running west update, which then imports a version of Zephyr and all supporting modules specified in the Golioth SDK manifest to be sure they can build the project in peace and harmony.

By adding a manifest to your project that references the Golioth Zephyr SDK v0.3.1 (the latest stable version before the API change) you can ensure your application will build in the future without the need to change your code. Please see our forum thread on using a west manifest to set up a “standalone” repository for more information.

A friendlier interface improves your Zephyr experience

Version 0.4.0 of the Golioth Zephyr SDK greatly improves the ease-of-use when adding device management features to your IoT applications. Device credentials and a few easy-to-use APIs are all it takes to build in data handling, command and control, and Over-the-Air updates into your device firmware. With Golioth’s Dev Tier your first 50 devices are free so you can start today, and as always, get in touch with us if you have any questions along the way!

Internet of Things (IoT) devices are meant to be out in the world, sending back sensor data and providing remote control for all kinds of automation. That provides an interesting challenge when you want to update the way the device operates. Updating device firmware Over-The-Air (OTA) is a critical feature of every IoT deployment.

While OTA updates go by a number of names (DFU, FOTA, etc.) Golioth specializes in making these features available and easy to manage for huge fleets made up of numerous different hardware variants.

OTA Is Difficult

We know what you’re thinking… your design is feature complete when manufactured, why update the firmware? Just kidding, we know you’d never say that. This isn’t about how well you can write the device code today. Including the ability to remotely update firmware will extend the service life of your products, whether it’s adding features you haven’t yet thought about, or patching security vulnerabilities that don’t currently exist. Everyone needs this!

So why aren’t firmware update features more common in embedded devices, especially those that are going to be IoT devices? In short: because it’s difficult!

When an engineer starts a new embedded project, it is almost always local to their development laptop or desktop. They compile and flash “hello world” to their embedded device and then try to get an LED blinking. If the engineer is starting with a simple main.c file and expecting to build things up from there, they need to layer on network stacks, IP handling, message parsing, and a bunch more just to talk to the internet. Then they need to set up the Cloud side of things. Maybe the engineer expects they can fetch from a file hosting service–not the best, but it works in a pinch. But what about managing the entire process? You could implement remote control to tell a device when to update, but that requires even more Cloud side code. Or you can choose to do device-side control that determines when and how to run an update. In both cases, you also need to understand how to properly interact with the device bootloader without bricking the device in the field.

When engineers have this many tasks to get OTA going, it’s no wonder this task is left for “some day”.

How Golioth Manages OTA Updates

As a device management cloud, Golioth delivers all of the tools you need for dependable OTA. That means associating new firmware binaries with specific hardware variants in your fleet, using a rollout process that informs the device a new version is available, and confirming the state of the currently running firmware. Among the most popular Golioth features is a one-click roll-back to previous firmware version.

Manage different firmware using device blueprints

Golioth is secure by default. Firmware is downloaded over an encrypted connection, the signed binary is verified before upgrading, and devices validate that the new binary works before completely switching over.

Golioth OTA release management

Rollout (or roll back) a release with the click of a button. Device Tags filter which devices will get the update.

You can segment your fleet for early testing using our tagging feature. Then roll out new firmware to just a few devices to ensure all is well before taking the plunge on upgrading everything. When you need to troubleshoot a device, the history of its last update is readily available on the Golioth Console or via our REST API.

Take Golioth OTA for a test drive

With Golioth’s Dev Tier, your first 50 devices are free. That’s more than enough to test out OTA, alongside all the other fun features of Golioth like time-series data, the device settings service, and remote procedure calls.

Currently you can choose from two different Golioth SDKs: Zephyr or ESP-IDF.

Golioth OTA using Zephyr

The Golioth Zephyr SDK is a cross-platform solution that currently offers first-class support for the nRF9160 (cellular), mimxrt1060-evkb (Ethernet), ESP32 (WiFi). Any device that uses Zephyr as the Real Time Operating System (RTOS) and uses MCUboot as the bootloader should work with Golioth.

Device serial output shows new firmware release detected, downloaded, updated, and verified after reboot.

Begin with the Golioth Quickstart that will walk through the process of signing up for the Dev tier. Move on to the hardware section to install and configure a Zephyr workspace. Then checkout the DFU (device firmware update) sample from our SDK.

Golioth OTA using ESP-IDF

Anyone working with devices from Espressif should consider using the Golioth ESP-IDF SDK. It currently offers first-class support for all chips in the ESP32 family.

Begin with the Golioth Quickstart that will walk through the process of signing up for the Golioth Dev tier. Move on to the hardware section to install and configure an ESP-IDF workspace. Then checkout the golioth-basics sample from our SDK which includes a well-commented example for using the OTA feature.

Managing firmware update is a critical piece of IoT

Problems on one device sitting on a workbench can be solved by plugging in a cable and updating the firmware directly. One thousand devices spread out over a country (or even merely separated from that firmware engineer) is a very different problem. The ability to update devices in the field means you’re not sending your coworkers to tilt at windmills in faraway lands.

Building and maintaining an OTA system is not a trivial operation, and at Golioth we pour our time and energy into getting it right. This means building with time-tested, industry leading open-source tools like MCUboot, and leveraging our vast experience in the IoT industry to plan for challenges long before you face them.

Give our Dev Tier a try and you’ll be up and running before you know it. Stop by our Forums, our Discord, or send us an email if you get stuck.

“Internet of Things (IoT) Devices send sensor data back to the Cloud.” When I try to simplify the field of IoT for people outside the industry, that’s my go-to definition. There are, of course, other reasons to use IoT devices, but many IoT applications are about putting a sensor into the field and then taking action based on the sensor data.

At Golioth, we believe this means you need a very reliable way of reporting data back to your Cloud platform. We solve this with a feature called “LightDB Stream”. The feature is purpose built for collecting time-based data from devices in the field. In this article, we’re going to talk about how it works and how you can put it to use in your next project.

A world before LightDB Stream

In my pre-Golioth days, I didn’t think much beyond the process of getting sensor data off of the device. I knew I needed to send a reading like “temperature” to the Cloud, maybe to something like an MQTT broker. After that, it wasn’t really my concern…right?

The piece I didn’t understand was that an MQTT broker would not be enough. Brokers handle things like routing of data and allowing you to publish or subscribe (Pub/Sub) to data streams passing through the broker. The missing piece is that something needs to be “subscribed” to a particular device’s data stream to observe new readings and then registering that data into a database. Otherwise, the data inside the broker will expire, depending on the caching setting of the broker. If I want to look at data from 1 hour, 1 week, or 1 month ago, there’s no way to query that data without a database synchronized to the time it was reported.

As a hardware engineer, I don’t really understand databases or SQL queries, nor do I have much interest in learning it just to enable a temperature reading on the Cloud.

How Golioth solves theses problems

Golioth’s LightDB Stream collapses the problem down into one action: send data to the Golioth Cloud. As soon as that data hits our servers it is timestamped and placed into a database.

Using the Golioth Device SDK means you only need to understand the high level function to send data. Everything else happens “under the hood”: the SDK authenticates the device to the Cloud, ensures the data is correctly formatted, sends the data out to the endpoint, and uses error checking to ensure the data was sent properly.

Let’s look at how the high-level function calls are used when you build on top of Golioth SDKs

LightDB Stream using Zephyr RTOS

Your app will set the path to the LightDB Stream endpoint, telling the function that we’ll be sending JSON. You then send a string that has all of the information relevant to that endpoint (more on that below). The API includes both synchronous and asynchronous functions for sending data. The async functions include a callback function you can use for error checking (to ensure that the data was sent properly) and post processing. Check out the LightDB Stream Example on the Golioth Zephyr SDK.

err = golioth_stream_push_cb(client, "temp",
                 GOLIOTH_CONTENT_FORMAT_APP_JSON,
                 sbuf, strlen(sbuf),
                 temperature_push_handler, NULL);
The Golioth Zephyr SDK also includes the option to send your sensor data using CBOR encoding. This is an alternative to JSON which serializes the data stream to a more compact form to save battery (less radio-on time) and bandwidth (fewer bits being transmitted).

LightDB Stream using ESP-IDF

Our ESP-IDF SDK has an even simpler implementation of writing to the LightDB Stream endpoint: it’s a single line.

If you want to try it yourself, check out the golioth_basicsexample in the Golioth ESP-IDF SDK. Line 190 of the file app_main.cis all you need to actually post integer data to the Cloud, in addition to the libraries included with the SDK.

// LightDB Stream functions are nearly identical to LightDB state.
golioth_lightdb_stream_set_int_async(client, "my_stream_int", 15, NULL, NULL);

LightDB Stream using your own solution

For the extra ambitious out there, you could roll your own device side code that allows you to connect to Golioth. This is the kind of work our wonderful firmware team does whenever they spin up a new SDK. Some of the required elements include:

  • mbedtls in order to create a DTLS connection to the Golioth Cloud
  • A CoAP library
  • (optional) a CBOR library to encode the data

We hardly ever recommend doing this unless you are a very advanced user. Instead, our existing SDKs cover a wide swath of parts, ecosystems, and Real Time Operating Systems. If you are interested in one we don’t already cover, please let us know.

Customize data sent to LightDB Stream

Once you have the basic LightDB Stream setup done, you will want to customize the data you’re sending to best fit your IoT product’s needs.

Formatting data

Another benefit of Golioth’s LightDB Stream, is the “flat” nature of the database implementation. Users are able to define their own data structure and change it on the fly. For instance, here is a JSON string from a recent example I was working on:

{"imu":"accel_x":-8.043840,"accel_y":0.114912,"accel_z":-4.711392,"orientation":"tipped"},"weather":{"temp":29.080000,"pressure":100.322167,"humidity":31.941406},"gas":{"co2":426.000000,"voc":3.000000},"distance":{"distance":1.548000,"prox":0.000000,"level":0.000000}}

I am sending that formatted string from a device on a regular interval, with the various sensor readings inserted. Here is that same data in a more viewer friendly format on the LightDB Stream viewing page on the Golioth Console:

The structure of the JSON allows me to organize my data in a way that represents the various sensors on-board the device in the field. There are 4 sensors, represented by the 4 nested sets of data. Later, if I wanted to implement battery monitoring, I could start to send to a .s/battery endpoint (instead of the .s/sensor endpoint) without any changes required on the cloud side. Data would start appearing in the database seamlessly.

Adding timestamp

As I mentioned above, LightDB Stream automatically appends a timestamp when data is received at the Cloud endpoint. For most live devices, this works great: the time between when the device sends a packet and when it’s received on the Cloud is close enough that the datapoint mimics reality. But other times, this needs to be more precise. If my device is waking up for a sensor reading once per hour, but only sending data to the Cloud every 12 hours, those 12 readings being sent will all have the same timestamp and won’t represent reality.

Instead, we make it easy to append a local timestamp to any datapoint you’re sending to the Golioth Cloud. Just include a timestamp in your JSON packet and Golioth uses that field as the timestamp in the database.

We used this to great effect in our Orange Demo, which caches GPS readings and then sends them to the Cloud all at once. GPS also supplies a very accurate timestamp with each reading, making it easy to pass through to the Cloud. This way we can chart precise location, even when the sensor was out of network range for a period of time. We will discuss displaying LightDB Stream data in the next section.

Working with the output

The final piece of working with LightDB Stream is taking action on the data once it has successfully made it to the Cloud.

The most obvious approach is to use our Output Streams to send that data to a 3rd party platform like AWS SQS, Azure Event Hub, or Google Pub/Sub. These allow your Cloud teams to ingest data when they’re ready for it, and using Queues as the input mechanism ensures they won’t miss datapoints during high traffic times. In a more general use case, Webhooks allow users to export data in a similar manner to arbitrary visualization sites and other data ingestion engines.

It’s also possible to view the data directly using visualization platforms like Grafana. In this case, the visualization partner is actually querying the REST API (to gather data over a defined time period) or hooked into WebSockets (to get live data updates). This allows users to immediately view and take action on data.

Start using LightDB Stream Today!

All of our Device SDKs show how to use LightDB Stream with minimal code writing from the user. Just pass your sensor data up to Golioth and you’ll be on your way. Stop by our Forums, our Discord, or send us an email if you get stuck.

Building IoT systems is always a push and pull to find the balance between designs that are very rigid in their definition (hard to change later) and overly generalized (less useful for everyday development). Golioth Blueprints are a new concept which apply structure to the relationship between the Cloud and the Device. Blueprints enable more useful features throughout the life of an IoT deployment. In this post we’re going to talk about what a Blueprint is, and how it is used throughout Golioth to enhance capabilities for our users.

Flexibility is a blessing and curse

Golioth works on a wide range of hardware. That’s the blessing. We think it’s really important to meet hardware and firmware teams where they are. If a client requirement or a sourcing issue pushes you into a particular chipset + communication method, we want to support you. That’s why we have multiple SDKs, each of which can pull in a wide range of parts.

But when you “can do anything”, that means nothing is standardized. Data coming in from a temperature sensor is treated the same as data coming in from a motor controller. Firmware updates being deployed to a device in the field running on a Cortex-M7 can also be pushed to a device running on a Cortex-M0 (hardware tip: these are very different). So the curse is that the exercise of separating and protecting all of that data is left up to you. Your Cloud team might only want a piece of data or a variable, but the implications of a mistake in your data design could be severe for your very real hardware deployment.

As you’ll see below, Blueprints will help bridge the communication between the embedded team and the Cloud team. They add information that would normally be hidden somewhere, maybe in a hardware datasheet or an engineering team specification document. Like real blueprints, Golioth Blueprints help to map out how things should be built.

Why are Blueprints needed?

To put an even finer point on the topic of Blueprints, let’s discuss a real-world example. Imagine an environmental monitoring product that has the following in its Rev A version of hardware:

  • nRF9160 cellular SIP from Nordic Semiconductor (running dual Cortex-M33 processors)
  • BMP280 temperature/environmental sensor
  • 4 MB external SPI flash
  • Other supporting components

Due to sourcing issues, you can no longer get any of these parts. Yep, it’s that bad out there. Your Rev B (because you need to ship something to your customers) now has:

  • An nRF52840 processor (single core Cortex-M4)
  • A BG95 cellular modem
  • BMP680 environmental sensor
  • 8 MB of external SPI flash

In the Golioth NCS SDK, the coding differences are minimal, despite pretty extreme changes in the hardware. However, thanks to how Zephyr RTOS is set up, it will be a set of configuration files instead of completely rewriting the codebase.

This is standard fare during the chip shortage, which we wrote about last week. Some companies are taking extreme steps like this in order to continue shipping their products, basically supporting two divergent product lines that can achieve the same goals. The key point is that the software team/end customer/consumer of the data via your company’s app probably doesn’t care how the data gets from the physical world to the digital world, they just want the variables they’re looking at (ie. temperature) to be accurate.

Now that we have pretty different Rev A and Rev B boards, how do we keep everything straight when we’re maintaining these products?

Enter the Golioth Blueprint

Golioth Blueprint management menu on the Golioth Console

The Golioth Blueprint is a description of all of the relevant things on target devices. As the Blueprint continues to mature in the coming months and years, we will evolve the types of data stored in the Blueprint. For now, we lean on board definitions that are in Zephyr. For the above screenshot, you can see that we are using the Sparkfun Thing Plus nRF9160 (based on the CircuitDojo nRF9160 Feather), which is indexed on the Zephyr website and in the Zephyr/NCS codebase.

From the meta data provided by Zephyr, we can pull in things like the target chipset, memory amount, how it’s mapped, peripherals that are available, and even external sensors that are on board (an accelerometer). If you have your own board definition upstream in Zephyr, you would also see that in the Golioth Blueprint list. We are working on other ways to pull in formatted metadata around customized boards that might need to stay private. If you’re interested in that, please email us.

If you don’t have a Blueprint, say because you’re using our ESP-IDF SDK instead of Zephyr, or a completely different platform, that’s OK too. You can assign a placeholder Blueprint name to help delineate between your different hardware builds. Generally, you are not required to use a Blueprint when you are on the Golioth Console, but there are many benefits to doing so. Let’s look at some.

Over-the-Air Firmware Update

Golioth users can assign a Blueprint to their firmware updates:

Doing so means that the Firmware Release will only target a specific subset of devices. If we go back to the example above, this could be critical when the target devices have completely different processors on board; firmware built for an nRF9160 will not work on an nRF52840! Attaching a Blueprint, even without attaching additional meta information (from Zephyr board files) still allows you to track which devices are receiving updates. Memory structure information will be used for future releases, being able to target different artifacts to different segments of memory.

Settings

Our recently released Settings service uses Blueprints to deliver different settings to different devices. As a reminder, settings can apply on the following levels:

  • Project
  • Blueprint
  • Individual device

To use our example from above, you might want to have different setting when different sensors attached to your device. You could set something like “UPDATE RATE” for the project to be every 30 seconds, but maybe you want to have the Rev A boards report in twice as often because you want to average the readings on the Cloud.

If you click into a Device Management page (looking at a specific device), you will see how the settings are being applied by Project, Blueprint, or on that specific device.

Future plans for structured data

We are currently very flexible on the sensor data you are sending back over LightDB State and LightDB Stream. In the future, we hope to be able to extract sensor data from your Blueprint to have our Cloud intuitively understand the types of data that is received from your fleet. Users will benefit from being able to chart data and export to other platforms knowing that a reading is a temperature or another fixed type of reading.

Using Blueprints effectively for your next project

Golioth Blueprints are an enhancement that allows our users to keep track of the hardware they are communicating with in the field. As users’ fleets and number of SKUs grow, this will be a critical aspect to any device management platform.

Try out Golioth Blueprints today on the Golioth Console. If you need any help or would like to discuss the idea more, we have a forum, a Discord, and we can be reached at [email protected].

Today we’re announcing a new feature on the Golioth Console and on our Device SDKs that enables Remote Procedure Calls (RPCs) for all users on the platform. From the cloud, you can initiate a function on your constrained device in the field, ensure the device received and executed the command, and receive a response from the device back to the Cloud.

What is a Remote Procedure Call (RPC)?

A Remote Procedure Call allows you to call a function on a remote computing device and optionally receive a result. An easy way to think about it is you’re calling a function, like you would in any other program…you’re just doing it from another computer. In this case, you’re triggering actions from the Golioth Cloud.

RPC from the Golioth Cloud (Console)

Each device in your project has a page where you can view details about things like LightDB State, LightDB Stream, Settings, and now RPC. Our Console includes an interface to directly send RPCs to the remote device. The URL will look something like:

https://console.golioth.io/devices/<YOUR_DEVICE_ID>/management/rpc

In all of our examples, we are sending an RPC to single devices. However, they can also be triggered from the REST API. As a reminder, any function you see on the Golioth Console is available on the REST API.

One critical function of RPCs is a confirmation that the remote function has actually run. The device firmware needs to send back a success message that the function has completed, and optionally a returned value. When there is a problem connecting with your device and the RPC does not complete successfully, you will see a screen that looks like this:

An RPC sent to a device that was disconnected from Wi-Fi

Also note that round trip time is measured for all RPCs, including successful ones. Transit times will depend upon your connectivity medium, in addition to the processing time of the function on the remote device.

When an RPC successfully completes, you can click the button with 3 dots to receive the returned value. In the example and in the video, we were using a method called double that takes an integer input, multiplies it by two, and then returns the value to the Cloud. Below, you can see the result when we sent “double” method with a parameter of “37”.

RPC from the Device SDK perspective

Any new feature on Golioth has Device SDK support, in addition to the new APIs and UIs on our Web Console. Earlier this week, Nick wrote about how we test hardware and firmware at Golioth, especially when a new feature is released across the platform. Now that we support 3 SDKs (Zephyr, NCS, ESP-IDF), the testing area has increased.

In the video, the focus is on ESP-IDF, which has a simple way to set up and respond to new RPCs. First, we register the new method, so we’ll recognize the command coming from the Golioth Cloud:

The function that we tie to that newly registered RPC needs to return the RPC_OK variable for the Cloud to be alerted that the function has processed properly.

If you have satisfied these requirements in the ESP-IDF SDK and copied the format, you can customize logic to do whatever task you’d like on the remote device. Let’s look at some examples.

Use cases for an RPC

The double() example is a simple showcase of the minimum requirements to create an RPC in the ESP-IDF SDK. We send a command and a value, we return a modified value.

The remote_reset command we created and showcased in the video is more like a critical function you would want to add to your project. When you want to trigger a remote function like a reset, you want to ensure that the command was properly received, that the function executed, and then that there was output data that validated the reset has happened. In the final point, that includes inferring that the device has restarted from the log messages also being sent back to the Golioth Console. Put all together, it’s a reliable way to tell the device has been reset.

Other use cases could be as simple as sending arbitrary text to a display. You would still want to know the text has been received and properly sent to the physical display. Or perhaps you have a valve and you want to be able to send an arbitrary value to the valve, but you also want to take a reading on an encoder that measures the distance the valve has moved.

Many of these functions could also be achieved with LightDB State (which the RPC service is built upon), but the context for creating an RPC is more targeted at situations like the examples above.

What will you build?

RPCs are another way for you to communicate with your constrained IoT devices from the Golioth Cloud and to get useful information back from your devices. You can start testing out this feature today.

For more questions or assistance, check out our Forums, our Discord, or drop us a note at [email protected].


Golioth just rolled out a new settings service that lets you control your growing fleet of IoT devices. You can specify settings for your entire fleet, and override those global settings by individual device or for multiple devices that share the same blueprint.

Every IoT project needs some type of settings feature, from adjusting log levels and configuring the delay between sensor readings, to adjusting how frequently a cellular connection is used in order to conserve power. With the new settings service, the work is already done for you. A single settings change on the Golioth web console is applied to all devices listening for changes!

As you grow from dozens of devices to hundreds (and beyond), the Golioth settings service makes sure you can change device settings and confirm that those changes were received.

Demonstrating the settings service

Golioth settings service

The settings service is ready for you use right now. We have code samples for the Golioth Zephyr SDK and the Golioth ESP-IDF SDK. Let’s take it for a spin using the Zephyr samples.

I’ve compiled and flashed the Golioth Settings sample for an ESP32 device. It observes a LOOP_DELAY_S endpoint and uses that value to decide how long to wait before sending another “Hello” log message.

Project-wide settings

On the Golioth web console, I use the Device Settings option on the left sidebar to create the key/value pair for this setting. This is available to all devices in the project with firmware that is set up to observe the LOOP_DELAY_S settings endpoint.

Golioth device settings dialog

When viewing device logs, we can see the setting is observed as soon as the device connects to Golioth. The result is that the Hello messages are now issued ten seconds apart.

[00:00:19.930,000] <inf> golioth_system: Client connected!
[00:00:20.340,000] <inf> golioth: Payload
                                  a2 67 76 65 72 73 69 6f  6e 1a 62 e9 99 c4 68 73 |.gversio n.b...hs
                                  65 74 74 69 6e 67 73 a1  6c 4c 4f 4f 50 5f 44 45 |ettings. lLOOP_DE
                                  4c 41 59 5f 53 fb 40 24  00 00 00 00 00 00       |LAY_S.@$ ......  
[00:00:20.341,000] <dbg> golioth_hello: on_setting: Received setting: key = LOOP_DELAY_S, type = 2
[00:00:20.341,000] <inf> golioth_hello: Set loop delay to 10 seconds
[00:00:20.390,000] <inf> golioth_hello: Sending hello! 2
[00:00:30.391,000] <inf> golioth_hello: Sending hello! 3
[00:00:40.393,000] <inf> golioth_hello: Sending hello! 4

Settings by device or by blueprint

Of course, you don’t always want to have the same settings for all devices. Consider debugging a single device. It doesn’t make much sense to turn up the logging level or frequency of sensor reads for all devices. So with Golioth it’s easy to change the setting on just a single device.

settings change for a single device on the Golioth console

In the device view of the Golioth web console there is a settings tab. Here you can see the key, the value, and the level of the value. I have already changed the device-specific value in this screen so the level is being reported as “Device”.

[00:07:30.466,000] <inf> golioth_hello: Sending hello! 45
[00:07:40.468,000] <inf> golioth_hello: Sending hello! 46
[00:07:43.728,000] <inf> golioth: Payload
                                  a2 67 76 65 72 73 69 6f  6e 1a 62 e9 9c 17 68 73 |.gversio n.b...hs
                                  65 74 74 69 6e 67 73 a1  6c 4c 4f 4f 50 5f 44 45 |ettings. lLOOP_DE
                                  4c 41 59 5f 53 fb 40 00  00 00 00 00 00 00       |LAY_S.@. ......  
[00:07:43.729,000] <dbg> golioth_hello: on_setting: Received setting: key = LOOP_DELAY_S, type = 2
[00:07:43.729,000] <inf> golioth_hello: Set loop delay to 2 seconds
[00:07:50.469,000] <inf> golioth_hello: Sending hello! 47
[00:07:52.471,000] <inf> golioth_hello: Sending hello! 48

When I made the change. the device was immediately notified and you can see from the timestamps that it began logging at a two-second cadence as expected.

Golioth settings applied at the blueprint level

It is also possible to change settings for a group of devices that share a common blueprint. Here you will find this setting by selecting Blueprint from the left sidebar and choosing your desired blueprint.

Settings are applied based on specificity. The device-level is the most specific and will be applied first, followed by blueprint-level, and finally project-level. Blueprints may be created and applied at any time, so if you later realize you need a more specific group you can change the blueprint for those devices.

Implementation: The two parts that make up the settings service

Fundamentally, there are two parts that make our device settings system work: the Golioth cloud services running on our servers and your firmware that is running on the devices. The Golioth device SDKs allow you to register a callback function that receives settings values each time a change is made to the settings on the cloud. You choose how the device should react to these settings, like updating a delay value, enabling/disabling features, changing log output levels, really anything you want to do.

Don’t worry if you already have devices in the field. You can add the settings service or make changes to how your device handles those settings, then use the Golioth OTA firmware update system to push out the new behavior.

Take control of your fleet

Scale is the hope for most IoT companies, but it’s also where the pain of IoT happens. You need to know you can control your devices, securely communicate with them, and perform updates as necessary. Golioth has you covered in all of these areas. The new settings service ensures that your ability to change how your fleet is performing doesn’t become outpaced by your growth.

On Tuesday we announced the Golioth ESP-IDF SDK that delivers all of Golioth’s excellent features to ESP32 projects built on Espressif’s FreeRTOS-based ESP-IDF ecosystem. The APIs included in our SDK make it dead simple to set up an encrypted connection with Golioth and begin sending and receiving data, controlling the device remotely, sending your logging messages up to the cloud, and of course performing Over-the-Air (OTA) updates on remote devices.

Today we dive into the code as Nick Miller, Golioth’s lead firmware engineer, takes us on a guided tour.

What does Golioth ESP-IDF SDK deliver?

All of the best features of Golioth’s device management cloud are available in our ESP-IDF SDK. The set of APIs are quite clever and take all of the heavy lift out of your hands. This includes:

  • Set, get, and observe data endpoints on the cloud
  • Write log data back to the cloud
  • Handle Over-the-Air (OTA) firmware updates
  • API calls–in both synchronous and asynchronous options–to suit your needs

Setup: Install ESP-IDF and clone the Golioth repo

To get started you need have the ESP-IDF installed and clone the Golioth ESP-IDF SDK. Instructions are available in the readme of our git repository, and there is also a quickstart on our docs site.

Our new SDK is a component for FreeRTOS, the real-time operating system used by the ESP-IDF. It’s the same operating system and build tools you’re used to, with the Golioth SDK sitting on top so that your devices can interact with the Golioth servers.

Stepping through the Golioth-Basics example

The best way to test-drive is with the Golioth-Basics example that is included in the SDK. It demonstrates assigning Golioth credentials to your device, sending/receiving data, observing data, sending log messages, and performing over-the-air (OTA) firmware updates. The golioth_basics.c file is thoroughly commented to explain each API call in detail.

The example begins by initializing non-volatile storage, configuring a serial shell, checking for credentials, and connecting to WiFi. At that point we can start using the Golioth APIs.

Creating the Golioth system client

// Now we are ready to connect to the Golioth cloud.
//
// To start, we need to create a client. The function golioth_client_create will
// dynamically create a client and return a handle to it.
//
// The client itself runs in a separate task, so once this function returns,
// there will be a new task running in the background.
//
// As soon as the task starts, it will try to connect to Golioth using the
// CoAP protocol over DTLS, with the PSK ID and PSK for authentication.
golioth_client_t client =
        golioth_client_create(nvs_read_golioth_psk_id(), nvs_read_golioth_psk());

Everything starts of by instantiating a client to handle the connection for you. This client will be passed to all of the API calls so that the SDK knows where to send them.

Sending log messages

// We can also log messages "synchronously", meaning the function will block
// until one of 3 things happen (whichever comes first):
//
// 1. We receive a response to the request from the server
// 2. The user-provided timeout expires
// 3. The default client task timeout expires (GOLIOTH_COAP_RESPONSE_TIMEOUT_S)
//
// In this case, we will block for up to 2 seconds waiting for the server response.
// We'll check the return code to know whether a timeout happened.
//
// Any function provided by this SDK ending in _sync will have the same meaning.
golioth_status_t status = golioth_log_warn_sync(client, "app_main", "Sync log", 5);

Here you can see a log being written to Golioth. Notice that the client created in the previous code block is used as the first parameter. This logging call is synchronous, and will wait to ensure the log was received by the Golioth servers. There is also an asynchronous version available that provides the option to run a callback function when the log is received by Golioth.

Setting up OTA firmware updates

// For OTA, we will spawn a background task that will listen for firmware
// updates from Golioth and automatically update firmware on the device using
// Espressif's OTA library.
//
// This is optional, but most real applications will probably want to use this.
golioth_fw_update_init(client, _current_version);

OTA firmware updates are handled for you by the SDK. The line of code shown here is all it takes to register for updates. The app will then observe the firmware version available on the server. It will automatically begin the update process whenever you roll out a new firmware release on the Golioth Cloud.

Sending and receiving data

// There are a number of different functions you can call to get and set values in
// LightDB state, based on the type of value (e.g. int, bool, float, string, JSON).
golioth_lightdb_set_int_async(client, "my_int", 42, NULL, NULL);
// To asynchronously get a value from LightDB, a callback function must be provided
golioth_lightdb_get_async(client, "my_int", on_get_my_int, NULL);

The bread and butter of the IoT industry is the ability to send and received data. This code demonstrates asynchronous set and get functions. Notice that the get API call registers on_get_my_int as a callback function that will be executed to handle the data that arrives back from the Golioth servers.

A get command runs just once to fetch the requested data from Golioth. Another extremely useful approach is to observe the data using the golioth_lightdb_observe_async(). It works the same way as an asynchronous get call, but it will execute your callback every time the data on the server changes.

Putting it all together

In the second half of the video, Nick takes us through the process running the demo. He starts with setting up the ESP-IDF environment and compiling to code, and continues all the way through to viewing the device data on the web console.

You’re going to love working with the Golioth ESP-IDF SDK. It’s designed to deal with all the complexity of securely connecting and controlling your IoT devices. The API calls are easy to understand, and they make it painless to add Golioth to existing and future ESP-IDF based projects. Give it a try today using our free Dev Tier.

We’d love to hear what you’re planning to build. You can connect with us on the Golioth Discord server, ask questions over on the Golioth Forums, and share your demos by tagging the Golioth account on Twitter.

One of the most useful services in the Golioth Zephyr SDK is the ability to observe data changes on the cloud. A device can register any LightDB endpoint and the Golioth servers will notify it whenever changes happen. If your device is a door lock, an example endpoint might be “lock status”, which you would want to know about a server-side state change immediately.

This is slightly more complex to set up than something like a LightDB ‘Set’ API call. ‘Observe’ requires a callback function to handle the asynchronous reply from the Golioth servers. Today we’ll walk through how to add Golioth LightDB Observe functionality to any Zephyr application by:

  1. Adding a callback that is called every time observed data changes
  2. Registering the callback with a data endpoint
  3. Ensuring thatgolioth_on_connect is registered with the Golioth client

These techniques are all found in our LightDB Observe sample code which acts as the roadmap for this article.

Prerequisites

Today’s post assumes that you already have a device running Zephyr and you have already tested out an app that uses the Golioth Zephyr SDK. If you’re not there yet, don’t worry. You can sign up for our free Dev Tier that includes up to 50 devices, and follow the Golioth Quickstart Guide.

Your Zephyr workspace should already have Golioth installed as a module and your app (probably in main.c) is already instantiating a Golioth system client. Basically, you should see a block like this one somewhere in your code:

#include <zephyr/net/coap.h>
#include <net/golioth/system_client.h>
static struct golioth_client *client = GOLIOTH_SYSTEM_CLIENT_GET();

If you don’t, checkout out our How to add Golioth to an existing Zephyr project blog post to get up to speed before moving on.

1. Add a callback function for observed data changes

The goal of this whole exercise is to enable your device to perform a task whenever data changes at your desired endpoint. Remember: Golioth LightDB endpoints are configurable by you! Whatever data you’d like to monitor, you can customize it to your needs.

The first thing we’ll do is create a callback function that will perform the task.

static int counter_handler(struct golioth_req_rsp *rsp)
{
    if (rsp->err) {
        LOG_ERR("Failed to receive counter value: %d", rsp->err);
        return rsp->err;
    }

    LOG_INF("Received: %.*s  Length: %d", rsp->len, rsp->data, rsp->len);

    return 0;
}

The callback receives an object (rsp) from Golioth containing the data, data length, and any error codes. The first portion of this callback checks the error code. Line 8 prints a log message that displays the data received, and it’s length.

If your endpoint contains more than just one value, it may be useful to parse the JSON object and store the values. Also keep in mind that this callback will execute on the golioth system client thread, which is a different thread than the “main” thread running your application. This means:

  • The callback function should return quickly (under 10 ms). If that’s not enough time, you can use a Zephyr Workqueue to schedule the work on another thread.
  • If access to global data is required, access to the data must be protected by a mutex to avoid data races between threads.

2. Registering the callback with a data endpoint

static void golioth_on_connect(struct golioth_client *client)
{
    int err = golioth_lightdb_observe_cb(client, "counter",
                     GOLIOTH_CONTENT_FORMAT_APP_JSON,
                     counter_handler, NULL);

    if (err) {
        LOG_WRN("failed to observe lightdb path: %d", err);
    }
}

Now we register the observation using the golioth_lightdb_observe_cb() API call. The parameters passed to this function include:

  1. The Golioth client object
  2. The endpoint to observe, “counter” in this case.
  3. The format, in this case we’ve chosen JSON. For CBOR, see the LightDB LED sample which demonstrates using CBOR serialization.
  4. The name of the callback function we created in the previous section
  5. An optional user_data value. This can be used to pass any 4-byte value which could be a discrete value, a pointer to some data structure, or NULL if you don’t need it.

Notice that we’re registering the observe callback inside of a golioth_on_connect() function. This is recommended as the observation will be re-registered any time the the Golioth client connects. Without this, your device may miss observed changes if its internet connection becomes unstable. Observed data is sent to the device at the time a callback is registered, and each time the data changes on the Golioth cloud.

3. Add the processing function to on_message

This step is small but important, and seems to be the one I frequently forget and then scratch my head when my callback isn’t working.

Whenever a message is received from Golioth, the Golioth system client executes a callback that we usually call on_message. For our observed callbacks to work, we need to tell on_message about our coap_replies array.

static void golioth_on_message(struct golioth_client *client,
                   struct coap_packet *rx)
{
    /*
     * In order for the observe callback to be called,
     * we need to call this function.
     */
    coap_response_received(rx, NULL, coap_replies,
                   ARRAY_SIZE(coap_replies));
}


By calling Zephyr’s coap_response_received(), the CoAP packet will be parsed and the appropriate callback will be selected from the coap_replies struct (if one exists).

4. Ensuring that golioth_on_connect is registered with the Golioth client

The final step is to make sure that the oberseve callback is registered each time the Golioth system client connects.

client->on_connect = golioth_on_connect;
golioth_system_client_start();

This should be done in main() before the loop begins. The golioth_client struct should have already been instantiated in your code, in this example it was called client. The code above associates our callback function and starts the client running.

Observed data in action

Now that we’ve tied it all together, let’s test it out. Here’s the terminal output of my Zephyr app:

*** Booting Zephyr OS build zephyr-v3.2.0  ***


[00:00:00.878,000] <inf> golioth_system: Initializing
[00:00:00.878,000] <dbg> golioth_lightdb: main: Start LightDB observe sample
[00:00:00.878,000] <inf> golioth_samples: Waiting for interface to be up
[00:00:00.878,000] <inf> golioth_samples: Connecting to WiFi
uart:~$ Connected
[00:00:11.191,000] <inf> net_dhcpv4: Received: 192.168.1.159
[00:00:11.191,000] <inf> golioth_wifi: Connected with status: 0
[00:00:11.191,000] <inf> golioth_wifi: Successfully connected to WiFi
[00:00:11.191,000] <inf> golioth_system: Starting connect
[00:00:13.042,000] <inf> golioth_system: Client connected!
[00:00:13.857,000] <inf> golioth_lightdb: Received: null Length: 4
[00:00:29.526,000] <inf> golioth_lightdb: Received: 42 Length: 2

You can see that at boot time, the observed data will be reported, which is great for setting defaults when your device first connects to observed data. In the above example, the endpoint did existon the Golioth cloud when teh device registered so a payload of null (with length 4) was returned. About 16 seconds later a payload of 42 is received. That’s when I added the endpoint and value in the Golioth Console.

On the cloud, this is an integer, but the device receives payloads as strings. You’ll need to validate received data on the device side to ensure expected behavior in your callback functions (beyond simply printing out the payload as I’m doing here). Give it a try for yourself using our LightDB Observe sample code.

Observing LightDB data gives your devices the ability to react to any changes without the need to poll like you would if you were using the golioth_lightdb_get() function. In addition to being notified each time the data changes, you’ll also get the current state when the observation is first registered (ie: at power-up). Single endpoints, or entire JSON objects can be observed, making it possible to group different types of state data to suit any need.

If you still have questions, or want to talk about how LightDB Observe works under the hood, head over to the Golioth Forum or ping us on the Golioth Discord.