How fast can a new Zephyr user go from zero to successful code compilation?

Golioth continues to invest in Zephyr RTOS capabilities: we have a super strong device SDK that works right on top of the Zephyr SDK, our Reference Designs are built on top of Zephyr, and we continue to train engineers every month on how to get booted quickly with Zephyr. When a fresh face walks through the door of our virtual training, we want to ensure a good experience for training.

In this talk at the Embedded Open Source Summit 2024, Firmware Engineer Mike Szczys describes how we utilize Dev Containers and GitHub Codespaces to provide a pre-installed Zephyr toolchain so that users have a seamless getting-started experience.

An evolution of training

Golioth has held a number of virtual training events using Kasm, something we have written about in the past (and gave a talk about at last year’s EOSS). We liked this method because it provided a pre-installed toolchain in a virtual environment. But it also included a “virtual desktop” environment and was built on top of generic “always on” cloud compute. Any time we did the training we would spin up new EC2 instances to serve users.

The problem is that the utilization was often low and we didn’t keep these resources available. Moreover, the users couldn’t take the work with them: when the session was over, their work was destroyed.

GitHub Codespaces fixes this up front: it’s a configuration script and setup that can deploy a full development environment onto a user’s own GitHub account. If someone wants to continue their work later in the day/week/month, they boot the Codespace back up and pick up where they left off. It’s also possible to utilize the setup to extend to their own projects, or implement interesting remote testing. And you can take it with you, because it’s build on the open standard of development containers.

Development Containers (or just: Dev Containers)

Utilizing Dev Containers only takes a couple of lines of configuration. However, understanding the pieces can be tricky, especially if you’re new to containers generally. Let’s peek at the main .devcontainer file:

{
  "image": "golioth/golioth-zephyr-base:0.16.3-SDK-v0",
  "workspaceMount": "source=${localWorkspaceFolder},target=/zephyr-training/app,type=bind",
  "workspaceFolder": "/zephyr-training",
  "onCreateCommand": "bash -i /zephyr-training/app/.devcontainer/onCreateCommand.sh",
  "remoteEnv": { "LC_ALL": "C" },
  "customizations": {
    "vscode": {
      "settings": {
        "cmake.configureOnOpen": false,
        "cmake.showOptionsMovedNotification": false,
        "C_Cpp.default.compilerPath": "/opt/toolchains/zephyr-sdk-0.16.3/arm-zephyr-eabi/bin/arm-zephyr-eabi-gcc",
        "C_Cpp.default.compileCommands": "/zephyr-training/app/build/compile_commands.json",
        "git.autofetch": false
      },
      "extensions": [
        "ms-vscode.cpptools-extension-pack",
        "nordic-semiconductor.nrf-devicetree",
        "nordic-semiconductor.nrf-kconfig"
      ]
    }
  }
}

The top 3 lines of the .devcontainer file we use for training includes 3 critical elements:

  1.  A base level image with Zephyr pre-installed on top of a minimal Linux environment
  2. Where to mount the local workspace folder inside this container
  3. The name of the workspace folder and where to drop the user when they boot a container

A critical element having the toolchain pre-installed on a Debian image. The nice part is that you can utilize others’ containers, including ours! If you want to customize containers for your own builds, you might need to learn some new items.

Other customizations allow you to set up how you’d like VS Code to look and which extensions you’d like to have available on boot.

Extending with onCreateCommand.sh

You can add other capabilities once the box has been initiated and is building. This includes pulling in repository information and setting up .bashrc elements that you might find useful from the command line.

#!/bin/bash

west init -l app
west update
west zephyr-export
pip install -r deps/zephyr/scripts/requirements.txt
echo "alias ll='ls -lah'" >> $HOME/.bashrc
west completion bash > $HOME/west-completion.bash
echo 'source $HOME/west-completion.bash' >> $HOME/.bashrc
history -c

It’s key that the west environment was set up in the initial container, because this now utilizes those tools just like you would when setting up a local Zephyr environment on your computer using our docs.

Binary Downloads As The Main Output

If there’s one argument against this method, it’s that the output of the build is not directly loaded to your development board. We’re working on some capabilities to extend that (see the video for more details), but right now you need to download the binary (zephyr.hex) and load it to your board using a programming tool like nRF Connect For Desktop. That makes this method less optimal for rapid fire debugging. However, it’s possible to debug your program using GDB or something like Segger Ozone. It’s not the same “click to debug” experience that many hardware and firmware engineers are used to from vendor IDEs. We think the ability to get started in 60 seconds is worth the tradeoff.

Slides

View Mike’s slides below and watch the video for an in-depth look at how to create your own Codespaces installation and start with Zephyr today.

Visual Studio Code, colloquially known as VScode, is among the most popular integrated development environments (IDEs). Today we’re going to walk through the process of setting up ESP-IDF in VScode and using it to run Golioth device management example code on an ESP32.

Not everyone likes to live their lives hammering away at a command prompt. What we’ll cover today is another option which uses Espressif’s VScode extension (plugin) to largely automate how you work with the Espressif IoT Development Framework (ESP-IDF). That means nice buttons and interfaces to build, flash, and monitor applications for the ESP32 family of chips.

Installing VScode and the ESP-IDF extension

As a prerequisite you will need to have VScode installed. If you don’t, head over to the download page and do so now.

ESP-IDF VScode extension

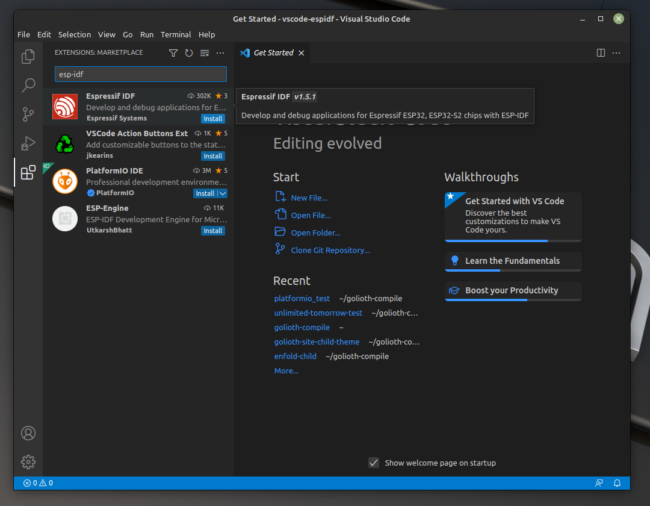
Open VScode and click on the extensions icon (looks like four boxes) on the left sidebar. Type esp-idf into the search bar that appears and the top result will be “Espressif IDF”. Click the install button and you’re off to the races.

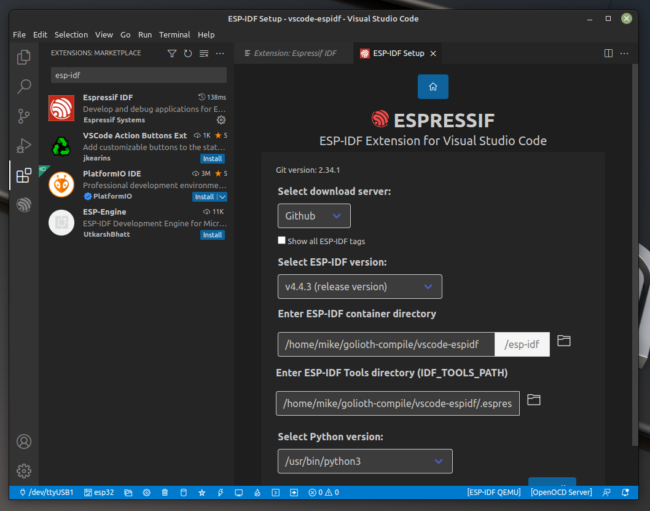
Configure ESP-IDF VScode Extension

You will be greeted with options for installing the various ESP-IDF tools. If you don’t have an opinion on how things are installed you can choose the automatic route. I wanted to specify what directories were used during the install so I chose the manual route and used the settings above.

It will take a few minutes for everything to download. You will want to click on the “Download ESP-IDF Tools” to ensure that the compilers and other tools are downloaded (in addition to the Espressif SDK). If you need more help, check out Espressif’s installation guide.

Installing the Golioth Firmware SDK

Now that VScode and the ESP-IDF are installed, let’s take a moment to install the Golioth Firmware SDK. This provides the tools and sample code for connecting your ESP32 to Golioth.

Cloning the Golioth Firmware SDK

VScode has a handy tool for cloning git repositories. Bring up the command palette (ctrl-shift-p), type in gitcl, and press enter. A prompt will open in the same window for you to enter the following URL:

https://github.com/golioth/golioth-firmware-sdk.git

After pressing enter, a window will open where you can select a folder to store the repository. A folder called golioth-firmware-sdk will be placed in that location.

VScode will ask if you want to open the cloned repository. Please click Cancel on this window. The Golioth Firmware SDK supports multiple platforms and we will open the ESP-IDF specific directory in the next step.

Open the project and update the git submodules

Now that the repository has been cloned, let’s open the sample code in VScode. Click File→Open Folder and navigate to the golioth-firmware-sdk/examples/esp_idf/golioth_basicsfolder, then click Open.

The Golioth SDK includes a few packages as submodules and these must be updated before continuing. We’re going to use the terminal for this step. In VScode click Terminal→New Terminal. A terminal window will open in the golioth-basics folder. Type this command to update the submodules:

git submodule update --init --recursive

Type exit to close the terminal window.

Build, flash, and monitor the golioth-basics application

Now that everything is installed we get to see the ease of using an IDE.

ESP-IDF Build, Flash and Monitor

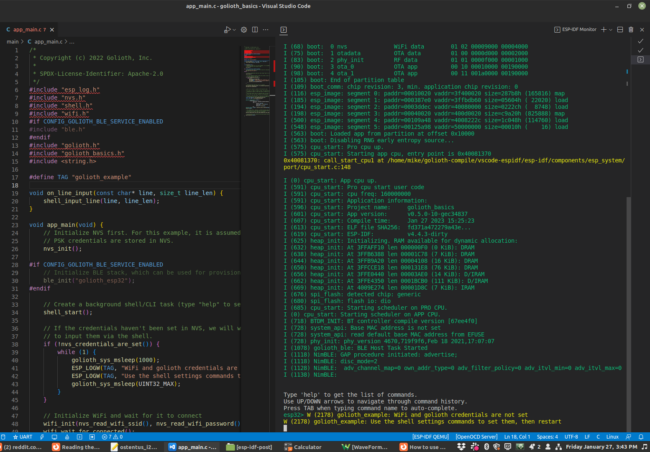
The bar along the bottom of the VScode window includes icons for working with the ESP-IDF tools. Make sure your ESP32 is plugged into USB. Click the flame-shaped icon which will build the project, flash it to the ESP32, and open a serial connection to the chip.

The build will take place and then VScode will open a window in the top center prompting you to select JTAG/UART/DFU. We will be using UART. Also note that there is a selection in the bottom menu bar where you can set the port that will be used when flashing (the image above shows /dev/ttyUSB1 in my case).

Assign device credentials in the monitor window

ESP32 running the golioth-basics app

The golioth-basics app will begin running immediately and you should see an output from the chip in a window inside VScode. We need to give the chip WiFi and Golioth credentials so that it can connect to the cloud.

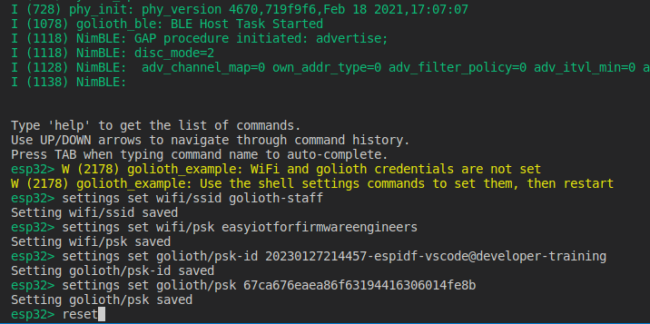
If you have not yet signed into Golioth, our Dev Tier is free for your first 50 devices. (Tip: there is a Console Overview on our docs that will walk you through creating a set of device credentials.) Get your Golioth credentials, and the login info for your WiFi access point, and pass them to the chip using this command format:

settings set wifi/ssid YourWiFiAccessPointName
settings set wifi/psk YourWiFiPassword
settings set golioth/psk-id YourGoliothDevicePSK-ID
settings set golioth/psk YourGoliothDevicePSK

assign credentials to the device

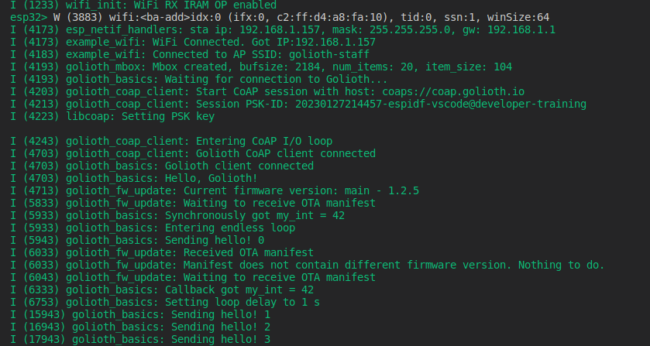
Once you’ve set the credentials, type reset and the ESP32 will reboot, connect to WiFi and then to Golioth.

Successful connection to Golioth

Wrapping up

You’ve successfully compiled, flashed, and run a demo Golioth application for ESP-IDF using VScode. The same principles can be applied to your own projects.

If you’d like to dig deeper into how the golioth-basics code works, I encourage you to study the golioth_basics.c file in the golioth-firmware-sdk/examples/common folder. It demonstrates all of the Golioth device management features like OTA firmware updates, remote procedure calls (RPC), IoT fleet settings service, LightDB State and LightDB Stream data services, and remote logging.

We’d love to hear about the projects your working on. Share your successes and post your question on the Golioth Forums. If you’re interested in learning how to add Golioth to your IoT fleet, get in touch with our Developer Relations crew.

References:


How do you ensure you achieve the lowest possible power with your Cellular IoT Devices? We held a webinar on January 18th, 2023 where we tackled this question, alongside our friend Jared Wolff of CircuitDojo. In this video, we review how to measure and optimize your hardware, firmware, and software. The main focus of this video is the nRF9160 from Nordic Semiconductor, which runs NCS / Zephyr. Jared shared many of the tips and tricks he has learned while building the CircuitDojo Feather nRF9160.

A three pronged approach

There are three key areas to focus on when trying to optimize your design for low power.

  • Hardware – Jared talked about the importance of part choice, especially on the switching regulator. The nRF9160 has a low quiescient current if everything is configured properly.
  • Firmware – In order to take advantage of the low current draw of the part in question, we need to understand and enable features within the nRF9160. This would be true of any part we chose to use, the configuration is crucial. Understanding how the cellular modem is communicating with the tower is another important step, since each time you ping the tower it takes energy to check in.
  • Software – In this case, we mean Cloud software, such as the capabilities that Golioth provides to its users. The Golioth platform enables efficiencies like CoAP communication and CBOR encoding, lowering the size (and power draw) of each packet you decide to send to the Cloud. Things like the Golioth Setting service allows you to enable and disable different modes on your device to achieve fine-grained control of devices in your fleet.

Take your design (and battery life) further

Golioth is focused on building better cellular IoT deployments. We enable engineers to build customizable and reliable device fleets that monitor and impact the world around them. If you need any help optimizing your fleet, let us know on our forum or drop us a note.

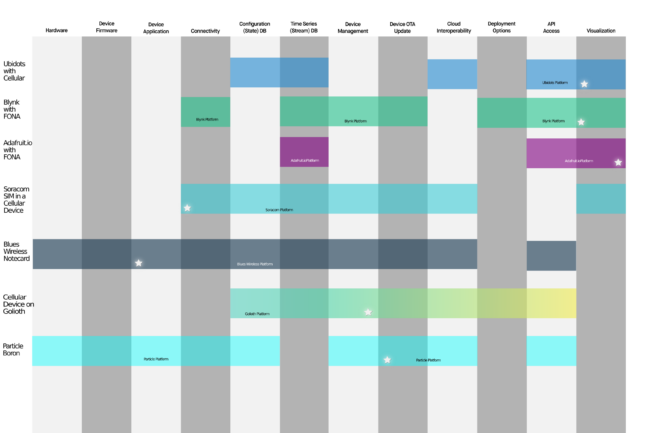
When I started at Golioth, I wanted to understand the service offerings from different companies in the space. What resulted, was a chart (below), slideshow (below), and a presentation I have now given a couple different times (video, above). All of these things showcase how I started to investigate and understand the inter-operating pieces of any modern Internet of Things (IoT) system.

Only 12 Layers?

Let’s start with the obvious: I could have chosen just about any number of layers to explain IoT systems.

I chose to highlight the pieces of IoT systems as someone working on building Reference Designs, which have a Device component and a Cloud component. I framed many of these capabilities from the perspective of my time at Golioth and the aspects of the system that I found to be crucial to a deployment. I wanted to understand the competitive landscape as a starting point (finding other companies providing IoT platforms) and expanded from there.

I stopped at 12, because that is roughly the amount I thought I could describe without audience members falling asleep. 12 layers also captures a good amount of functionality. However, it misses many other pieces of IoT implementation and very easily could have been the 100 layers of IoT.

The Chart

The true beginning of this talk was a diagram I created. It shows how I understood offerings from different IoT providers, with varying levels of “vertical integration” (how much of the solution they provide to their users). Some providers go all the way from the hardware up to the Cloud. Some provide key infrastructure pieces (like Golioth) and point you at external providers in order to give you more flexibility. Some are hyper specialized in one area.

The key idea was to point out that these providers exist and that there are different reasons to choose one over another. That is to say: each has a valid business proposition and fits a customer profile. One provider might serve an operations group that is looking to add connectivity to an existing business and simply spit data out onto the internet—many businesses want that. Other times, a technology group inside a larger product development company might be looking to supplement their product design capabilities and not do everything in-house. It’s important to understand the landscape as a design engineer evaluating what they should buy and what they should DIY. Each layer in the presentation has the pro’s and con’s of “Buy vs DIY”.

Beyond IoT Platform Providers

Unstated and unshown on the chart is the “DIY” of IoT subsystems. As mentioned in the video and slides, it’s possible that companies want to develop everything from the ground up and maintain all of their own IP. The downside is the high cost in terms of people and time, and often the “full DIY” method of developing is relegated to the largest companies looking to develop an IoT product.

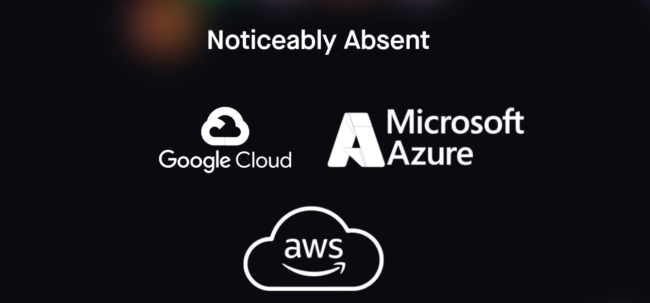
Others are utilizing building blocks from hyper-scalers like AWS and Azure. Sometimes this takes the form of using hyper scaler IoT platforms (AWS IoT, Azure IoT), and other times, they use even more basic computing elements in the cloud (EC2s, S3 buckets, Lambdas). In all these cases, there is a significant amount of “Cloud Software” that is written and maintained by the company looking to develop an IoT product.

How do the 12 Layers of IoT impact you?

These resources exist to help engineers and business people new to the IoT industry to understand how to create successful IoT deployments. Most importantly, this talk sought to remedy the problem of “you don’t know what you don’t know” (reference). If you don’t know about potential pitfalls in deploying an IoT solution and what you might need 2 or 3 years down the line, you won’t be able to take steps up front to prevent those problems.

A tangible example is in “layer 10”, which is listed as “deployment flexibility”. If you want to hire an IoT platform to get your deployment off the ground, but later will want to run your own cloud infrastructure, you need to choose different options when creating your system. Platforms like Golioth allow you to run your own cloud infrastructure as part of our Enterprise plan. Companies that don’t choose this path at the beginning of their deployment find themselves re-architecting their entire solution (all the way down to the hardware) at a later time in order to implement a bespoke cloud solution that fits their needs.

The Presentation

Below is a refined version of the talk that I gave at All Things Open in Raleigh NC in November 2022. Unfortunately that version of the talk wasn’t recorded, but the slides below are the most up-to-date version I have.

Did I miss a layer?

I am continually refining my concept of what comprises IoT deployments and the required pieces. It’s possible I missed out on something important. Maybe there are critical pieces of infrastructure that you think I glossed over. We’d love to hear your thoughts on our forum or on social media (Twitter, LinkedIn, Facebook).

The Internet of Things (IoT) can make existing infrastructure more useful and easier to operate, with the added benefit that you don’t need to be on-site to make changes. This is the case with Golioth’s latest reference design: a greenhouse controller that adjusts ventilation and grow lighting based on sensor readings. It also provides manual control from the cloud.

Whether it’s too hot or too cold, tightly monitoring and regulating greenhouse temperature has a huge effect on crop yield and growing time. The same can be said for lighting conditions. At this time of year (winter), consider the poinsettia: it requires intense light during the day, and at least 12 hours of total darkness over night in order to turn a vibrant shade of red. Sounds like a great job for an automated controller.

But think beyond one type of plant and one time of year. The agriculture industry uses automated control to implement different growing conditions based on the cultivar. A cloud-connected controller makes it much easier to update (and keep track of) the growth profiles.

The IoT Greenhouse Controller

An IoT Greenhouse Controller continues to show that simply connecting sensors to the internet is impactful. From one online dashboard you can see how the light, temperature, pressure, and humidity is trending across all of your planthouses. For this reference design we added two mains-rated relays to add control to the equation.

The cellular modem sends sensor data back to Golioth, and monitors the cloud for updates in target temperature and light intensity. A threshold setting for light level automatically controls when the grow lights are turned on or off. The same is true for a temperature threshold that is monitored for control of the ventilation system. Of course both of these relays can be controlled manually.

Let’s take a look at the hardware involved in this Reference Design

Hardware

We’re favoring off-the-shelf hardware for ease of implementation. Most of the modules that we use are simple breakout boards that aren’t much more than a sensor or two, some power handling, and interconnects like cabling. The idea is that someone could take this setup and choose which sensors they want to put onto their custom hardware design that will go out in the field.

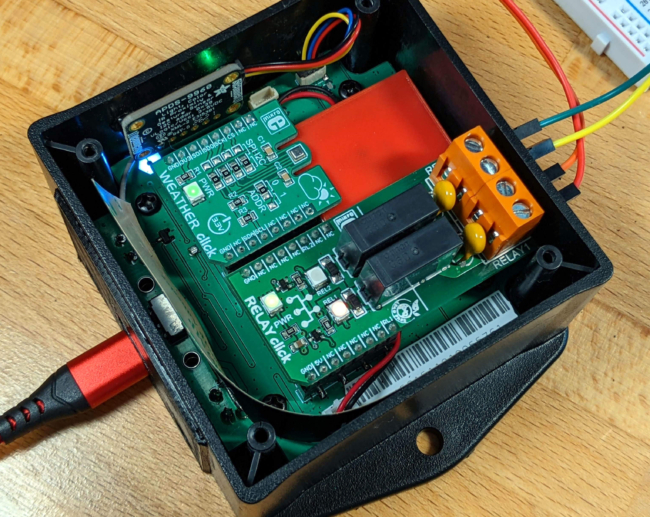
IoT Greenhouse controller internals

Golioth Greenhouse Controller reference design internals.
Left to right: light sensor, weather sensor, relays

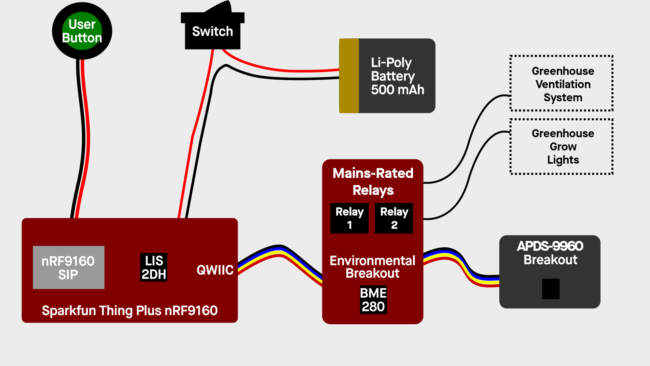
The full parts list is on our Golioth Projects page, but the key components involved are the Nordic Semiconductor nRF9160 cellular system-in-package (SIP), a BME280 weather sensor, an APDS9960 light intensity sensor, and a set of relays.

The nRF9160 was chosen because it is one of our best supported parts on Golioth. A cellular modem may seem like an odd choice for infrastructure-based controllers, but in combination with the lithium battery you will still be able to monitor greenhouse conditions during a power outage. There is no better peace of mind than being able to answer the question: when the power was out, how cold did my plants get and for how long?

As with many Golioth designs, our wide ranging SDK support means you can retarget the same control code to different hardware in the future. If you want to take the reference design and target a Wi-Fi, Ethernet, or Thread solution, it’s a couple of files configured differently and you have similar functionality with a whole new connectivity medium.

Greenhouse Controller block diagram

Firmware

The firmware for the Greenhouse Controller reference design uses the Golioth Settings Service. This is ideal as it facilitates control of a large fleet of these devices, allowing settings to be adjust for all at once, in groups, and of course down to individual units.

Golioth Settings Service for the Greenhouse Controller reference design

Golioth Settings Service for the Greenhouse Controller reference design

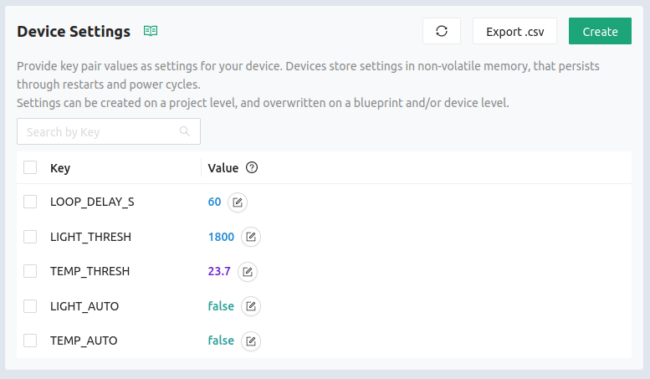
Here you can see the loop delay which indicates how long the device should sleep between sensor readings (in seconds). The light and temperature thresholds control the on/off point of the relays, and finally the auto settings indicate if the relays should be switched automatically based on those thresholds. The controller monitors Golioth’s LightDB state system for manual control commands, which do not interfere when the automated option is enabled.

All of the Golioth reference designs include Over-the-Air (OTA) firmware updates so changes to how the firmware works don’t require an on-site visit. While the current firmware doesn’t implement a schedule-based system, the concept is easy to add and install on the device using OTA.

Cloud Software / Dashboard

The Golioth Zephyr SDK takes care of the cloud connection for all of your devices. When writing firmware, just use the API to set/get/observe your data and Golioth handles the rest:

  • Sensor readings are stored as time-series data on LightDB Stream
  • Device settings are monitored in real-time, with the device reacting to your changes as soon as you make them.
  • The Golioth Console tracks the latest device state, including device health
  • Current firmware version is monitored, with the ability to rollout new OTA updates, and one-click roll-back if you need it
  • Golioth’s convenient REST API delivers easy access to the data for visualization or export to any of your favorite cloud server platforms.

We love using Grafana dashboards to visualize IoT data. The dashboard talks to the Golioth REST API to monitor the IoT sensors and the state of the lighting/ventilation. Of course you could use WebSockets to get live updates as the data arrives at the Golioth servers. For this application, it’s likely that sensor readings are being recorded every few minutes so a dashboard that reloads on its own works well.

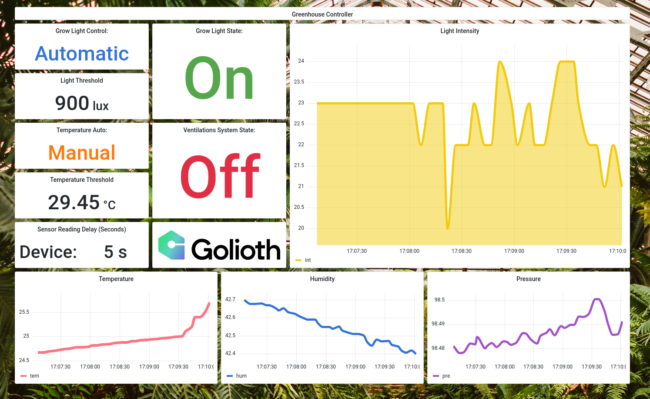
Golioth Greenhouse Controller Grafana dashboard

More Golioth Reference Designs

Our reference designs are meant to get you through the initial steps of proving out your IoT-based business. You can buy the readily-available parts used for this Greenhouse controller and with our reference design resources you’ll be on your way to a proof of concept in days instead of weeks. This means you’re fleshing out features and heading toward a hardware prototype with actual performance data. Golioth is designed to scale, so the same connections and features that you use for your first prototype remain in place, with a platform that can handle a number of devices beyond your wildest imagination.

We are busy building out more reference material for you to take and customize for your business needs. We recently launched an Industries section of the Golioth website, which lays out some of the other areas we are targeting and Reference Designs we are building. If any of them interest you, click the “Schedule Demo” button for the one that best matches your needs. You can also drop a note on our Forum or on our Discord if you have ideas of other IoT prototypes you need help with or would like to see us build.


Once your first device is online and talking back to the Cloud, your problems immediately start to multiply. As you go from one to ten to one hundred devices, you want to understand some basic information about all the devices in your fleet. This week we showcased how to visualize this data by creating a “Fleet View” in Grafana. Let’s look an how you can build one of your own.

Moving from a Device View to a Fleet View

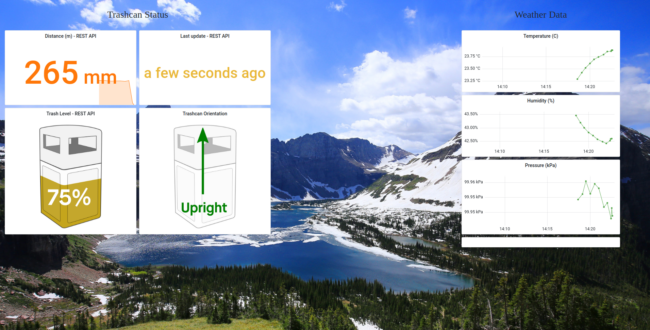
The example in the video uses the devices in a project related to the Golioth IoT Trashcan Reference Design. In that setup, we have a single device view so that we can visualize the depth of data coming off of the device:

Fig 1. “Device View” Dashboard

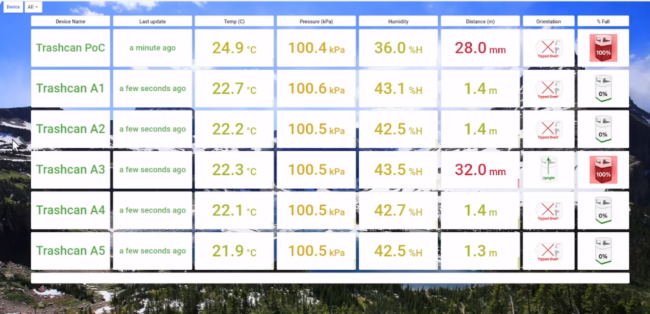
In the fleet view we take that individual device data and stretch it horizontally across the page for each individual device. From there, replicate each of the chosen boxes to get the same view for every device in a fleet, in this case it’s 6 devices. The resulting dashboard looks like this:

Fig 2. “Fleet View” Dashboard

The ability to replicate the setup across all the device in a fleet is built upon two elements of Grafana: creating a variable and using the ‘repeat’ option for each visualization element.

Creating a variable

We have posted about creating Grafana dashboards in the past. The first thing you need to do is set up a “data source” to configure Grafana to talk to the Golioth REST API. This is how you will extract the data that your devices are sending back to the Golioth Cloud. Each device has a unique ID that Golioth uses to coordinate data moving through the Golioth platform.

When we want to visualize more than one device in our system, we need to make it possible for Grafana to dynamically switch between the different Golioth Unique Identifiers for all the devices on your project. The first step is to create a variable in Grafana that represents all of the devices.

Click on the gear icon to access the “Dashboard Settings Menu” on the upper right of your dashboard (hit ‘esc’ if you don’t see anything on the upper right of your dashboard, your menu may be hidden).

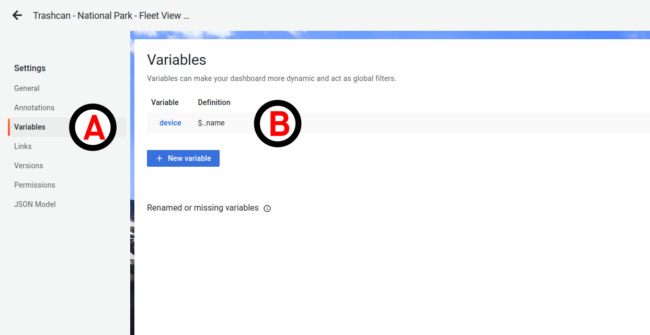
This will take you to the following screen, click on Point A to get into the variables menu and then click ‘+New Variable’ or click on the variable you want to modify at Point B.

Fig 3. Dashboard Settings Menu

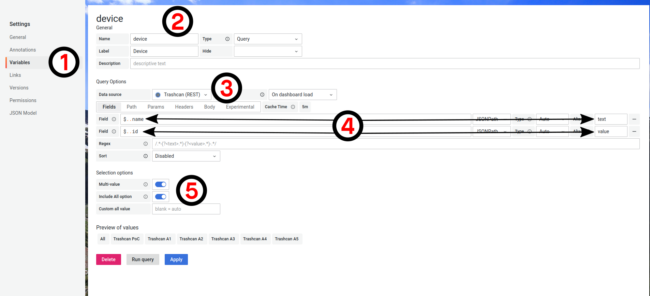
In the variable creation/editing menu, you can set a name (Point 2 in the image below). You will need to select your JSON API data source that connects you to the Golioth REST API (Point 3).

Under the ‘Path’ menu, you will need to do a GET request at the /devices/ end point (not shown). Then replicate the variables shown (Point 4) to pull back data from your project that includes an array of all device IDs in a project ($..id / value) and the associated names of all devices in your project ($..name / text).

Finally you will want to toggle Multi-Select and Include All Option (Point 5). This will give your dashboard a pulldown menu, as is showcased in the video above.


Fig 4. Variable creation menu

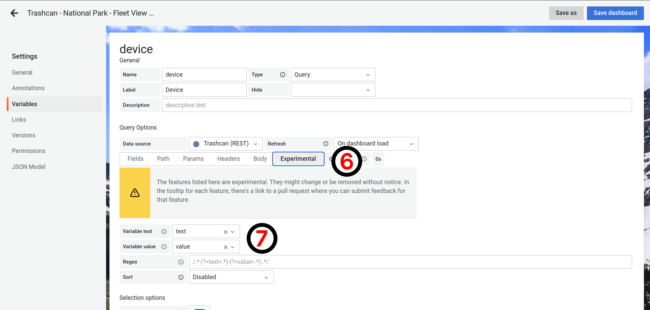
Finally, you need to set these newly created fields in the Experimental tab (Point 6) and set the “Variable text” and “Variable value” (Point 7).

Fig. 5 Variable Experimental Tab

You now have a variable you can work with in your project.

Creating a repeating element on your Fleet Dashboard

Each individual box shown in Fig. 2 is a Grafana “panel”, which means you can connect it to a data source and do some kind of visualization with it. Normally this is a chart, a dial, a displayed value, or an icon/graphic you assign to a state.

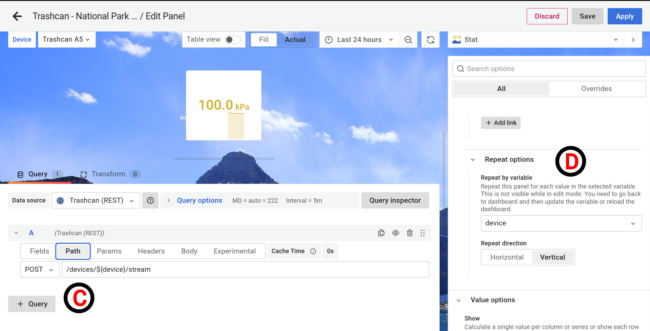
When you edit one of these panels, you need to change two things to enable “fleet view”. The first is to change the target on the Path tab (Point C) to point to the /devices/${device}/stream endpoint on the REST API. This will automatically change which set of device data we’re looking at when we change the pulldown in the upper left corner. As shown, it is looking up the Golioth Device ID for “Trashcan A5” and inserting that into the path in place of ${device}. See below for the code I have in the “Body” field that you can use as a model when doing a POST request to the REST API.

Next we want to modify the “Repeat options” on the right sidebar (Point D). I selected that we repeat based on all of the devices we have selected. I also selected that the “Repeat direction” is vertical so it stacks up the repeated panels on top of one another to get a view like in Fig. 2. See this in action with the associated YouTube video.

Fig. 6 Edit Panel View

{
    "start" : "${__from:date}",
    "end" : "${__to:date}",
	"perPage" : 999,
	"query": {
		"fields" : [
			{ "path": "time" },
			{ "path": "deviceId"},
			{ "path": "*"}
		],
		"timeBucket" : "5s"
	}
}

Build your next fleet with Golioth

In addition to the flexibility that a Grafana dashboard can provide, the Golioth Console acts as a more text-focused fleet visualization and control plane for your devices out in the field. We think you can understand a good amount about your devices simply from glancing at your project Console and seeing the state of each device.

We always want to hear about how we can improve the experience for our users. Please try out the Console with our free Dev tier and then stop by our Forum to discuss your fleet deployment!

DevCon22 was a 2 day event that Espressif held last month to showcase upcoming products from Espressif as well as external partner offerings. Mike and I (Chris), gave a talk about how  the Espressif IoT Development Framework (ESP-IDF) makes it really easy to add Golioth to your IoT projects.

The ESP32 line of Wi-Fi based devices deliver the internet connection, while the Golioth ESP-IDF SDK provides access to things like:

Golioth covers your hardware

Golioth supports multiple hardware ecosystems, and we expect to enable even more in the future! We’ve built everything firmware engineers need to seamlessly connect their devices to the Golioth Cloud. Our goal is to meet engineers where they work, and this often means working directly inside the ecosystems their projects are built upon.

We were excited to support the ESP-IDF, which is based off the popular FreeRTOS core. This open source Real Time Operating System (RTOS) is prevalent throughout the electronics industry, with ports into many different chip ecosystems. The Espressif team has taken the core capabilities and ported it to work across their growing catalog of components. They have also bundled a range of meta tools that includes the build system (idf.py), the programmer (esptool.py), and more.

The Golioth ESP-IDF SDK leverages the necessary components to immediately access the Golioth Cloud on Espressif devices. We use CoAP as a transport layer, so we include a CoAP library to allow your device to “talk” CoAP. Golioth is secure by default, so we also include an mbedtls library, to allow your packets to be encrypted (using your PSK-ID and PSK). The net result is that firmware and hardware engineers don’t need to worry about the low level details of connecting to our servers, instead you can utilize high level APIs shown in the presentation video. For anyone using ESP32, Golioth just works!

The challenges of scale

The core of the talk is to showcase Cloud technologies that make it easier to scale your fleet. If you’re the classic example of a startup in a garage, you probably aren’t planning to scale out to millions of devices. Even if the future is uncertain, it’s good to understand the capabilities that will make it easier to control your fleet, from 10 devices to 10 million devices.

We also want to make sure that firmware and hardware engineers don’t need to become Cloud engineers to enable these capabilities. The features described above and in the video are available by default, without any additional Cloud-side code required. This means engineers can start sending data to the Cloud immediately and focus on the higher value tasks of pushing the data to those that need it, like their internal software or data science teams.

Mike shows many of these services in action during the talk, including showing how users can interact with the data that is sent to the Cloud using the ESP-IDF SDK. Each of these features enables users to grow their Cloud capabilities immediately:

Are you ready to scale?

Golioth is ready to take your fleet to the next level, using the ESP-IDF SDK or any of our other supported hardware ecosystems. You can immediately pull the SDK into your next project and start sending data to the Cloud. Reach out to us on our Forums or the Golioth Discord to discuss how we can help you to build out your fleet.

Slides

If you’d like to preview the slides used the video presentation, check them out below. If you’d like a PDF copy of the slides, please contact [email protected].

In this article, we showcase how to use Wireshark–an open source, free network analysis tool–to troubleshoot wireless mesh networks set up using OpenThread, Zephyr, and Golioth. The tooling shown here can also be used for other Thread-based devices, assuming you understand the layers of the network. We used these tools internally to help us when get Thread devices to connect with Golioth and take advantage of all of the features we have to offer IoT device makers.

Building Thread Networks

Golioth started building out Thread networks when several users approached us about their interest in creating Golioth-managed Thread devices. We created example projects to show our users how to create mesh networks of custom low-power sensors and connect them back to the internet. We benefit from the fact that Thread network devices are IPv6 devices (thanks to 6LoWPAN), and that they talk over the CoAP protocol, all of which aligns very well with Golioth capabilities. We showed this in our most recent blog post about custom Thread nodes connecting through an OpenThread Border Router (OTBR) back to Golioth and transmitting information that can be displayed anywhere on the web.

Hardware and firmware engineers can utilize the Golioth Zephyr SDK to implement a wide range of features on Thread nodes and interact with those nodes like any other internet-connected device. In the Golioth Red Demo showcased at a number of recent live events, we had nodes that could report back sensor data and react to stimulus from the cloud; future versions could also get firmware updates directly from the cloud.

As in any hardware and firmware development process, things didn’t always go according to plan. When we were troubleshooting our early Proof of Concept, we needed to check which part of the chain was not passing packets along. We broke out Wireshark to start sniffing packets and figured out that there was a mismatch in the number of bytes being sent (since fixed). We think this kind of pinpoint accuracy in troubleshooting is a tool that all our users should have in their toolbox.

Good Security is meant to slow you down

Golioth is secure by default, which means all packets going to our Cloud must be encrypted. Normally, this is a feature! You don’t want anyone with a packet sniffer to be able to see plain-text data. However, when you do want to see what’s inside a packet during troubleshooting, you need to make sure you have the keys to unlock everything. You also need to make sure you have the tools properly configured for the various layers involved in Thread networks. These will be the steps we review below and in the video.

Setting up a sniffer

In order to use Wireshark to troubleshoot a Thread network, you’ll need the following:

Pretty simple!

The first step is getting the tools onto the dongle. Much like the dongle was used as a Radio Co-Processor on the Open Thread Border Router, we’ll be using a different set of firmware to sniff radio packets and hand them over USB to the computer. This firmware is specific to 802.15.4, which is the Physical and MAC layer used by Thread. Download the firmware from Nordic Semiconductor and load it onto your dongle and you’re ready to go!

Next you need to be able to interact with the output of the dongle. This includes installing a python script in Wireshark that is located in the Nordic Semiconductor repository. Around the 2:15 mark in the video, Mike shows where and how to install this in Wireshark.

Configuration Settings

Other important parts of the video include things like:

  • 3:45Choosing the correct 802.15.4 channel (channel 15 for most Golioth examples)
  • 5:00Network settings for Wireshark to capture Thread network traffic
  • 7:15Adding a Pre-Shared Key (PSK) to decrypt DTLS packets

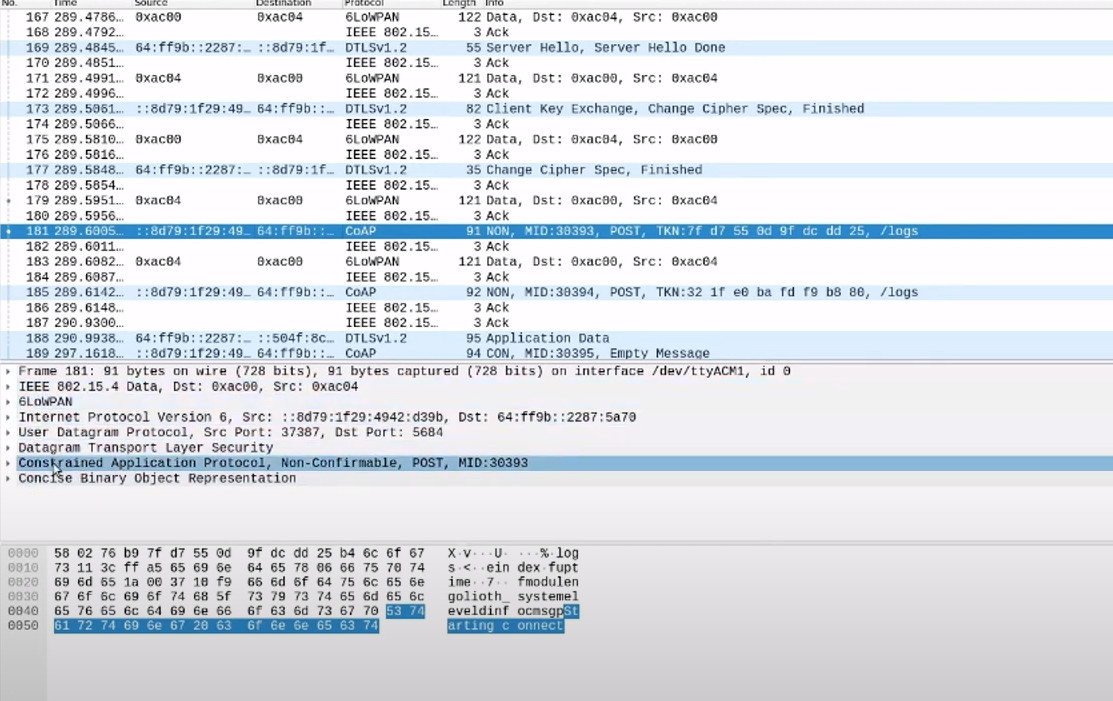
Once those configuration steps are done, you can view wireless traffic coming from your Thread node, through each of the layers, up to the Golioth servers, onto specified endpoints like /logs. In the decoded payload area (bottom window), you can also see the messages that are actually being sent, in this example a log message saying “starting connect”.

Tools for when you need them

Wireshark and plugins developed by the community make for a powerful set of tools for troubleshooting network problems. We hope that our examples and tutorials allow you to quickly deploy a Thread network and build out custom Thread nodes; but when you need a bit more insight or are looking to try something new, Wireshark can help.

We’re here to help too! You can reach us on our Discord or Forum, and can always reach us at [email protected].

TL;DR: we’ve enabled people to compile Zephyr programs from a computer with no toolchain installed, almost instantly.

Part of our charter at Golioth is to help people prototype and scale IoT devices faster. That’s why we offer an open source SDK built on top of Zephyr. We think this represents a “fast forward” or “cheat code” for quickly standing up an IoT device prototype. On the cloud side, our servers represent hundreds of hours of customization and testing; you can instantly connect and get access to resources that allow hardware and firmware developers to scale to thousands or millions of devices. But sometimes it can be scary to get started in a new ecosystem or Real Time Operating System (RTOS) like Zephyr, even if it will speed things up later. As such, we do public and private training for companies and individuals.

As part of the resources we offer, we maintain a Training site that walks people through how to get started using Zephyr, normally targeting remote training. You can follow along right now; you’ll need to purchase an Adafruit MagTag board and sign up for a free Dev Tier account, but everything else is covered on the training site. At the end of the training, you should understand how to interact with hardware in Zephyr and send data to and from the Golioth cloud over WiFi. It’s a short jump from there to re-target other hardware, including your custom designs.

The tripping points for the training often revolve around the installation process. This is multi-pronged:

  • The size of a Zephyr install is relatively large, even when you are only targeting a specific platform. Having multiple people in a room, even with good WiFi or network connectivity, means that the shared bandwidth will be a limiting factor. More trainees means slower downloads.
  • Everyone comes to training with a computer in a different state. They might have tried to install Zephyr tools in the past, or they might have a particularly rare Linux distro, or many other possible variations. It would be best if everyone showed up with a fresh OS install…but that is very unrealistic.
  • There are different expectations around how installations should go. Many embedded engineers are “Windows first” and expect a complete IDE for any new platform. Some silicon vendors help to support this in Zephyr, such as Nordic Semiconductor. But Zephyr was originally targeting Linux-based machines, and we have found the smoothest flow for installing tools for all of the platforms that Zephyr can target means you are Linux-first.

In this article, we’re going to talk about our attempt to normalize setups and have pre-installed tools using Kasm and Docker. These are not the only tools in this space; we have previously written about GitPod and are investigating GitHub Codespaces, but this is a look at one of the latest experiments we’re running at Golioth.

Kasm thin client

The concept of a browser based client or a “thin client” is nothing new. They were all the rage back in the day of time share servers (really those were “dumb terminals”) and then again in the 90s as computing was more ubiquitous throughout the office (with a centralized set of servers). The difference is that now things are much more graphical and running completely inside the browser.

Kasm was started in 2017 and includes an open source project run by Kasm Technologies. The company behind Kasm has a per seat licensing model or they will run the servers directly for you (once you’re past 5 trial seats). They specialize in visualizations around containers. Once you log into a Kasm server, you are able to launch a range of containers, normally a desktop view or a single app that will load up in your browser. You can try this for yourself on the Kasm demo page.

The server that we’re running on is a pre-configured image that I pulled from the Digital Ocean marketplace. I was able to install all of the required software on a provisioned server running in some unknown datacenter. All I did was log in the first time to get my credentials for a user and an admin, and the rest of my interaction was on the web interface that the Kasm server presents to me as an admin.

Docker

As a hardware engineer, Docker is one of those things I heard about for a long time and never really “got it”. I’m still not sure I do. But following the tutorial for customizing a Kasm container, I started to understand a bit more. In that set of tutorials I started from a base Operating System image (Ubuntu Focal) that allowed visualization through the browser. Then I was able to start customizing, adding things like custom files on the desktop, custom icons to launch programs I installed, or adding background images pulled in from the web. It was in this customization section that I could add all of the commands from the Golioth Docs for installing Zephyr tools.

My layman explanation of Docker would be “Creating a virtual computer where I can automatically install a bunch of software using shell scripts. Once I have built that virtual computer, I am able to use it over and over again, including different instances of that virtual computer (for this Kasm scenario)”. The analogy would be if I bought a bunch of laptops, had an install CD (remember those?) with all of the required software on them, and then I mailed the freshly installed laptop to everyone who is taking our training. Sound crazy? That’s one of the best solutions we have seen, where a trainer will bring a pelican case with 24 laptops freshly imaged to on-site training. Their training works flawlessly every time!

I don’t have much else to mention about Docker aside from the idea that it’s possible to script a bunch of install commands that match the install instructions we have on our Zephyr getting started guide. In fact, I used those very directions to build the container shown in the video above. So all I’m doing in this case is automating the install process, doing it once, and then deploying the container (with all of the software and dependencies installed) over and over again for different users.

Challenges

We don’t think this is the ultimate solution for our training, so much as an experiment that showcases what we can do with containerized solutions. There are some remaining challenges, and we would love to have some help from our community.

Loading firmware onto the device

Currently our plan (as shown in the video) is to have our users/trainees pull the final built binary to their local computer to run it on the device like the MagTag. This echoes the way the mbed online compiler worked.

If there is a bootloader and a USB to serial connection, it’s possible to directly load onto the embedded device. In the case of some Espressif boards, this would be something like having ESPtool.py installed locally on your machine. There are an increasing amount of tools that make this process easier, such as an ESP tool that allows you to load firmware using WebUSB. Certain specialized bootloaders like the one that comes default on the MagTag loads UF2 files. When the MagTag is plugged in over USB and a sequence of buttons are hit, the device shows up as a mass storage drive. You drop a UF2 formatted binary–which is just an alternative form of compiled format–onto the drive and the device reboots and starts running the code.

If it’s a board without a bootloader, the user would need to have a debugger and local tools to communicate with that debugger, such as a JLink device and JFlash software. This means they would still need some OS specific loader tools to get the binary into the embedded device. The user would not be able to take advantage of the built-in tools in west that allow direct loading onto the device.

You steppin’?

If you would like to do debugging instead of “printf/printk” debugging, you simply need to download a different file from the container. If you download the zephyr.elf file instead of the zephyr.bin file, you can load it into a 3rd party debugger like Segger Ozone (made by the same company as the JLink). We have done some experiments with this in the past, including also analyzing where the device is spending its time using SystemView. This would once again require installing local programs that could talk over the USB port to something like a JLink.

Experimental port forwarding and WebUSB

Some GDB debuggers/servers will host the control of the debugger over a port on the machine’s localhost. We have some experiments we’re trying where we forward this port to the container so we could directly run a debugger from a software debugger inside the container.

We have also heard some whispers of a WebUSB implementation that can tunnel to the container. So we could plug in a board on our host machine (ie. my laptop) and connect to it over WebUSB, and then forward all information along to the container machine (ie. the browser based desktop running on the Kasm server).

We would love to hear about other projects that are trying this.

Shared resources

The final challenge we are dealing with is the fact that we’re basically “renting” a computer to do exactly what we could be doing with the host machine sitting right in front of us. Most developers have access to very powerful machines and we are instead using the resources on a remote machine (the Kasm server). The cost of standardization is the cost of renting server time for each person in the workshop. It might be worth it, but it is a constraint and a challenge.

Containers are another tool

Anyone reading this with a web background is likely thinking, “Yeah, containers, cool, 2010 called and wants their headline back”. But we are excited about it because these tools are finally making their way into the historically sluggish embedded industry. While our use case of containers is mostly around zero-install-time training, others are using containers to automate their testing and implementing best software engineering practices for the range of devices they have on their desk or in the field.

We’d love to hear how you think we can improve our training and make it easier for you to learn more about Golioth, Zephyr, and building code instantly. Check out our forums, our Discord, ping us on Twitter, or send us an email at [email protected]

This post was written about Thread in July 2022. We are leaving it here for historical purposes, but we suggest that you check out some of our more recent work with Thread on the Golioth Reference Design template and using commercially available Thread Border Routers.

Thread (and its common implementation known as OpenThread) is a networking technology that is quickly gaining adoption due to the forthcoming Matter standard. Thread has been around for many years, but as it grows, it becomes more accessible using off-the-shelf firmware and hardware. So it’s accessible, but maybe not all that straightforward. This post will help with that.

As we have more customers talking to us about using Golioth as a management layer for both Matter solutions and for standalone industrial Thread networks, we thought we should expand our tools to better fit the needs of engineers designing new systems.

In this article and associated examples, we will show you how to set up a network at home using common components. We’ll build a custom device that is communicating back over that network utilizing features of Golioth that extend the networking layer: over-the-air firmware updates, time series data tracking, command/control structures, and instant logging.

Parts of this Thread Guide

In the past, we have written about the basics of getting a Thread demo up and running, and shown it working on video. Today we build upon that work and showcase a new set of resources so you can build your own Thread network with custom devices.

  • YouTube video – A walkthrough of the setup steps and troubleshooting steps with a newly provisioned Thread network.
  • A tutorial site – Follow along with a simplified set of directions for replicating what we have built. We think is the shortest path towards getting a working Thread network on your desk or bench.
  • Code repository – Start from working code on the node devices to see how you can customize code and have your sensor data streaming back to Golioth quickly.
  • This blog post

Getting Started

The majority of the step-by-step instructions are contained in the tutorial site for Golioth and OpenThread. If you’re interested in immediately replicating and then extending our setup, head over to the tutorial site to learn more.

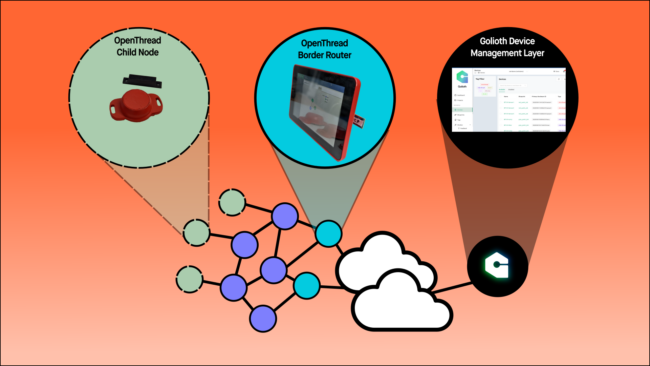
Let’s take a higher level look at the OpenThread Border Router (OTBR), OpenThread nodes, and Golioth device management layer that make up this Thread network example.

OpenThread Border Router  (OTBR)

This is the key part in a Thread network, as it allows any arbitrary number of nodes that are communicating with one another (meshing) to then reach the outside internet. Each Thread device has an IPv6 address, which is great: That means a node that is meshing with 30 other nodes and connected to the internet (through an OTBR) is directly addressable from the internet. That’s an important piece. We might expect a higher power WiFi based device to have an IP address (assigned from a router), but probably not a low power sensor. The OTBR does a lot of the routing of information and translation of packets coming from node devices.

We build a DIY version of the OTBR because there aren’t many commercially available (yet). We use a Raspberry Pi and an nRF52840 Dongle to create a pipeline out to the wider internet.

OpenThread Nodes

In our first video/blog about Thread, we had nodes talking to the internet through an OTBR. However, the nodes only blinked and sent back logging messages and we didn’t give detailed instructions on how to build them. In the tutorial site and the video, we show how we can execute arbitrary code to do higher level functions, like data logging. We use the Laird Connectivity BT510, which is a sensor node built with the Nordic Semiconductor nRF52840. It also has a range of sensors built in and is contained in a waterproof case. We think it’s a great platform for building a small, reliable Thread network and we used it in our Red Demo that we showcased at the 2022 Zephyr Developer Summit and Embedded World.

The BT510 is a board already supported in Zephyr, which means we can very easily compile firmware for it and access all of the sensor drivers that are built into Zephyr, no custom out-of-tree code required. We use the OpenThread networking stack that is native to Zephyr, and the Golioth SDK, which allows each node to be pre-configured to talk to the Golioth servers. We then enable things like LightDB Stream to regularly send back sensor data from the device through the Thread network.

Golioth Device Management Layer

The Golioth Device Management Layer/Platform is already ready for you. If you don’t have an account, you can sign up on the Golioth Console, which will guide you through creating your first device on the platform; you can use the credentials for that digital version of a device to control your first Thread node.

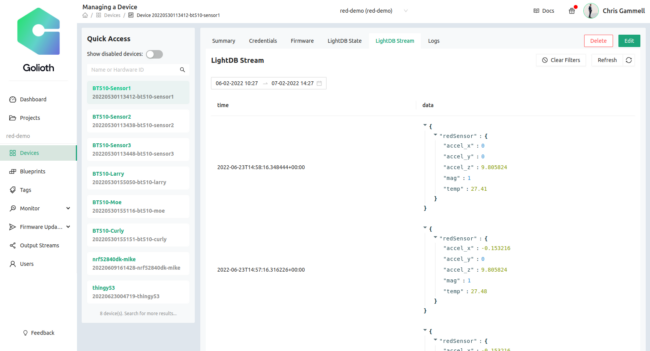
Once your Thread device is connected, you’ll be able to see how often the device is connecting, view the latest data and logs being sent back from the device, and check which firmware versions are on each device. Any data sent to the Golioth platform from a Thread node can be aggregated into an external visualization platform, or wholesale exported to 3rd party services (AWS, Azure, GCP) using Output Streams.

What will you build?

We are sharing the know-how to build a Thread network. Following this guide enables all of your devices on the Thread network to communicate back to the wider internet. As a hardware engineer, I don’t really want to mess about with the network layer, I just want something that works. Instead, I’d rather focus on the end application and building end devices (nodes) that are useful to customers and users.

With Golioth, Zephyr, OpenThread, and some off-the-shelf hardware, you can get started quickly and you can start to connect custom devices with a powerful interface to the internet. What will you build? Please let us know on our Discord, Forum, or on Twitter.