Once your first device is online and talking back to the Cloud, your problems immediately start to multiply. As you go from one to ten to one hundred devices, you want to understand some basic information about all the devices in your fleet. This week we showcased how to visualize this data by creating a “Fleet View” in Grafana. Let’s look an how you can build one of your own.
Moving from a Device View to a Fleet View
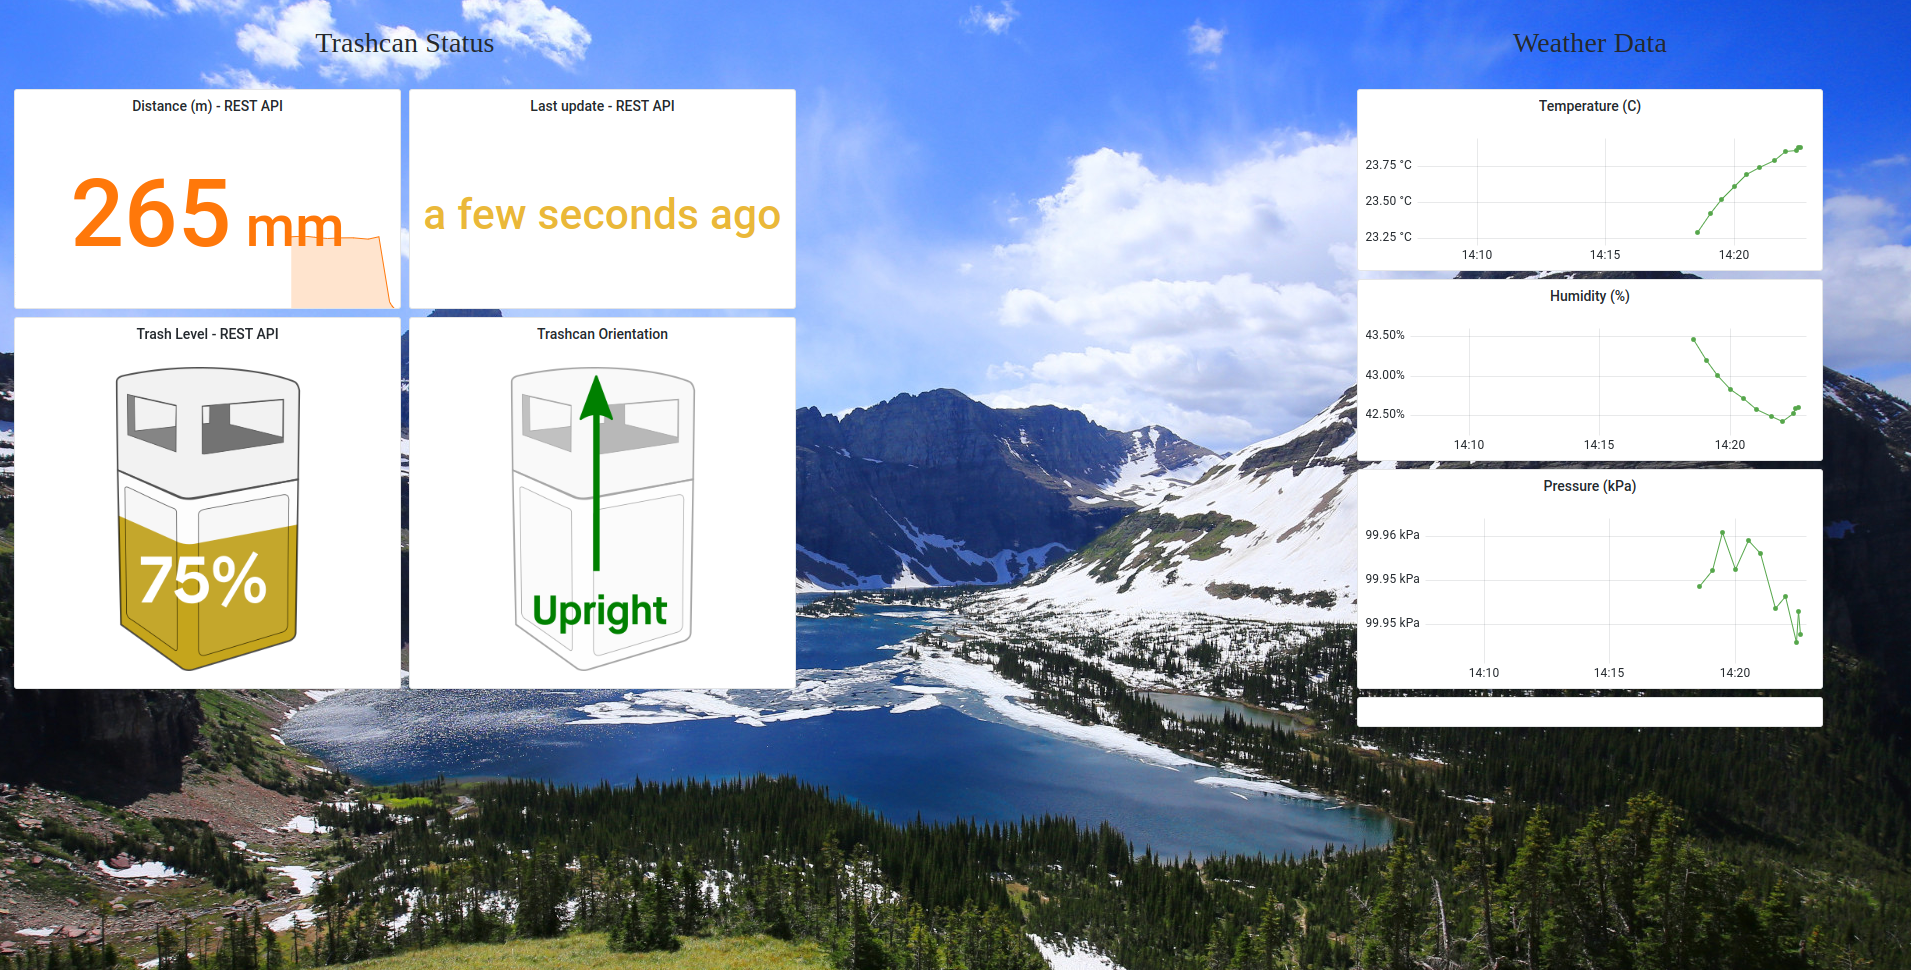
The example in the video uses the devices in a project related to the Golioth IoT Trashcan Reference Design. In that setup, we have a single device view so that we can visualize the depth of data coming off of the device:
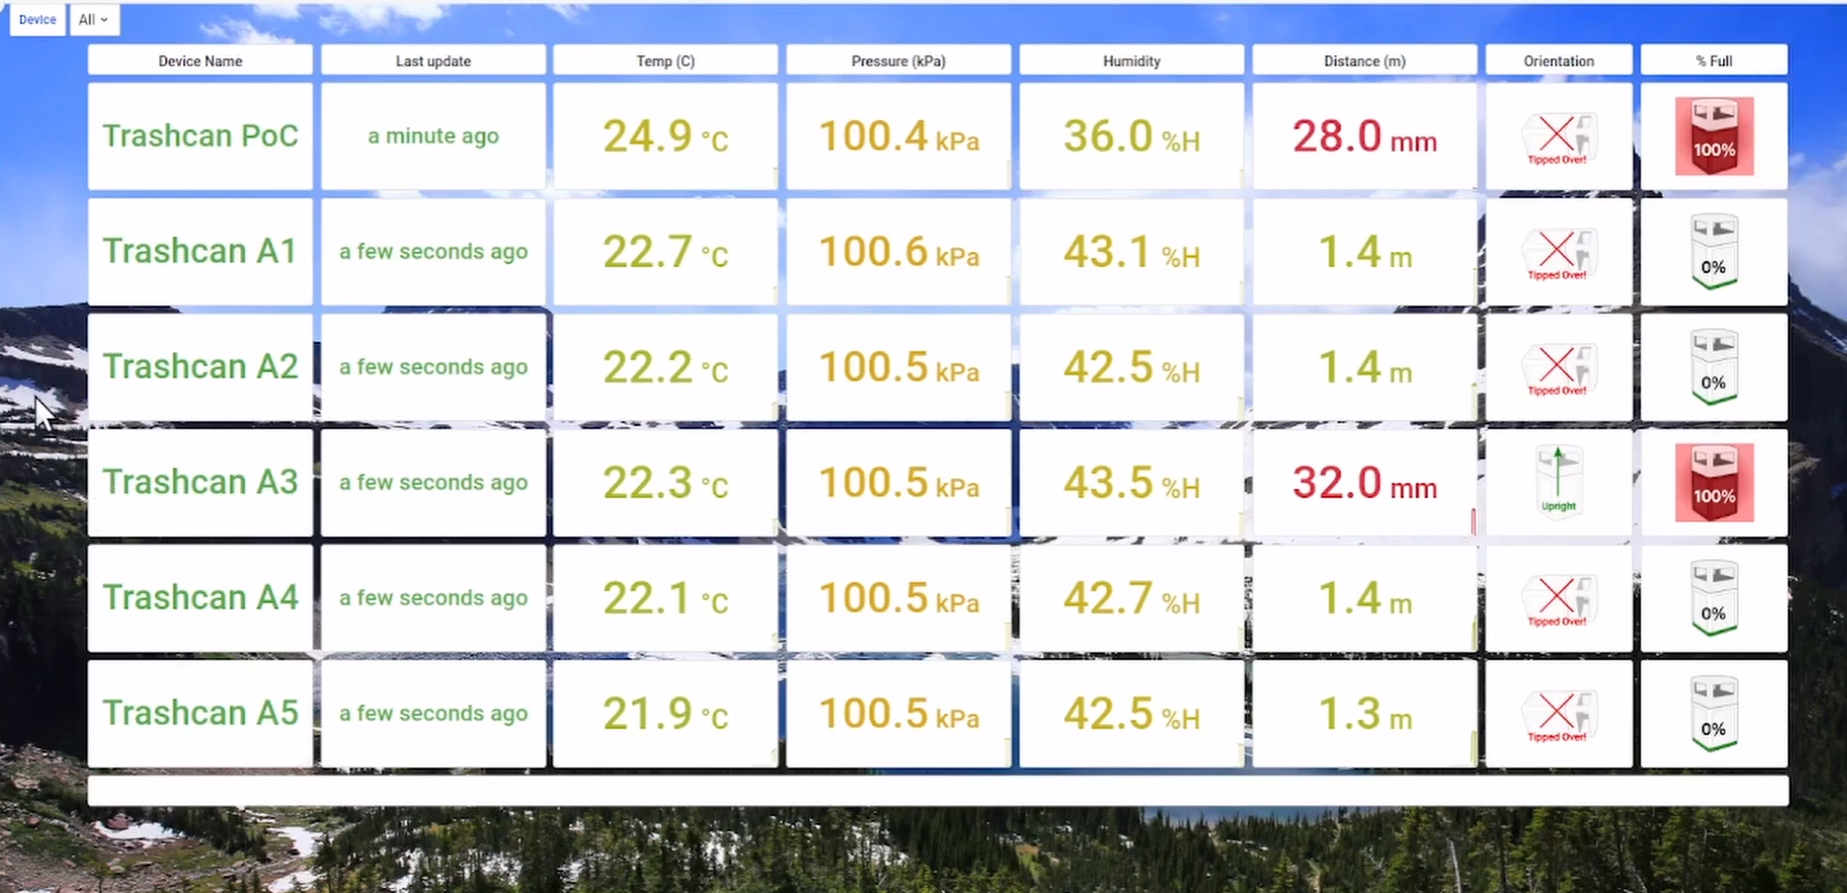
In the fleet view we take that individual device data and stretch it horizontally across the page for each individual device. From there, replicate each of the chosen boxes to get the same view for every device in a fleet, in this case it’s 6 devices. The resulting dashboard looks like this:
The ability to replicate the setup across all the device in a fleet is built upon two elements of Grafana: creating a variable and using the ‘repeat’ option for each visualization element.
Creating a variable
We have posted about creating Grafana dashboards in the past. The first thing you need to do is set up a “data source” to configure Grafana to talk to the Golioth REST API. This is how you will extract the data that your devices are sending back to the Golioth Cloud. Each device has a unique ID that Golioth uses to coordinate data moving through the Golioth platform.
When we want to visualize more than one device in our system, we need to make it possible for Grafana to dynamically switch between the different Golioth Unique Identifiers for all the devices on your project. The first step is to create a variable in Grafana that represents all of the devices.
Click on the gear icon to access the “Dashboard Settings Menu” on the upper right of your dashboard (hit ‘esc’ if you don’t see anything on the upper right of your dashboard, your menu may be hidden).
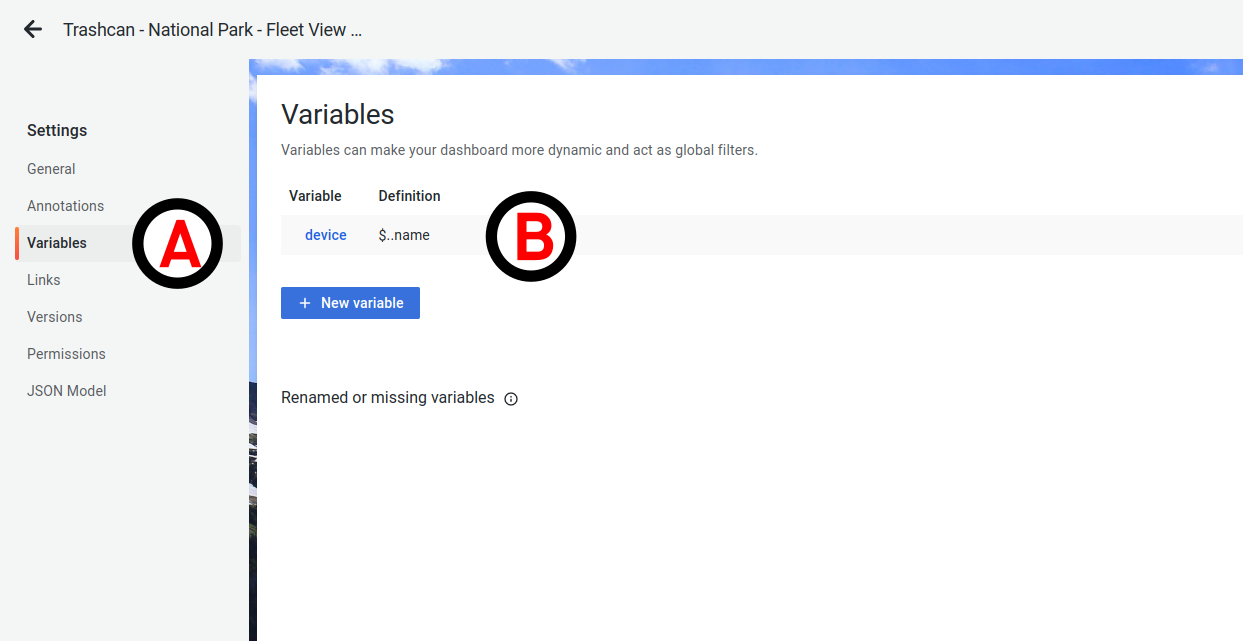
This will take you to the following screen, click on Point A to get into the variables menu and then click ‘+New Variable’ or click on the variable you want to modify at Point B.
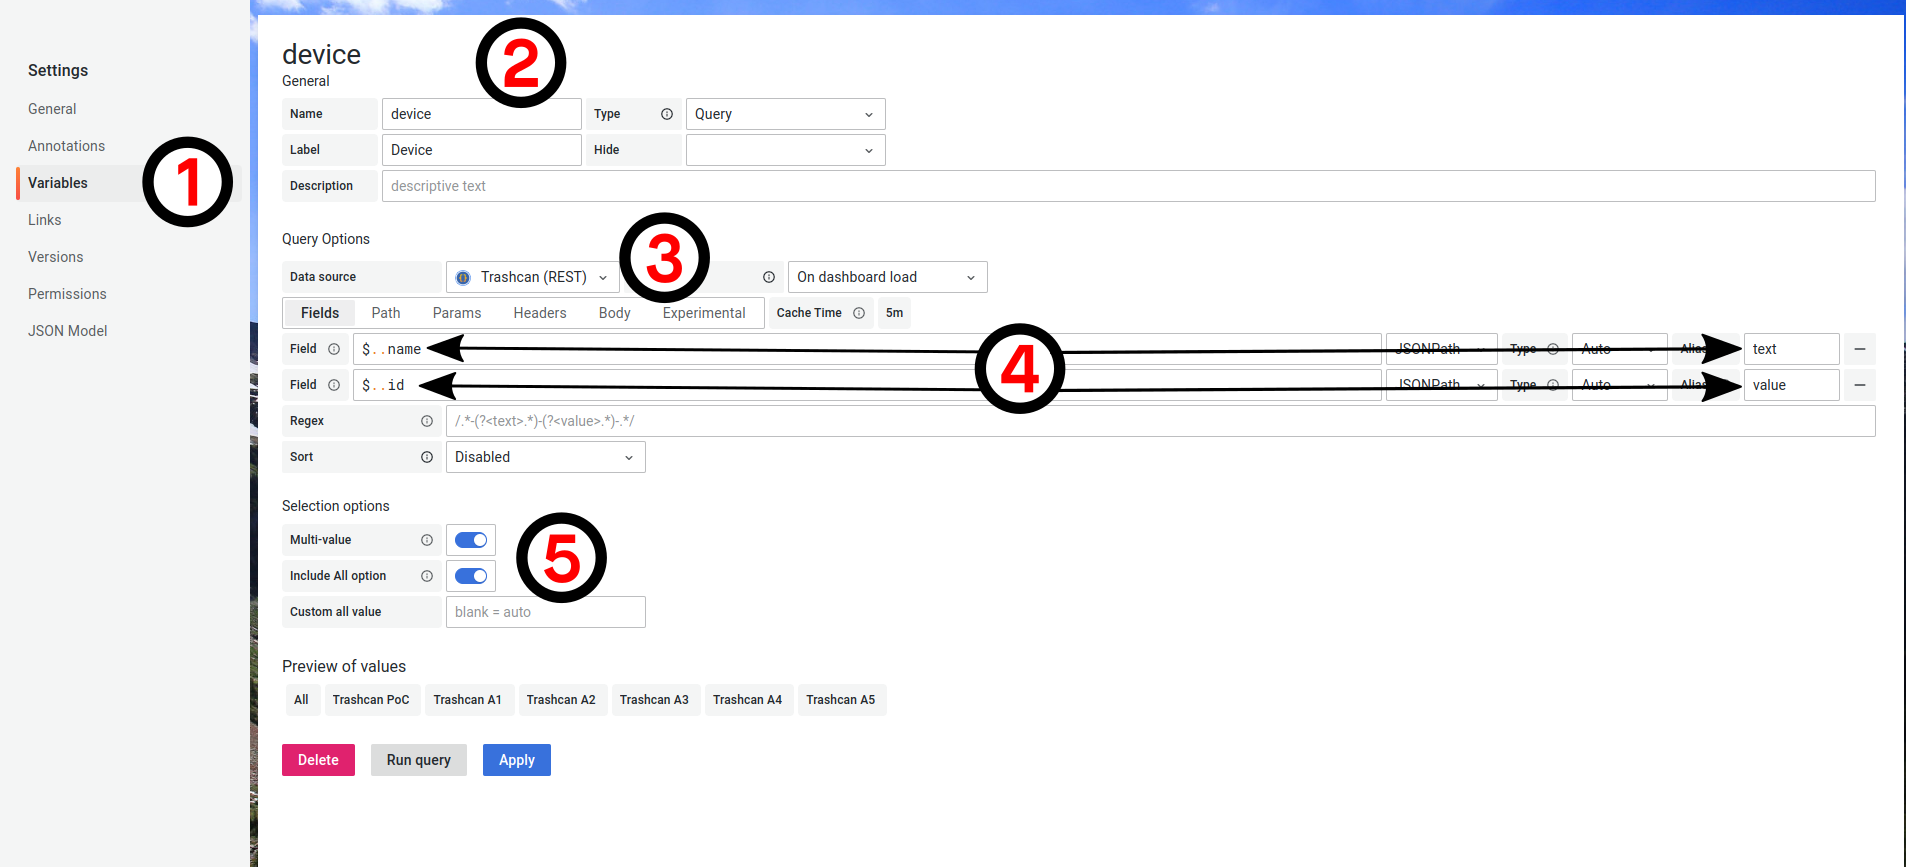
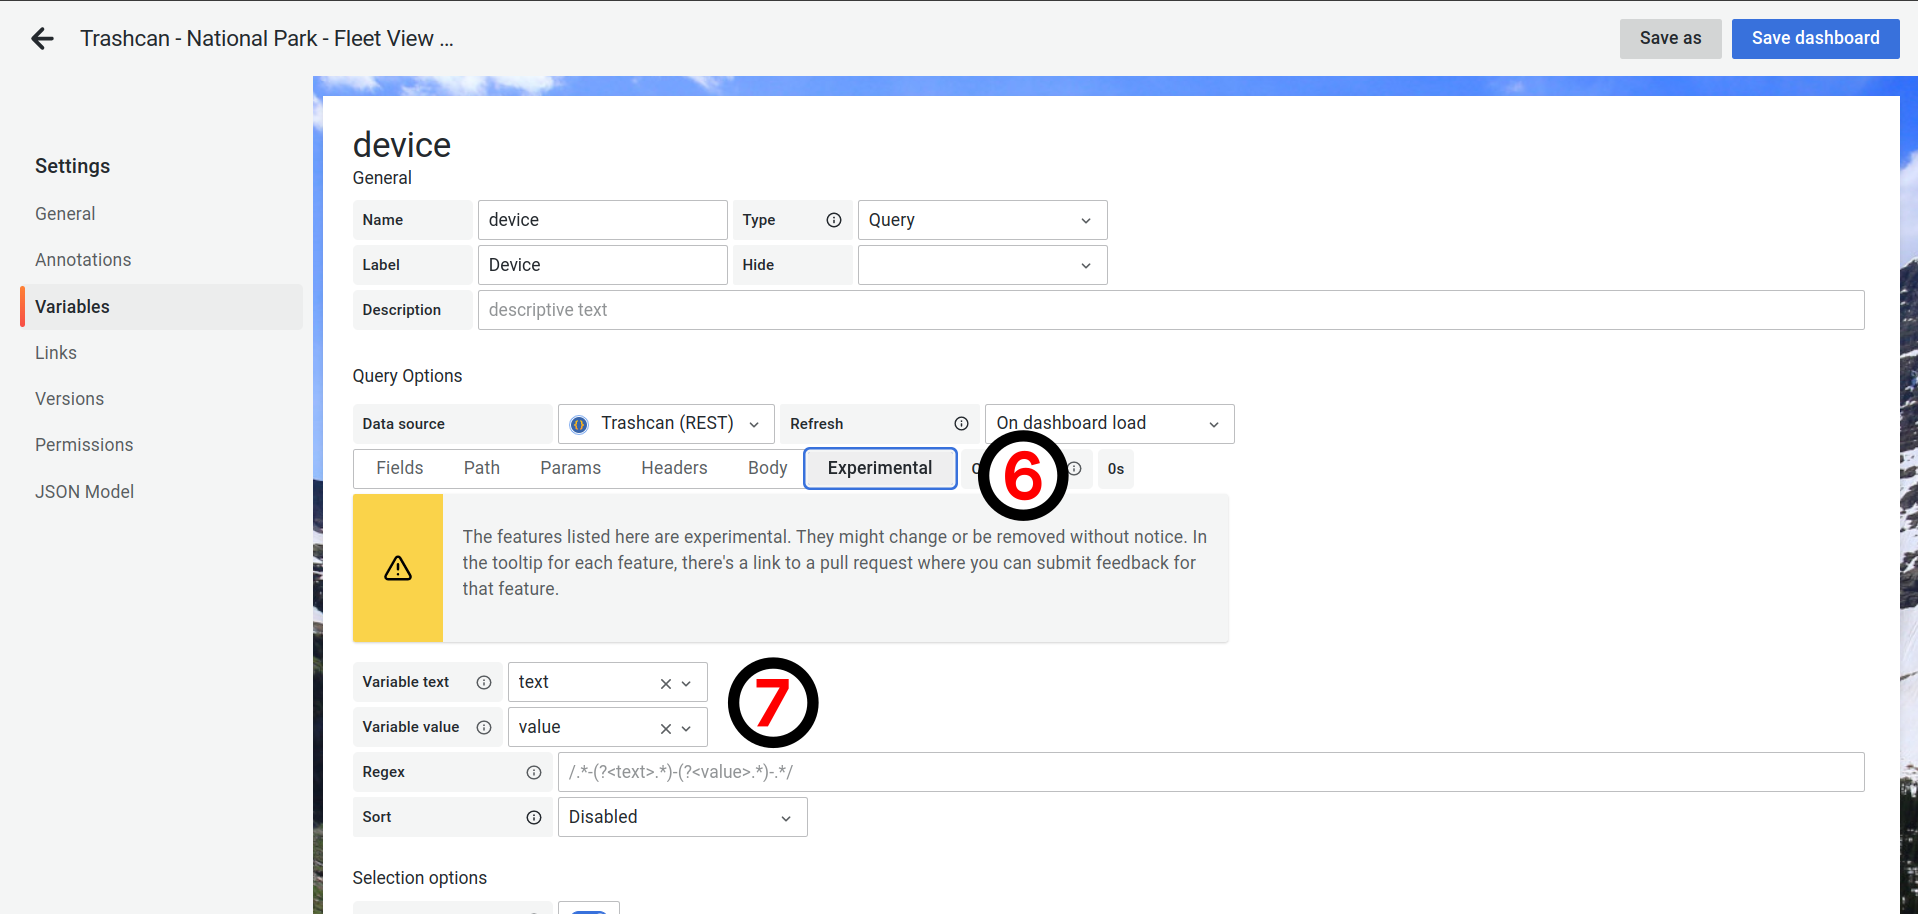
In the variable creation/editing menu, you can set a name (Point 2 in the image below). You will need to select your JSON API data source that connects you to the Golioth REST API (Point 3).
Under the ‘Path’ menu, you will need to do a GET request at the /devices/ end point (not shown). Then replicate the variables shown (Point 4) to pull back data from your project that includes an array of all device IDs in a project ($..id / value) and the associated names of all devices in your project ($..name / text).
Finally you will want to toggle Multi-Select and Include All Option (Point 5). This will give your dashboard a pulldown menu, as is showcased in the video above.
Finally, you need to set these newly created fields in the Experimental tab (Point 6) and set the “Variable text” and “Variable value” (Point 7).
You now have a variable you can work with in your project.
Creating a repeating element on your Fleet Dashboard
Each individual box shown in Fig. 2 is a Grafana “panel”, which means you can connect it to a data source and do some kind of visualization with it. Normally this is a chart, a dial, a displayed value, or an icon/graphic you assign to a state.
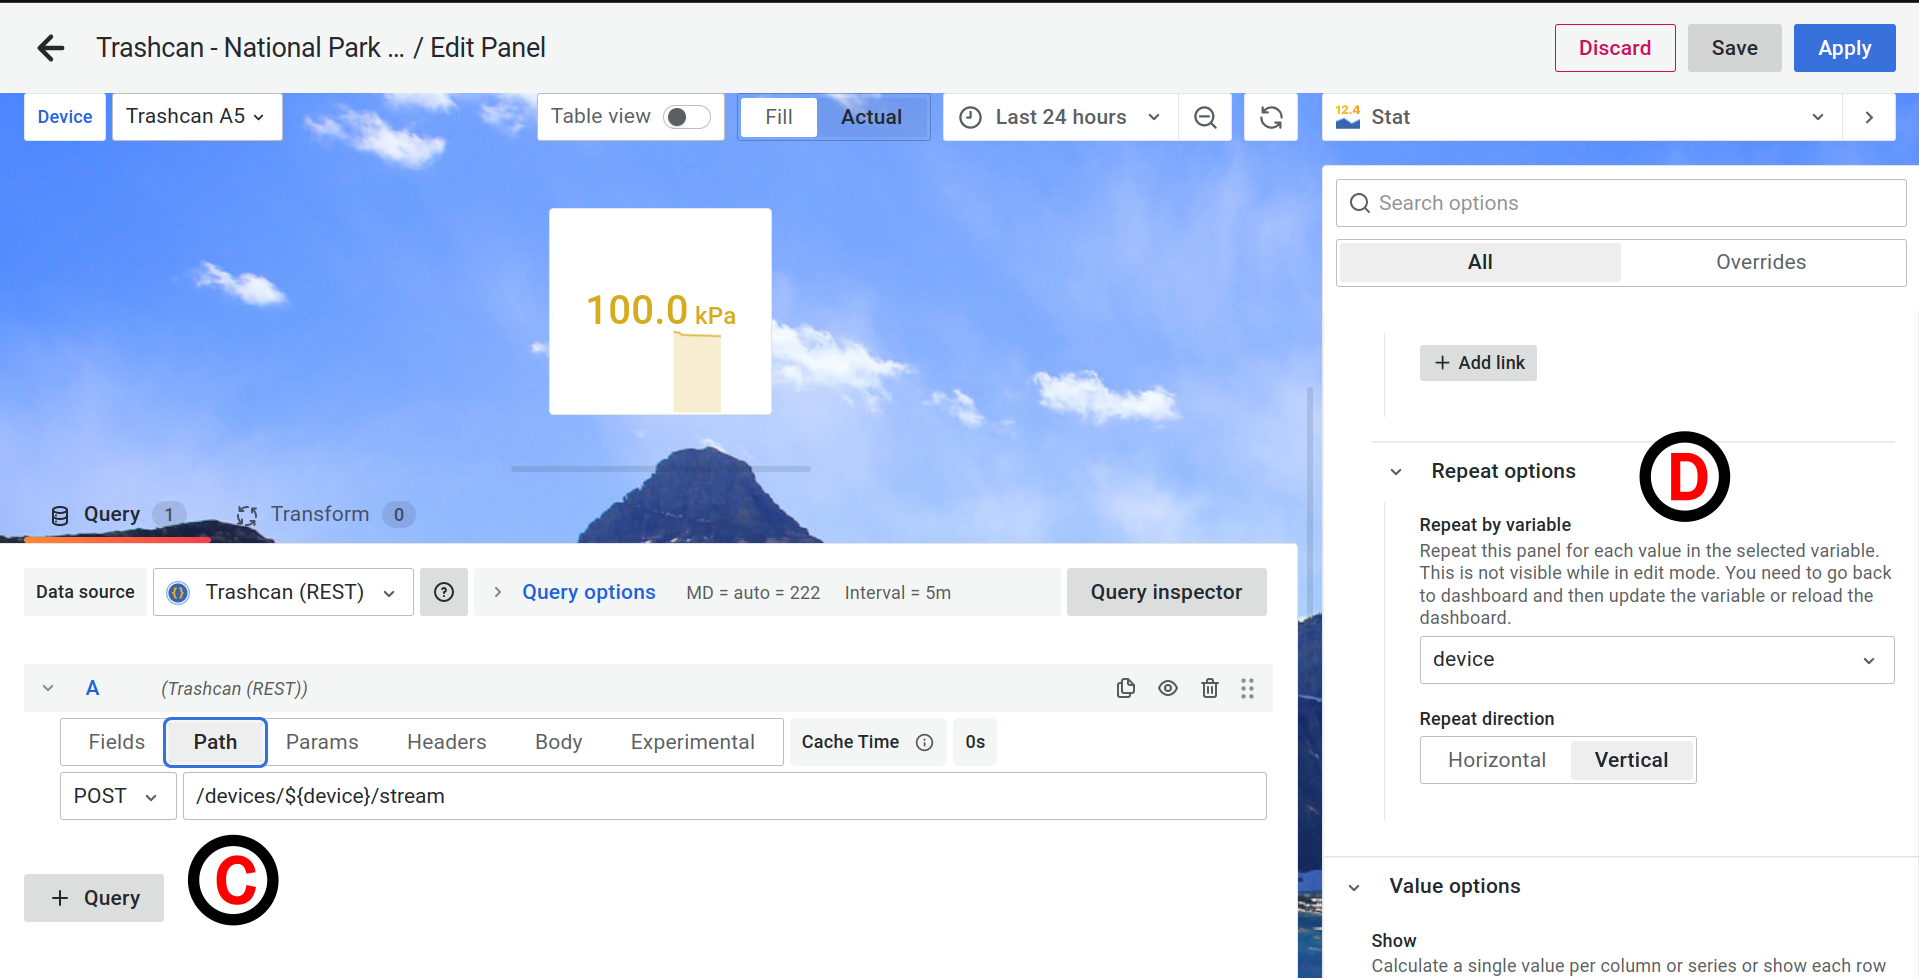
When you edit one of these panels, you need to change two things to enable “fleet view”. The first is to change the target on the Path tab (Point C) to point to the /devices/${device}/stream endpoint on the REST API. This will automatically change which set of device data we’re looking at when we change the pulldown in the upper left corner. As shown, it is looking up the Golioth Device ID for “Trashcan A5” and inserting that into the path in place of ${device}. See below for the code I have in the “Body” field that you can use as a model when doing a POST request to the REST API.
Next we want to modify the “Repeat options” on the right sidebar (Point D). I selected that we repeat based on all of the devices we have selected. I also selected that the “Repeat direction” is vertical so it stacks up the repeated panels on top of one another to get a view like in Fig. 2. See this in action with the associated YouTube video.
{
    "start" : "${__from:date}",
    "end" : "${__to:date}",
	"perPage" : 999,
	"query": {
		"fields" : [
			{ "path": "time" },
			{ "path": "deviceId"},
			{ "path": "*"}
		],
		"timeBucket" : "5s"
	}
}
Build your next fleet with Golioth
In addition to the flexibility that a Grafana dashboard can provide, the Golioth Console acts as a more text-focused fleet visualization and control plane for your devices out in the field. We think you can understand a good amount about your devices simply from glancing at your project Console and seeing the state of each device.
We always want to hear about how we can improve the experience for our users. Please try out the Console with our free Dev tier and then stop by our Forum to discuss your fleet deployment!

No comments yet! Start the discussion at forum.golioth.io