This guest post is contributed by
Ben Mawbey, a community member who is active on the
Golioth Discord and frequently takes part in Office Hours.
Data wants to be visualized. The impact of showing a customer a slick plot of the information their devices have been collecting is massive compared to pointing at a few hundred lines of text from a log file or database query.
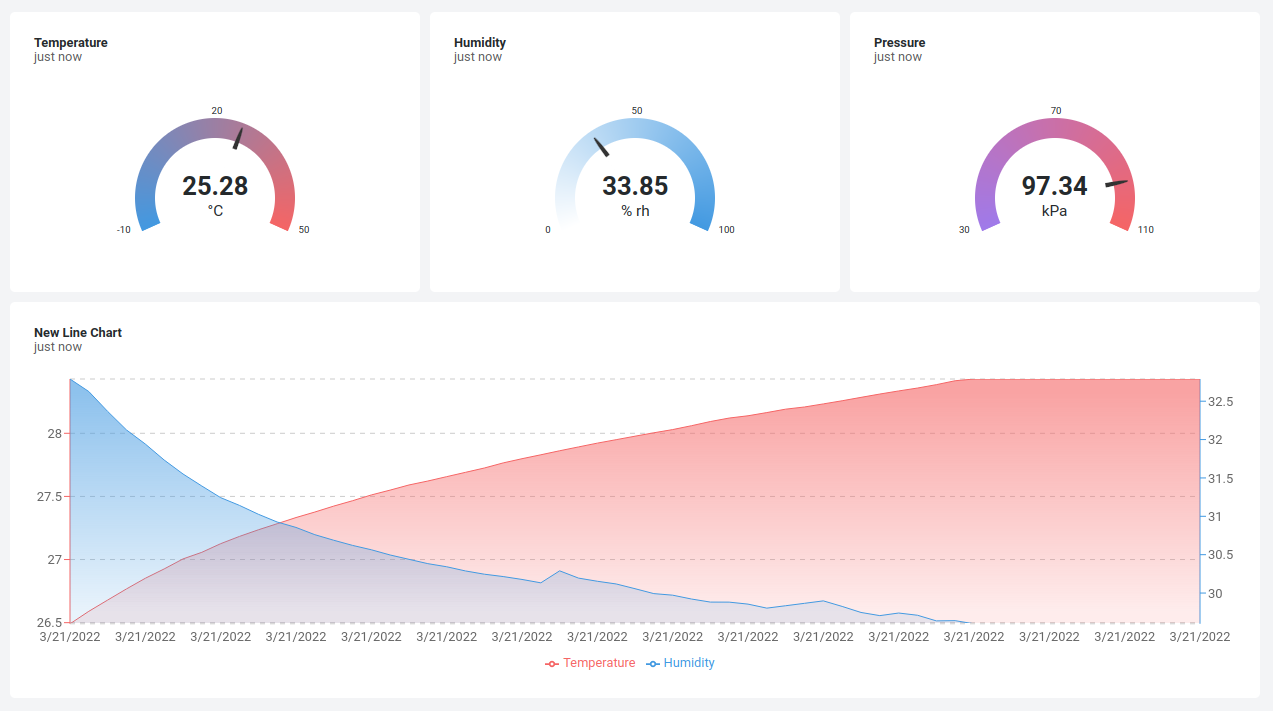
I was looking for some sort of dashboard or charting application for a demo for a sensor system we’ve built. I figured this will appease the clients’ need for pretty pictures over boring reports. I found exactly what I needed, and it only took me about 30 minutes to get it up and running.

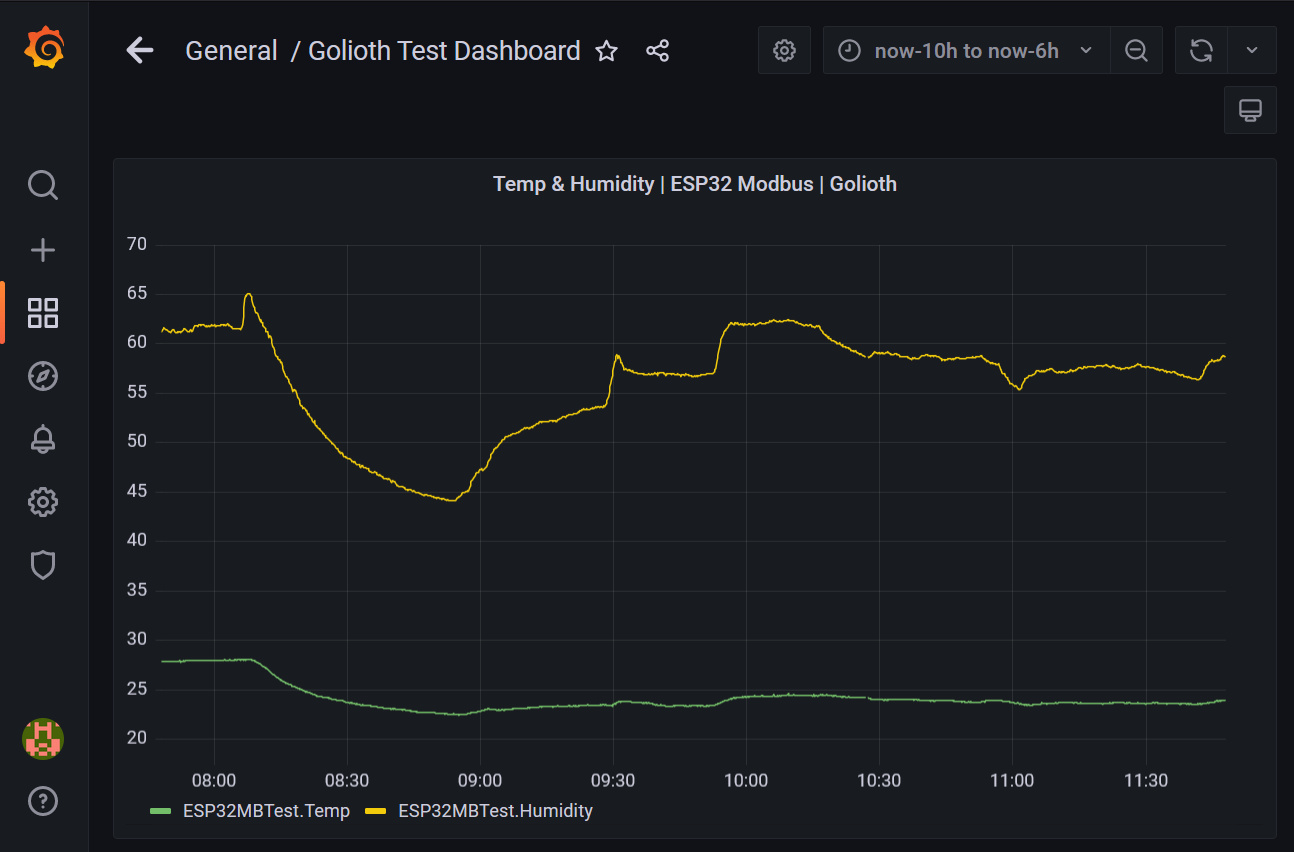
This looks great, even if you have no idea what the graphs mean! Let’s dig into how to get from numbers in a database to pretty pictures in a dashboard.
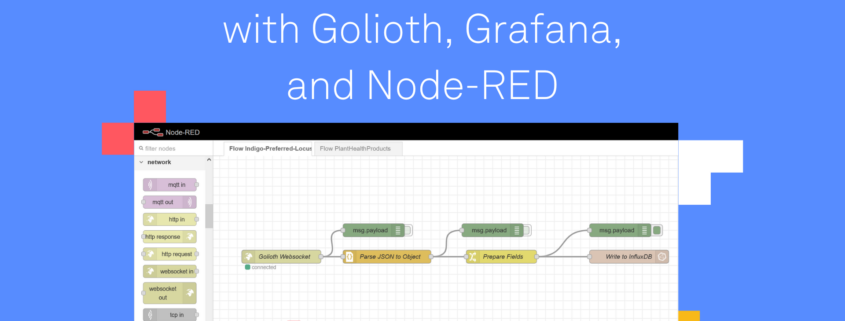
Pieces of the Puzzle: Golioth WebSockets, Node-RED, InfluxDB, and Grafana
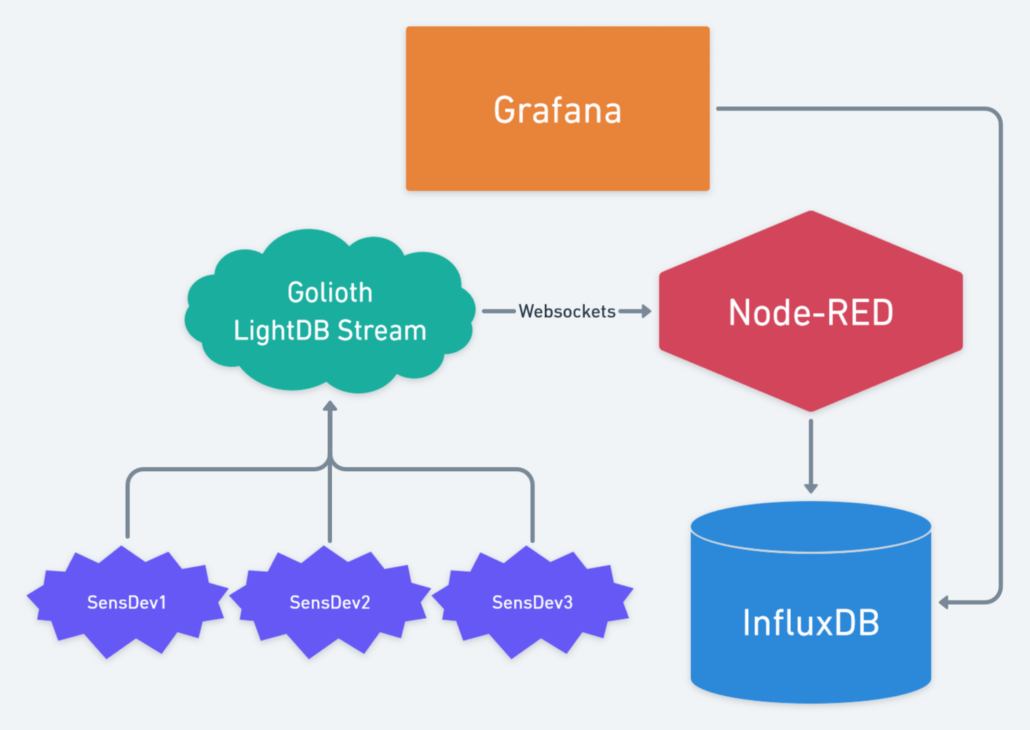
Golioth is brilliant at getting your device data from the real world up to the cloud, climbing the IoT bean-stalk some would say. While abstracting some of the trickiest IoT problems, Golioth can present your time-series data as a convenient cloud resource using LightDB Stream service. By leveraging the built-in WebSockets support and some open-source tools we can rapidly store, manipulate and display this data!
Grafana is the open-source blockbuster for this application and can be easily set up to graph sensor data directly from Golioth LightDB Stream using the REST API. This has two major drawbacks:
- Grafana must periodically poll for new data
- While LightDB Stream does provide convenient data retention, I prefer to use my own data storage
Enter InfluxDB, the time-series database powerhouse and an ideal companion to Grafana when talking about IoT real-time applications. This pairing is so popular that the InfluxDB data source integration is baked right into Grafana! By utilizing InfluxDB to store our sensor data, we can perform more complex queries much faster.
The question remaining is how to shuffle data from Golioth to InfluxDB? There are many potential solutions to this hurdle, but my favorite is Node-RED which defines itself as a low code programming tool for wiring up event-driven systems.

Node-RED uses graphical flows to connect data sources and destinations, bending protocols and translating data formats in innumerable ways
Node-RED has exploded in popularity and provides all sorts of integrations to connect your systems together. It provides simple blocks to perform actions and a slick graphical interface to wire up your data flows. Conceptually Node-RED acts as our rule engine to process and direct data.
Dashboards: Grafana and InfluxDB
Grafana is immensely powerful at providing example custom views, data transformations, and alerting. That said, it is only as good as the quality of data you can provide. Having a tightly coupled InfluxDB instance with carefully curated data via Node-RED, allows you to quickly configure complex data queries on large datasets with low latency.
Before we can play with Grafana the first step is InfluxDB setup. After you’ve installed InfluxDB, create a new database on your InfluxDB instance:
> CREATE DATABASE golioth
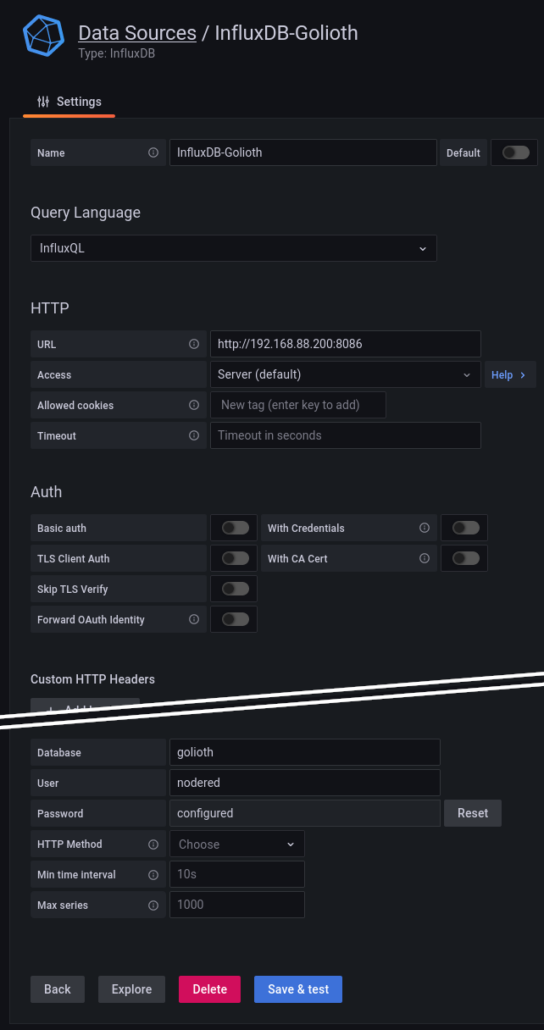
Configure the InfluxDB Data Source in your Grafana instance by clicking the gear icon on the left sidebar, choosing and adding a data source, then searching for the InfluxDB plugin. Here’s how I’ve set up my data source:
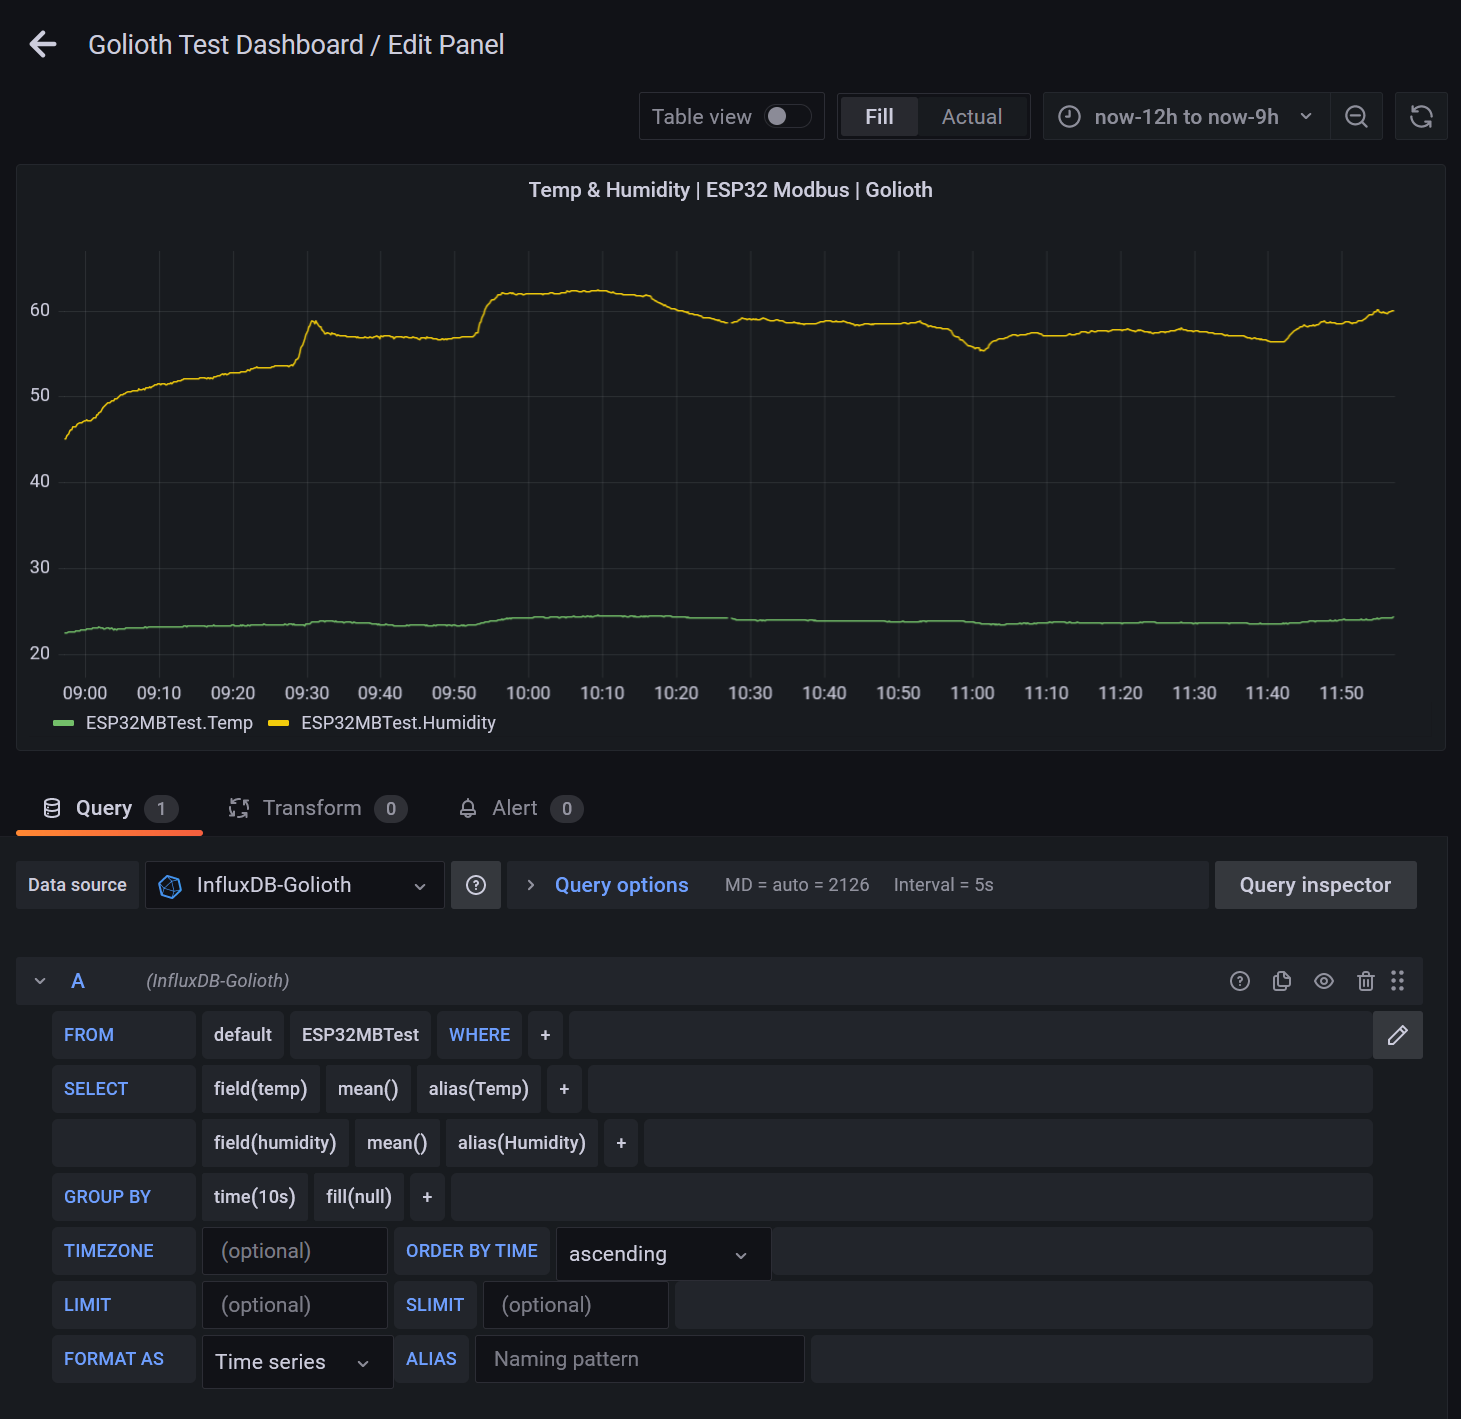
Assuming you have some data in your DB, we can quickly create a new time-series dashboard panel in Grafana and query the dataset using this integration:
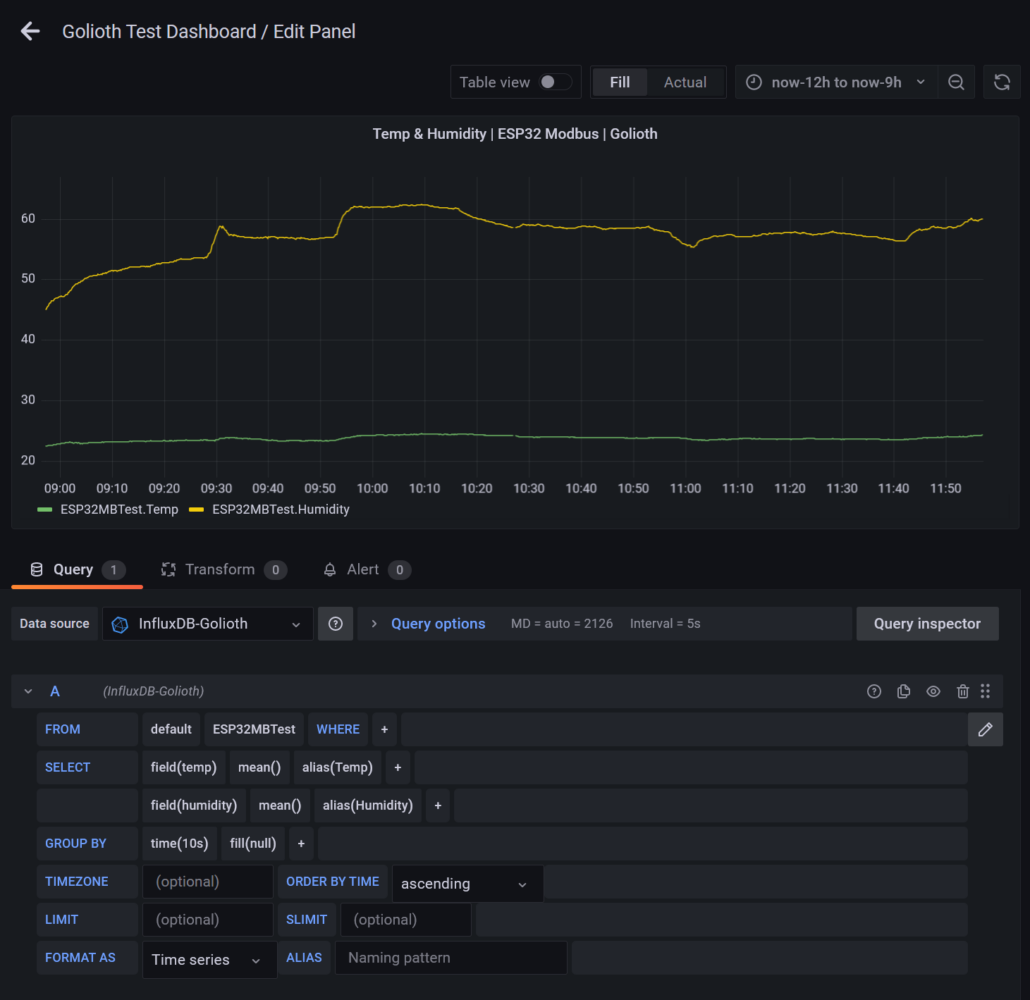
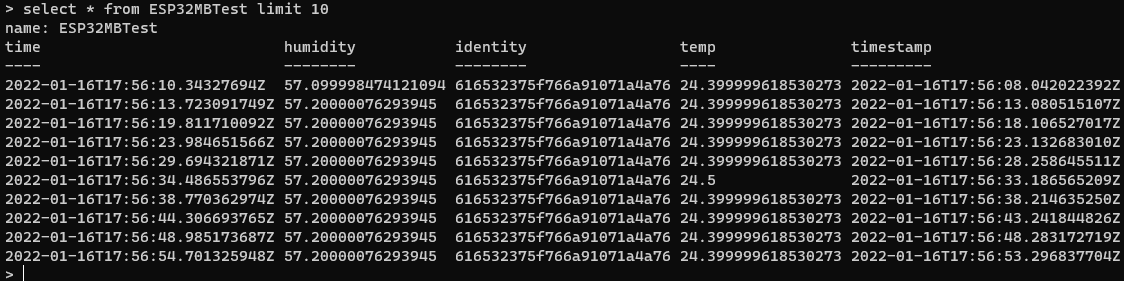
This simple query shows how we structured the data in the DB, allowing us to select from a particular measurement, specifying a specific device identity tag and aggregating data points with specific time buckets. Adjusting the time range instantly updates the graph from our local InfluxDB instance.
Now how do we get the data from Golioth into InfluxDB?
Node-RED
Several networking integrations are provided with Node-RED. Presently the most relevant to Golioth would be HTTP nodes for REST API requests and the WebSockets node which is the easiest to configure.
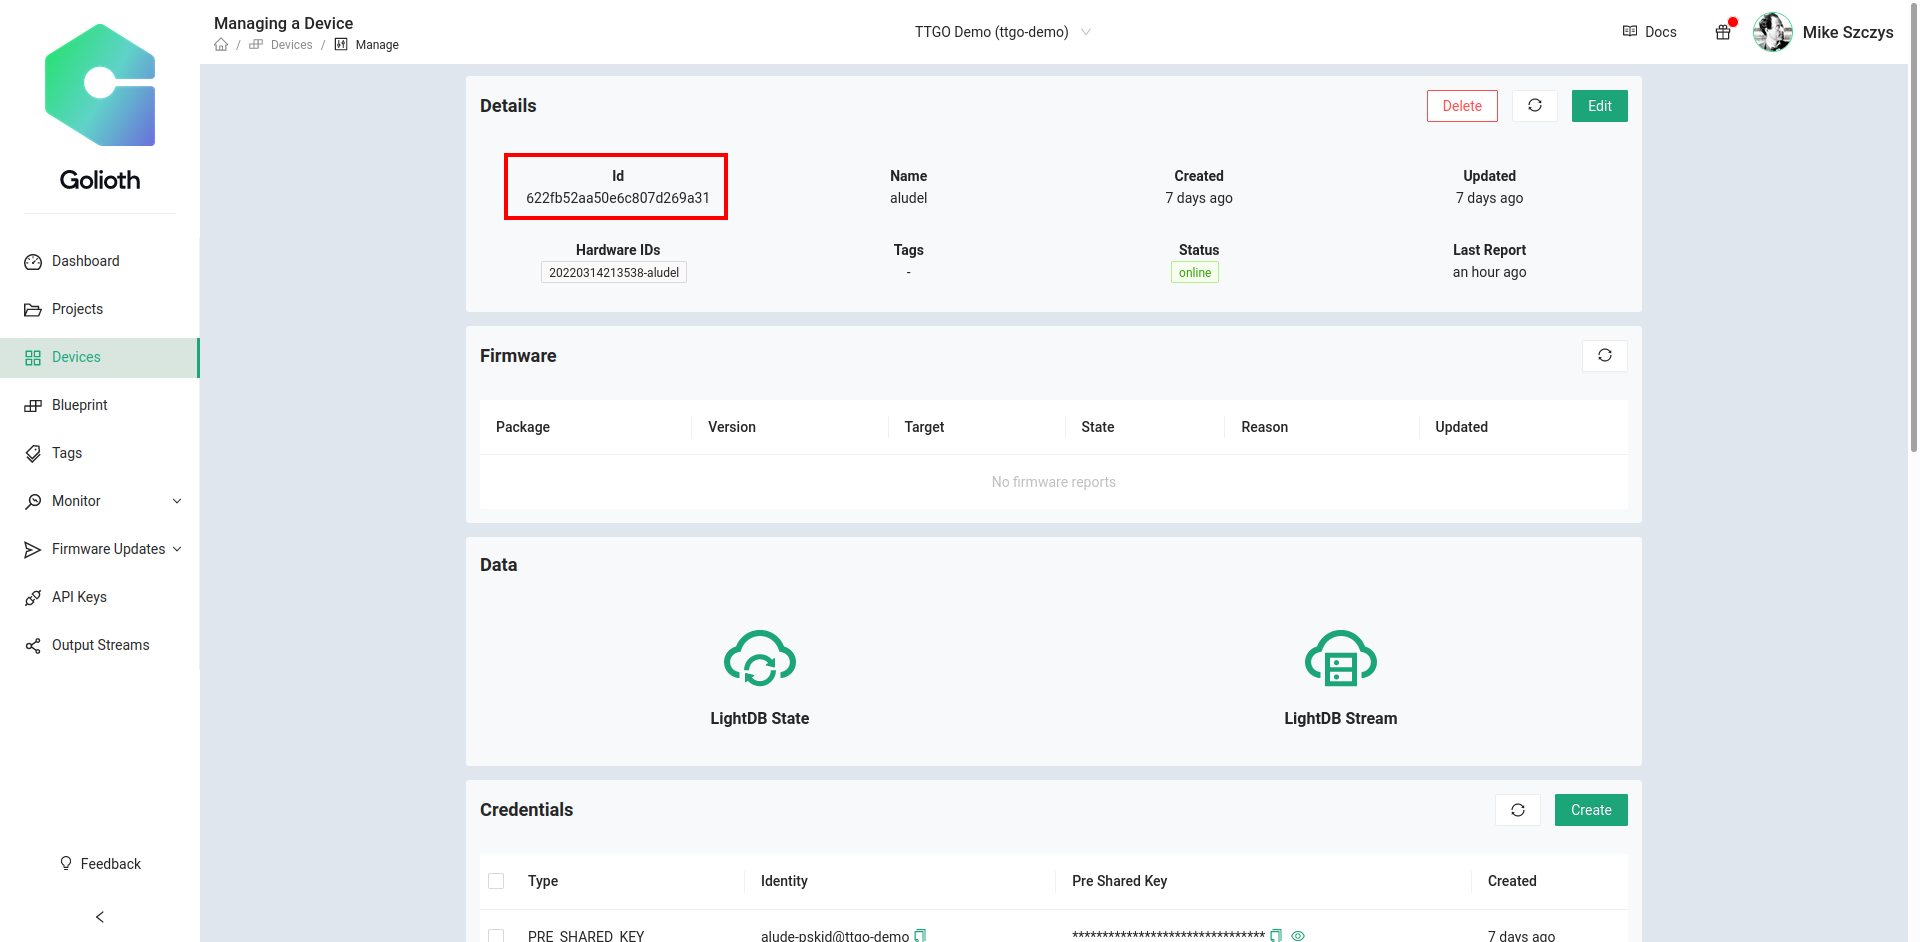
You can see your sensor data collecting in the Golioth LightDB Stream by using the Golioth Console web interface:
We can use Node-RED flows to connect to Golioth via WebSockets and store the resulting data in our local DB:
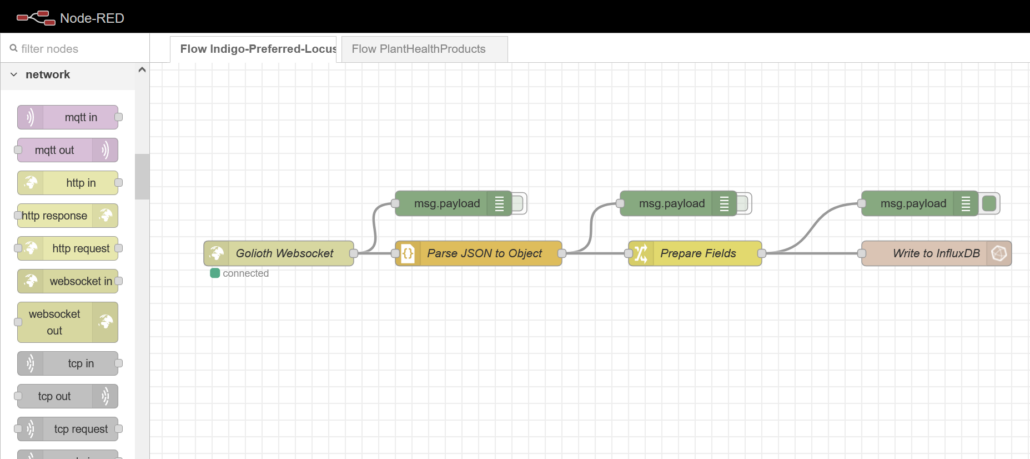
The nodes in this flow were set up as follows, taking care to give them appropriate names making it obvious to see their function. All of the nodes I’m using should come as part of every Node-RED installation except for the InfluxDB nodes. But don’t worry, these are trivial to install. On Linux is looks something like this:
cd ~/.node-red
npm install node-red-contrib-influxdb
sudo systemctl restart nodered.service
WebSockets Node: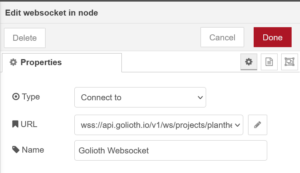
First set up the credentials to your Golioth project using your generated API key and connect to the WebSockets LightDB Stream endpoint.
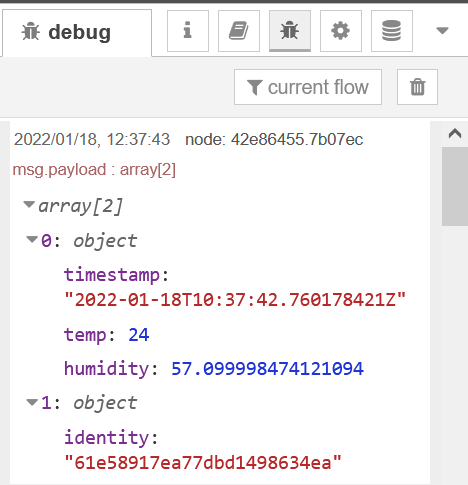
Debug Node:
Drop a few of these nodes along the way and click the small green button to turn the debug log on. This is super handy to check data coming through and make sense of it.
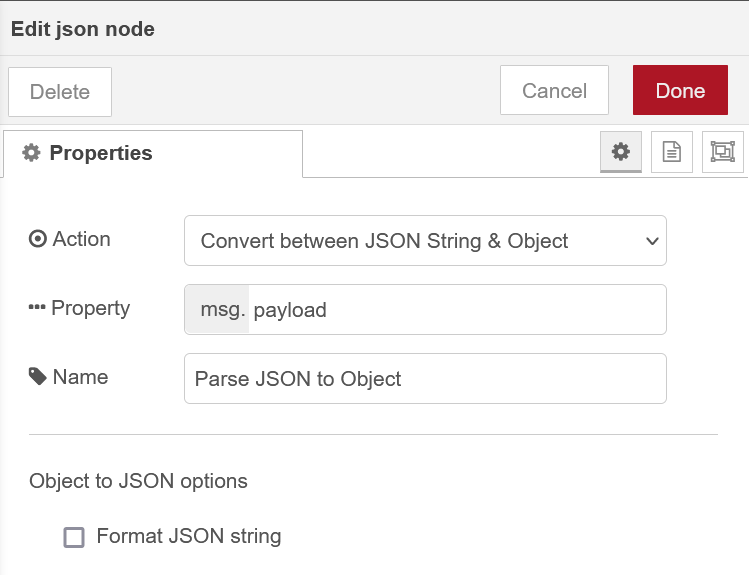
JSON Node:
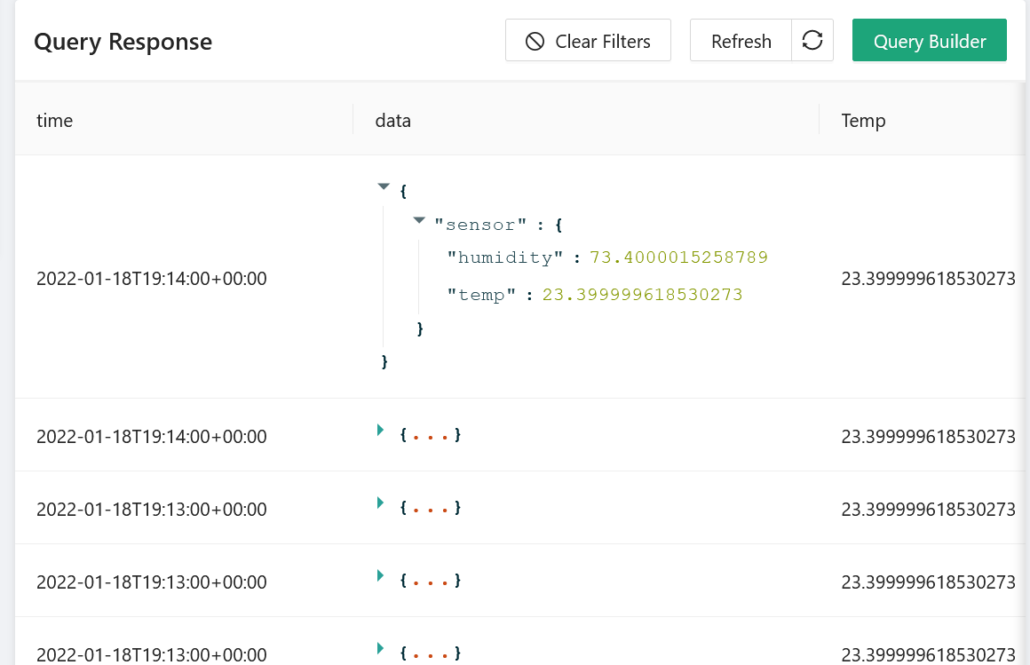
The LightDB Stream endpoint provides us with a JSON object representation containing our sensor data as well as meta information such as the data timestamp and device identity. This node allows us to parse this JSON into a javascript object so that we can work with it more easily in subsequent nodes.
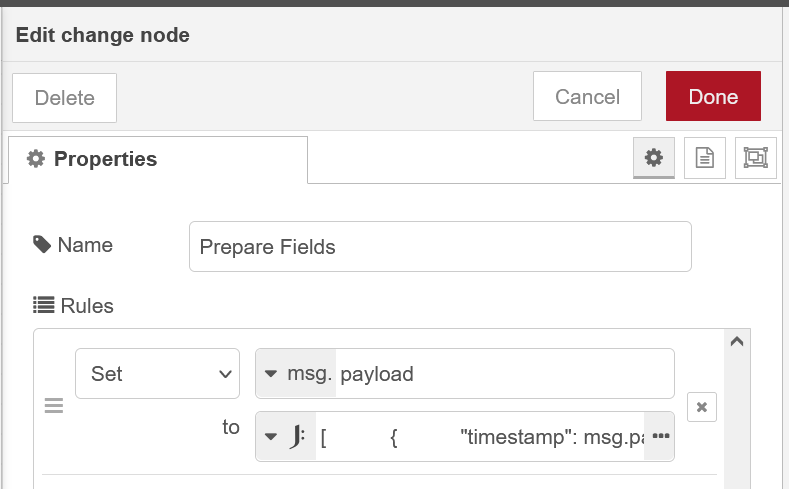
Change Node:
This node clearly shows the power of Node-RED as we can craft any sort of data manipulations or transformation.
We could do without this node and jump straight to InfluxDB, however, should any malformed data arrive we risk polluting the DB with bad data. By selectively transforming the incoming data and mapping it into a new object we can not only filter only good packets and arrange the measurement names but also add tags to build a solid data representation in the DB making our queries far more powerful.
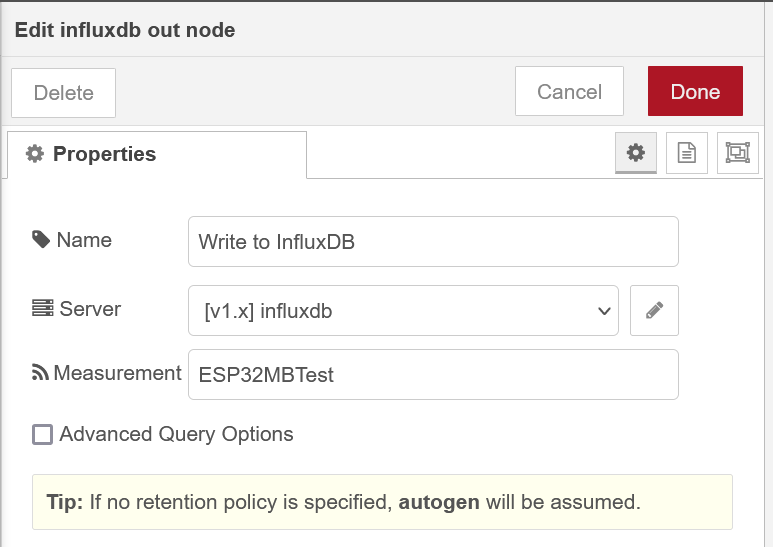
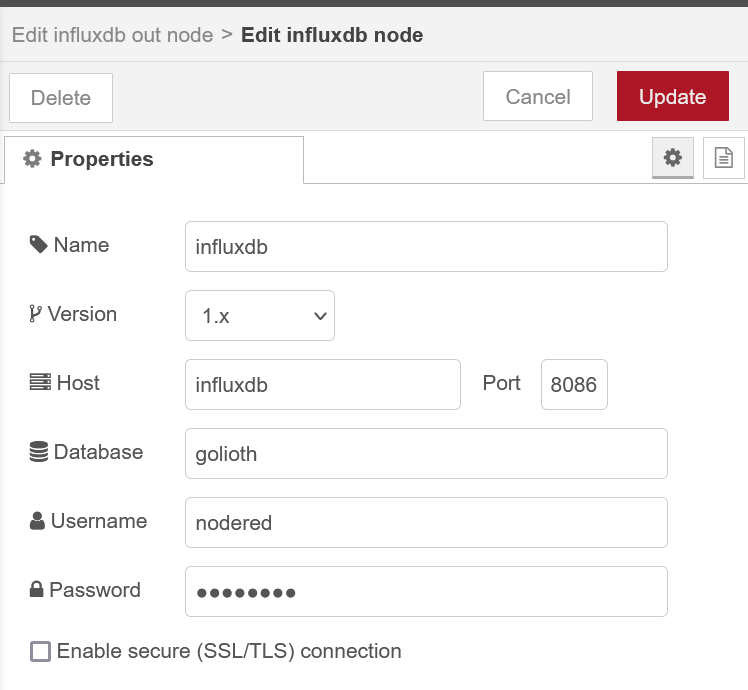
InfluxDB Out Node:
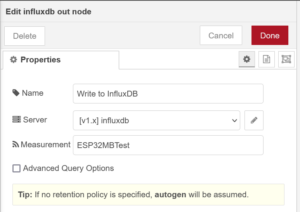

Finally, we can configure the data connection to our InfluxDB instance, set appropriately for your server configuration and database created earlier.
Assuming your flow is set up correctly, you should be able to see data collecting in your database. We know it works, but as I mentioned before, this visual is not going to impress our customers.
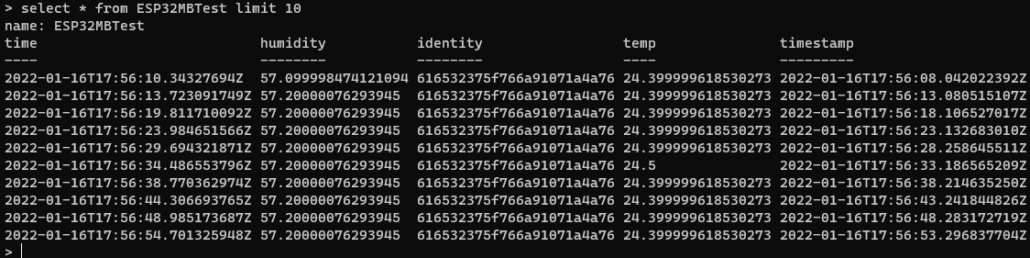
Revisiting the Grafana panel we previously created, you can see InfluxDB data is now being plotted!
Corner Cases
One of the downsides of WebSockets is their ethereal nature, should there be some temporary connectivity issue, any data packets would be lost from the point of view of your InfluxDB database. A solution around this could be to set up another flow that executes periodically to sync with the LightDB Stream using the REST API. Node-RED could then be configured to check this data and add any missing values into the InfluxDB instance and prevent consistency issues.
Another concern with open-source self-hosted systems is security. It can be challenging to secure your server and services should they be public-facing. If you are handling sensitive data then it would be best to consult with an expert in this field. Fortunately, all of the tools discussed have subscription-based cloud services available that sort all of this out in the background.
Conclusion
Being able to set up a simple demo like this in less than 30 minutes demonstrates the power and flexibility of these modern open-source solutions. Coupled with the reliability and maintenance advantages of the Docker system, it’s a breeze to test locally on your desktop or Raspberry Pi and then deploy to production a moment later on your cloud server of choice. The rules engine and ease of wiring up blocks provided by Node-RED opens up a massive pool of possibilities, from countless other integrations to building intelligent processes. One such idea I would like to explore is integrating a device provisioning process into the flow such that we can link a device to a dataset or location during deployment or maintenance.
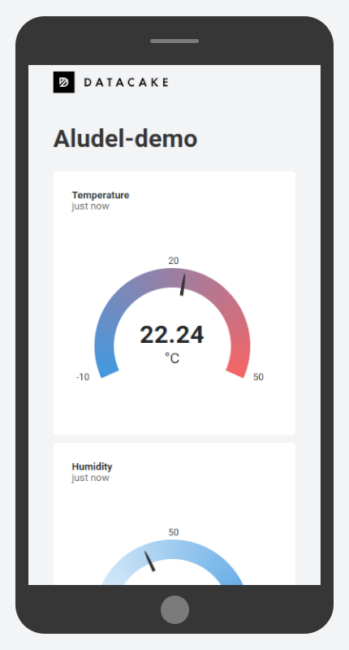 You’ll have no problem packing all kinds of display data into one computer screen with this setup. But one added bonus when working with Datacake is that you can generate publicly viewable links that include a dashboard optimized for mobile viewing. Think of sending your prospective customers a link to a sleek dashboard with live data from the proof-of-concept hardware you just bootstrapped.