As a hardware engineer, I have been interested in finding a platform to help me manage my devices for a long time. Seriously, there’s recorded proof. Back in 2018, I was on a podcast talking about my desire to have a management platform for all things IoT. If you continue listening to me describe what I wanted, it’s clear I was looking for what Golioth now offers. At the time though, I was specifically looking for firmware update services (what Golioth calls “Device Firmware Update” or “DFU”) for my small groups of ESP32 devices.

Firmware update for remote devices continues to be our most popular feature, not least of all because we support so many hardware platforms. Any device that meets the 3 following criteria is capable of firmware update using Golioth:

  • Firmware built with Zephyr
  • Has a network connection recognized in the Zephyr networking layer (including external modems if there is a sufficient driver)
  • Implements an MCUboot bootloader on the hardware

Our APIs for DFU are flexible enough that there are other combinations that can work, but the above criteria are enables hundreds of hardware devices. For the ESP32, it was that last point that was not yet enabled. The Espressif Zephyr team has been hard at work enabling more and more features and as of a few weeks ago, MCUboot has been pushed upstream and works on ESP32 devices. What’s more, we have tested this and the ESP32 now has DFU capabilities on Golioth deployments.

A bootloader interlude

What is a bootloader, anyway? A bootloader is the small segment of helper code that handles loading your main application code onto a processor when it starts up. It normally lives at the very beginning of memory and is the first thing that runs when a processor boots. The added advantage is you can tell the bootloader to try out different code than it normally runs, as is the case with a firmware update. If you have loaded a program to a microcontroller over a USB cable (without a programmer) on platforms like an Arduino, you are almost certainly running a serial bootloader. Something on your computer tells the board, “I’m shipping you a new firmware image”. Once it’s loaded, the bootloader restarts and tries out that new image. In this way, the bootloader handles updates to the code that is running on a processor at any given time.

In more complex examples, say you have application code that is able to download binaries over a network interface like WiFi or cellular from an awesome API service like Golioth. Once the application code verifies the contents are all properly loaded into the “trial” section of memory, we can then tell the bootloader to try that new code out. This is the basic idea behind the DFU sample in the Golioth SDK.

Possible, but intricate

The good news is you can build and load MCUboot onto your ESP32. This means you have an open source bootloader that enables integrations like Golioth DFU. The less-good news is this is still a somewhat young implementation and that means you have to build the MCUboot image yourself. We expect this flow will get easier over time and we will continue to update as this workflow changes. For now, let’s look at the steps required to get the bootloader built and loaded from a Linux (Ubuntu) system to an ESP32 (other OSes may be possible, but not featured here). After that, we’ll build Golioth sample code which will be loaded onto the ESP32 by this newly built bootloader.

Build MCUboot

This section of the guide is based on directions on the MCUboot repo for Espressif. Those directions are being replicated here for freezing a known working version and to improve visibility to the community. Additional commands were added to make things more clear and to standardize the install process. For instance, below we will be filling in all of the required variables to match the esp32 target.

Install additional packages required for MCUboot

These are the repository files for MCUboot and also the Python dependencies

cd ~
git clone [email protected]:mcu-tools/mcuboot.git
cd ~/mcuboot
pip3 install --user -r scripts/requirements.txt

Update the submodules needed by the Espressif port. This may take a while.

git submodule update --init --recursive --checkout boot/espressif/hal/esp-idf

Next, get the Mbed TLS submodule required by MCUboot.

git submodule update --init --recursive ext/mbedtls

Now we need to install IDF dependencies and set environment variables via a script. This step may take some time. If you happen to be using a Python virtualenv on your command line, exit it by typing deactivate; this is because the script instantiates a virtualenv for you using shell commands.

cd ~/mcuboot/boot/espressif/hal/esp-idf
./install.sh
. ./export.sh
cd ../..

Building the bootloader

The Espressif port of the MCUboot bootloader is built using the toolchain and tools provided by ESP-IDF. Additional configuration related to MCUboot features and slot partitioning may be made using the bootloader.conf. As a reminder, we are specifically building for the esp32 target here.

First we’re going to compile and generate the ELF:

cmake -DCMAKE_TOOLCHAIN_FILE=tools/toolchain-esp32.cmake -DMCUBOOT_TARGET=esp32 -B build -GNinja
cmake --build build/

Next we will convert the ELF to the final bootloader binary image, ready to be flashed. In this case, we are targeting a device with a 4MB flash size. This may work on larger devices, but you should check your specific device to ensure you are targeting an ESP32 part with the proper flash region:

 
esptool.py --chip esp32 elf2image --flash_mode dio --flash_freq 40m --flash_size 4MB -o build/mcuboot_esp32.bin build/mcuboot_esp32.elf

Finally, we are going to flash this binary onto the ESP32, which should be connected over USB. As we said in the bootloader interlude above, the bootloader is a chunk of code that lives at the beginning of memory. We need to offset where the code is actually going to start, based upon a normal memory configuration. In the case of the ESP32, the offset is at 0x1000, so we’ll set the variableBOOTLOADER_FLASH_OFFSET = 0x1000.


esptool.py -p /dev/ttyUSB0 -b 115200 --before default_reset --after hard_reset --chip esp32 write_flash --flash_mode dio --flash_size 4MB --flash_freq 40m 0x1000 build/mcuboot_esp32.bin

We are using /dev/ttyUSB0 because this is for an Ubuntu based system. An OSX (Mac) machine will likely target UART at /dev/tty.SLAB_USBtoUART

Build your image

Now we have a bootloader on the ESP32, hooray!

From here, we want to build a Golioth example for DFU to showcase the capabilities of the platform. The ESP32’s new MCUboot bootloader won’t do anything on its own, we need to pass data to it through the MCUboot API (taken care of in the Golioth sample). In order to fetch that data from the Golioth servers, we need to have application code that checks whether firmware is up-to-date and whether it should be fetching a new version. This is built into the Golioth DFU sample code, as well. We will build an initial version of this application code locally on our machine and manually push it onto the ESP32 using USB.

Building your initial DFU sample image to load directly on the ESP32

The steps below assume your Zephyr directory is located at ~/zephyrproject. If you haven’t built and tried any other samples for the ESP32, it’s probably worthwhile going through the ESP32 quickstart guide, which will take you through all of the required toolchain install steps for Zephyr. If your toolchain is in place, we can move on to edit the DFU sample’s prj.conffile:

 
cd ~/zephyrproject/modules/lib/golioth
nano samples/dfu/prj.conf

We’ll add the following to this file, like we do on all ESP32 samples. The first set of variables enables WiFi access onto your local network, the second set are your credentials for your device on the Golioth Cloud.

CONFIG_ESP32_WIFI_SSID="YOUR_NETWORK_NAME"
CONFIG_ESP32_WIFI_PASSWORD="YOUR_NETWORK_PW"

CONFIG_GOLIOTH_SYSTEM_CLIENT_PSK_ID="DEVICE_CRED_ID"
CONFIG_GOLIOTH_SYSTEM_CLIENT_PSK="DEVICE_PSK"

Then we’ll build the DFU sample

west build -b esp32 samples/dfu -p

Now we have a binary that we need to sign so that MCUboot knows this is a secure version of firmware. The key used here will not be unique and you will see warnings that this key should not be used in production. We agree! Generating and using a different key will be showcased in a future post. But you still need to sign the image. Note that this first image will be signed without a firmware version.

west sign -t imgtool -- --key ../../../bootloader/mcuboot/root-rsa-2048.pem

Finally we’ll flash this image to the board over USB.

west flash --bin-file build/zephyr/zephyr.signed.bin --hex-file build/zephyr/zephyr.signed.hex

Building a new DFU sample image to load directly onto the Golioth cloud

OK! Now we have a Golioth DFU sample loaded onto our ESP32 using the custom MCUboot bootloader. When the device boots up, the bootloader will first load this binary into the ESP32 and it’ll start processing. The application-level code will be monitoring for changes on the Golioth servers and waiting to hear if there is an update to the firmware version. So that’s our last step: building a version to load on the Golioth Console.

This build will look very similar to the last set of steps, with a few crucial differences. First, we build the firmware (no changes are needed for the source code):

 
west build -b esp32 samples/dfu -p 

Then we sign the image. Note that we are now giving this new binary a version number. This helps make it easy to tell which version is going onto your fleet of devices.

west sign -t imgtool --no-hex -B new.bin -- --key ../../../bootloader/mcuboot/root-rsa-2048.pem --version 1.0.0

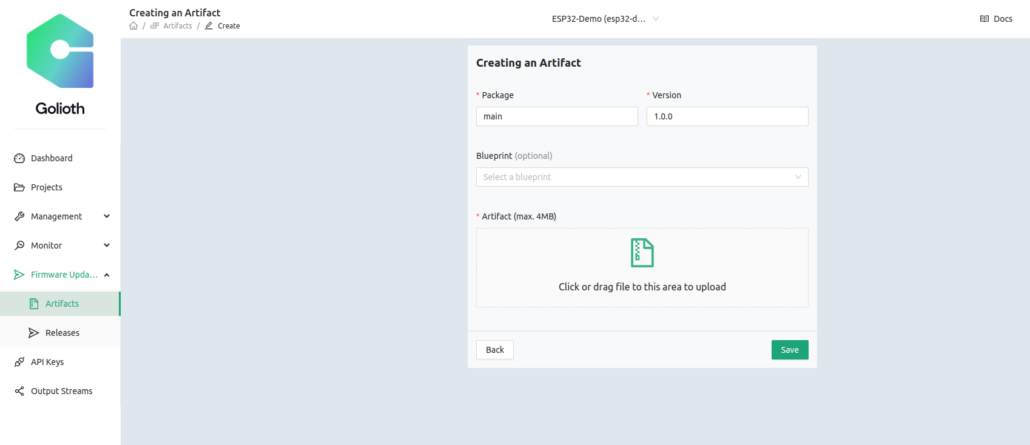
Finally we upload this to the Golioth Cloud. This can be done from the command line using goliothctl or you can upload an image directly as an “Artifact” using the GUI. We walked through using the GUI in the nRF91 OTA DFU video, and have included screenshots of the process below.

Artifact upload process using command line tools:

 
goliothctl login
goliothctl dfu artifact create ./new.bin --version 1.0.0

Artifact upload process using the Golioth Console GUI:

Drag “new.bin” onto the file upload section and set the Version number

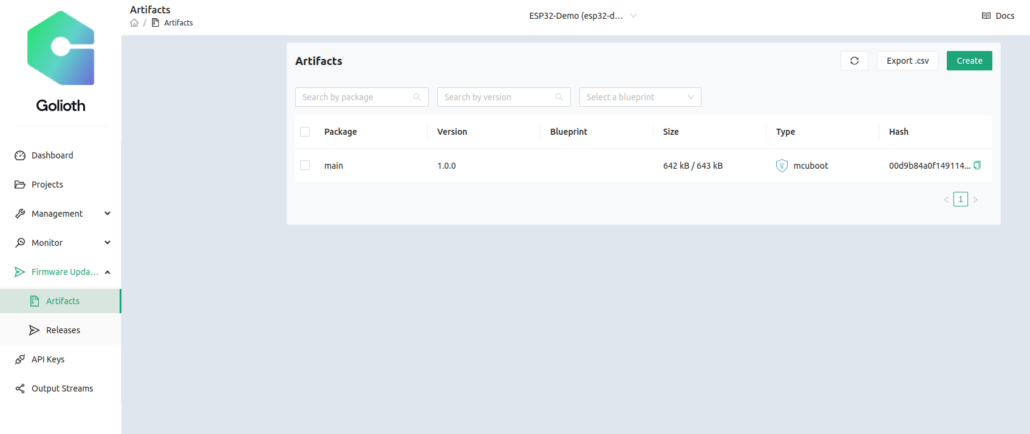
We see that the Artifact list shows a hash based on the signing of the image, and the Golioth Cloud has recognized that the image was built for MCUboot. We did not include a Blueprint, but we also could have done that to only target devices that also had a specific Blueprint assigned.

Ready, set, firmware update

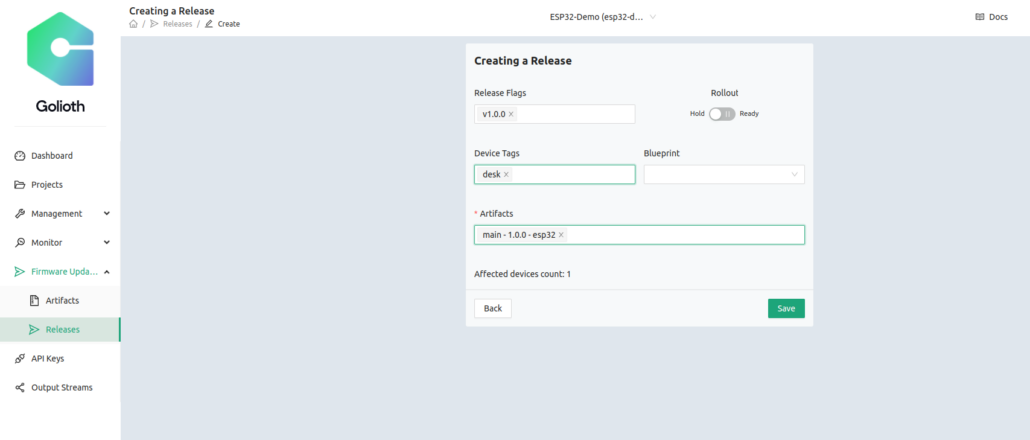
Finally, we’ll create a Release that includes this Artifact. The Release is capable of bundling multiple binaries together, but in our case we only have one. So we’ll include that into a new release that we create on the Golioth Console

I’m targeting the device that is tagged desk (because it’s, you know…on my desk). Only devices with matching tags will get the update. Also note that Rollout is not yet selected.

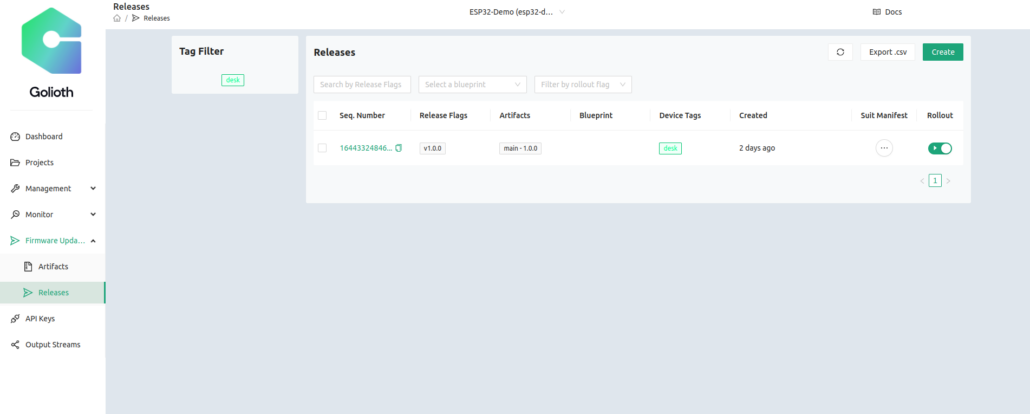
This is the Release page showing this release, which includes the main-1.0.0 Artifact uploaded in the previous step. In the above screenshot, I have clicked Rollout which means any devices matching desk will try to download and install this image. I open a serial terminal to my ESP32 with MCUboot bootloader installed using this command

 
sudo screen /dev/ttyUSB0 115200

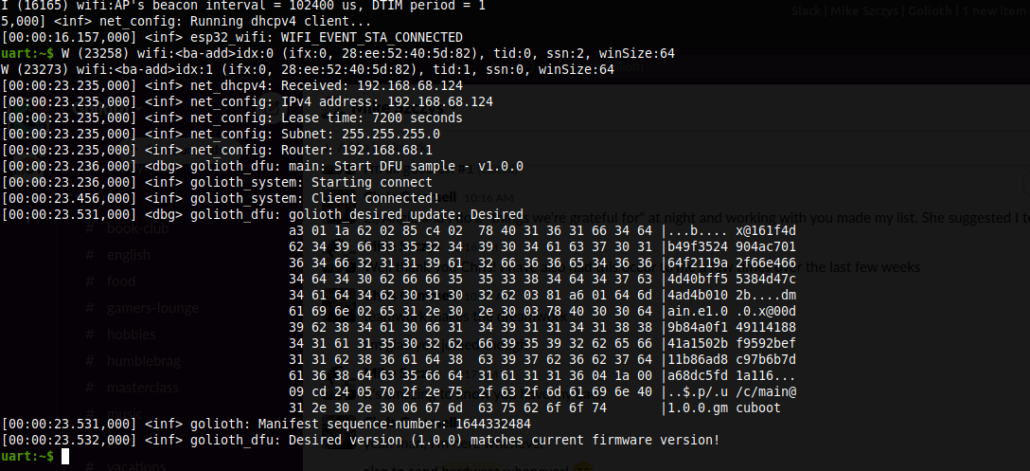
And I see the upload process starting! After it downloads the various pieces of the new v1.0.0 image, MCUboot restarts the processor and loads the new image. At boot time, we see it checking the server to see if it has the latest release. The key message is Desired version (1.0.0) matches current firmware version!

More updates to come

It’d be a stretch to say that was a short or smooth process. With so many steps involved, it might take a couple of tries to get the bootloader working smoothly. If you have run the DFU process a few times, the flow for compiling and uploading to the server becomes like second nature. The MCUboot build process should only have to be done the first time. But we want to keep improving the process for our customers and our partners.

If you have trouble with this process, be sure to hop over to our Discord server for live help from the Golioth team or post on our Forum for help in longer form. Happy updating!

IoT devices have the potential to generate a LOT of data. That’s kind of the point, right? You have a fleet spread out among a geographic area, or factory, or warehouse, or wherever you’re trying to measure data and you pipe it all back to the internet to collate that data for use elsewhere.

How do we make sense of all that data?

Other posts on this blog have showcased how you might chart the data using Grafana, or pipe it to an app using WebSockets. But before you do that, you probably want to get a feel for what’s in your dataset, especially as you’re streaming more and more data back to the platform. Today we’re going to explore that data using the Golioth Query Builder.

A note about images in this post: We are using screenshots of a lot of text, so we recommend clicking on the images in order to get a larger/better view of the feature under discussion.

What is the Golioth Query Builder?

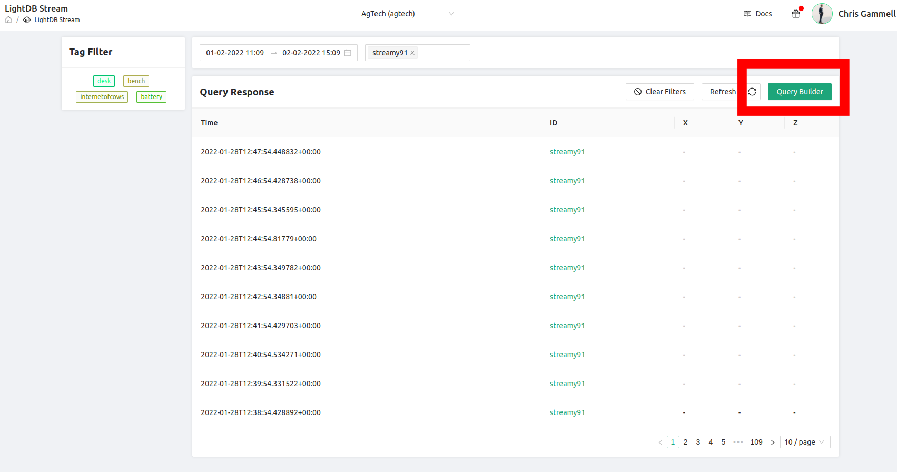
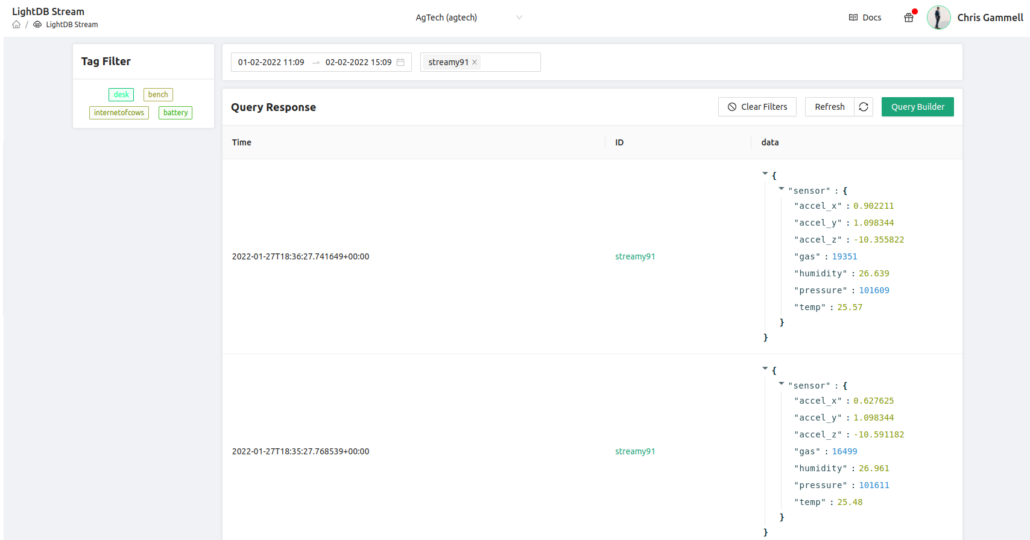
The Golioth Query Builder is built into the Golioth Console. Any time you are looking at data sent through the LightDB Stream database (and associated API), you will be looking at a Query. It’s accessed via the green button in the upper right corner of your LightDB Stream View:

Viewing datasets

So you have data piling up in your database and you want to try to make sense of it. In my case, I was streaming built-in sensor data from my Nordic Semiconductor Thingy91 over LightDB Stream to Golioth. Every minute the device sends the following:

  • Temperature
  • Pressure
  • Humidity
  • Gas
  • Accelerometer (as separate values for X, Y, and Z)

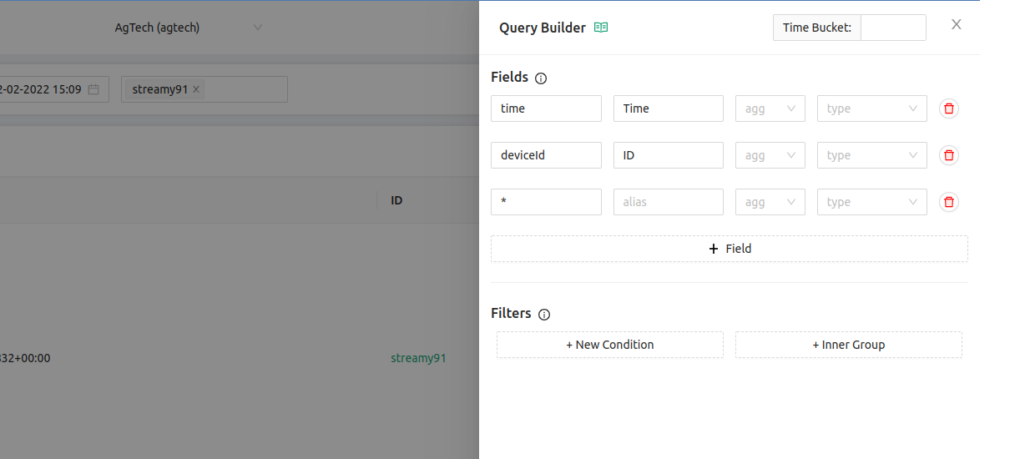
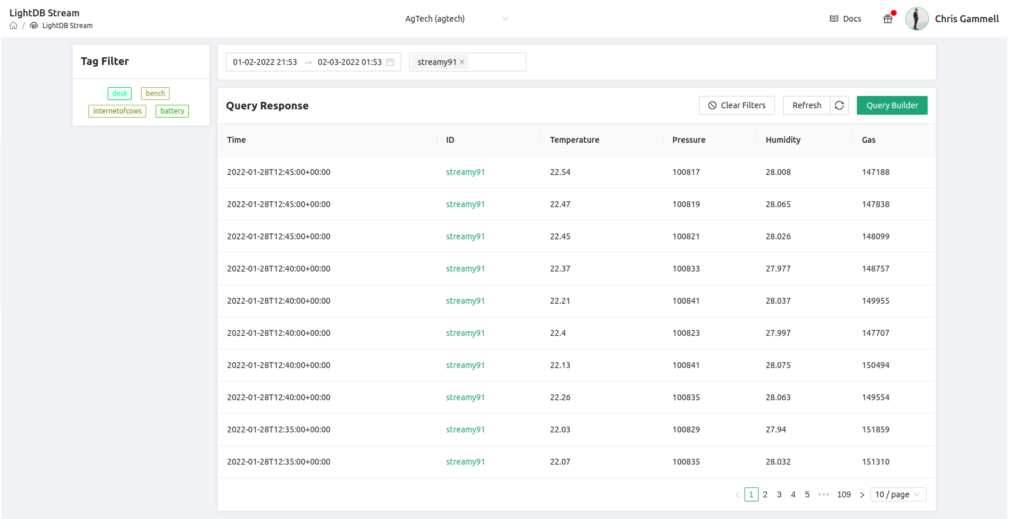
By default, your Query Builder has 3 fields pre-populated: time, deviceid, and *

This means that when you look at the output, there are columns that correspond to those fields. time is the timestamp of when the data was sent back (which is stored in LightDB Stream by default, as it is a time-series database). deviceid is the name of the device you’re looking at.

There is a secondary filter at the top of the page which can also narrow it to a particular piece of hardware. In the image above, you see this as “streamy91”, the name I gave to my device. This means that only the data from that one device will show on this page, though I can remove that device-specific filter and look at data across multiple devices in my deployment.

Finally, the * (star) operator is a directive to display all of the remaining data. This is formatted depending on how you created your LightDB Stream data from the firmware on your device. As a result, I see datapoints coming back that look like this:

Notice that the data is in its raw form, delivered in a hierarchical view (each data point is listed under sensor). This is how the Zephyr program on my nRF9160 is sending data back to the platform. It’s a useful way to organize and data, but makes it hard to view the data directly.

Cleaning up data

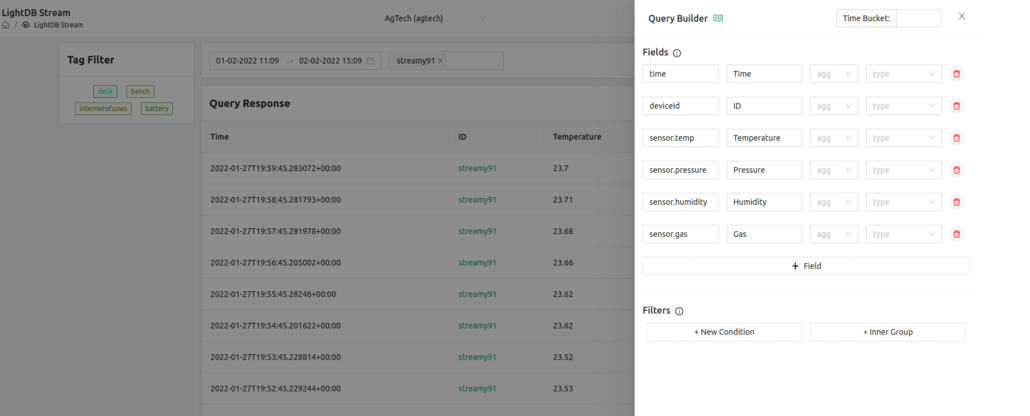
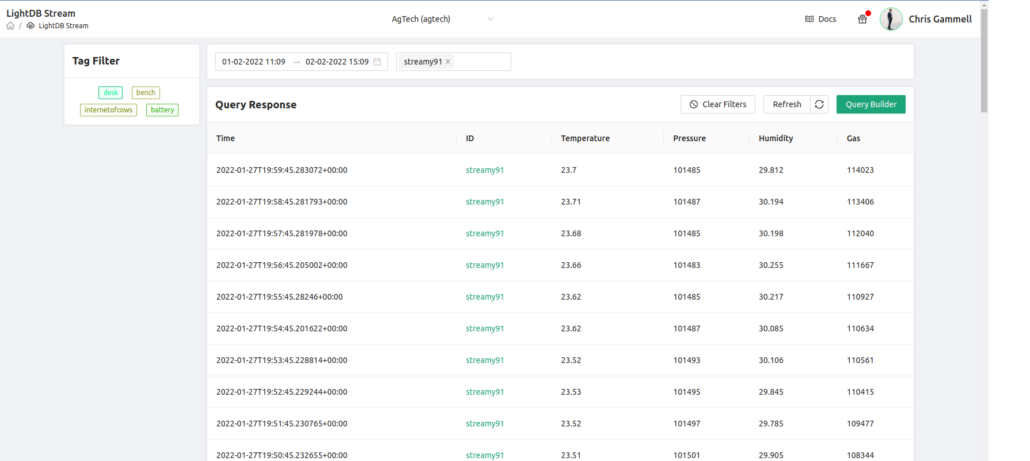
One of the most obvious values of the Query Builder is to clean up and modify how we view data coming back over LightDB Stream. Instead of having data as a JSON style hierarchy, I can break it out into side-by-side columns. I can also apply labels to make things a bit easier to read:

Already the table is much more readable. I left out accelerometer data as I wasn’t moving the device very much while this data was collected:

If I also want to see the raw data on this chart, I just add an additional field for * and it will add that hierarchical view as an additional column. In the above example we only have 7 data fields, but you can imagine with a complex product, you might be sending back tens or hundreds of fields that might be in that hierarchical view. Query builder already makes it easier to choose what data you want to display at any given time.

New views on the data

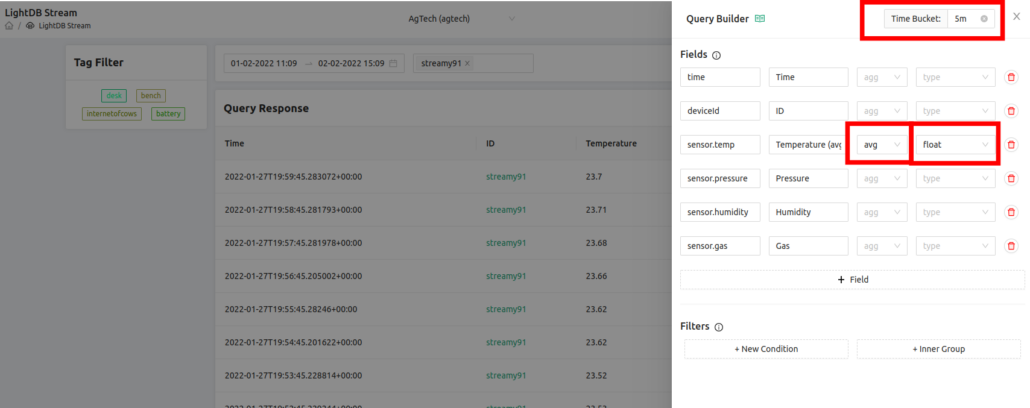
Now that we can better view the data and use visual scanning through the data, we see just how much of it is there. For a physical measurement like Temperature, we might not care about data every minute as it’s being sent back. In fact, we might want to average the values to smooth out small spikes in the data. We can easily add a modifier on any of the parameters:

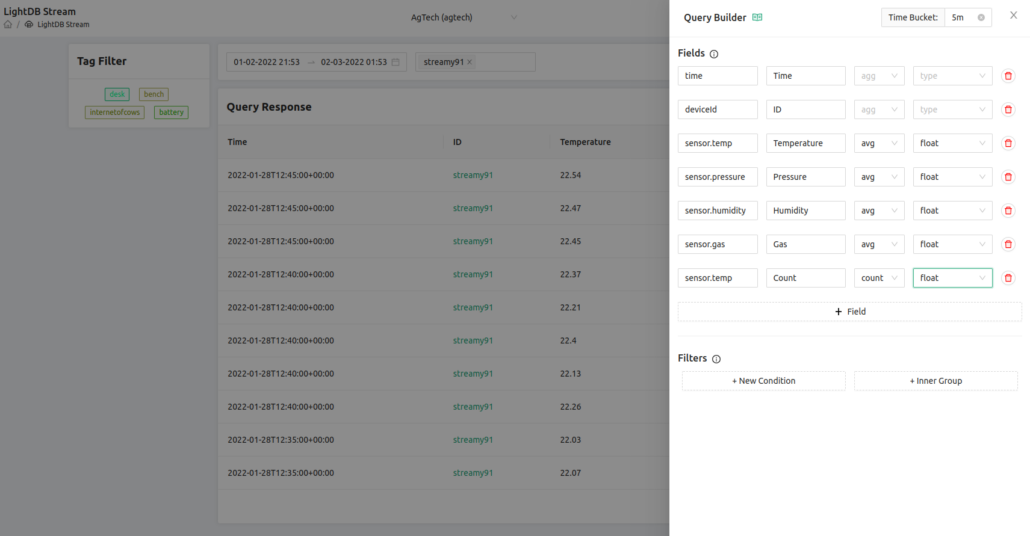
We choose avg to indicate we want to average the temperature field, float to indicate that field is representing a number, and we set the “Time Bucket” field to be 5m (5 minutes), though we can bucket by other conventions such as 10s (10 seconds), 1h (1 hour), or 2d (2 days). The higher the value for the time bucket, the more datapoints will be averaged together.

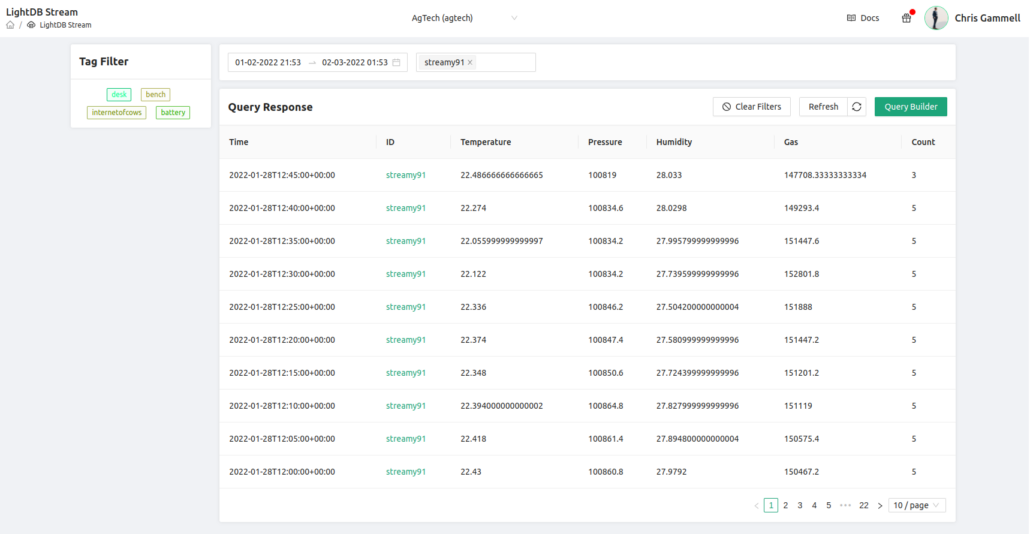
You’ll note here that the time column now is in 5 minute increments, however there are multiple datapoints at each of those buckets. That’s because we only averaged the sensor.temp data and not all of the fields we’re trying to show. Let’s now average all of the data shown on the screen and also add a new field that calculates the count of the sensor.temp column. This will showcase how many samples are in each bucket:

And now we see that each of these values have been averaged:

Take your queries with you

This is just the tip of the iceberg when it comes to displaying and filtering your data. We can set up even more complex queries using the filter, especially when implementing boolean functions. And though we are only looking at the output from one device in the example above, we might want to average across tens of devices that have the same tag (see our post on the power of tagging), such as devices that are in a test group, or are in a particular geographic area. The important thing is that the query builder gives users insight into how their data is streaming back from devices in the field and how they might be able to use it for their end goals.

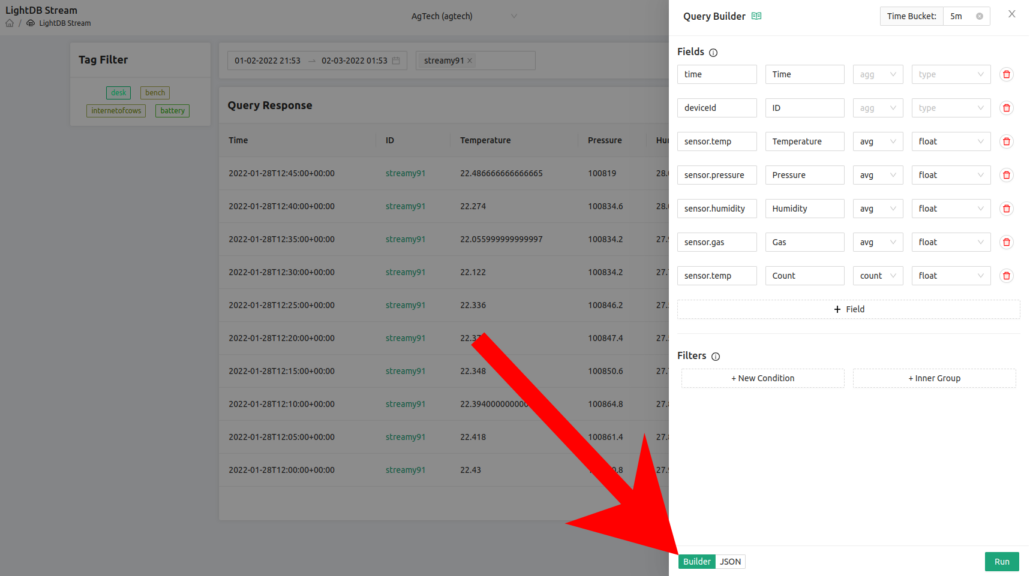
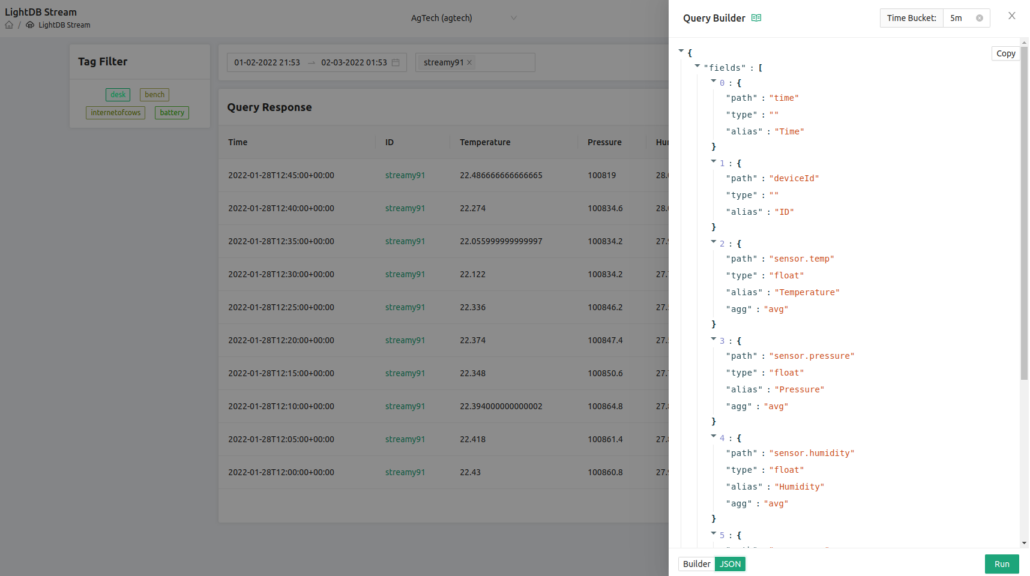
On that topic, the query builder lives up to its namesake: It is actually building the query for you. You can peek under the hood by switching from the “Builder” view to the “JSON” view:

The JSON view allows you to copy the JSON query that Golioth is using on the Console to manipulate the data on the LightDB Stream database.

You can take this query and use it to interact with the Golioth REST API from outside visualization tools, such as Grafana.

Parse your data, gain more insight

The Golioth Query Builder allows users to get a better understanding of what range of data is coming back to the cloud from their embedded devices. With a platform like Golioth, you can write code using our Zephyr SDK, send a firmware update using our DFU service, determine what data should be transported back to the cloud, and now viewing that data in a real time and more nuanced way. We are continually seeking to shorten the cycle from embedded programming to cloud data.

Like many of the Golioth features, the best way to learn is to try it yourself. The Golioth Dev Tier means you can build out a small deployment and see the power of easily sending data back through the Golioth cloud. Sign up for the Golioth Console today and start streaming data back using platforms like the nRF9160 or the ESP32. If you’d like to read more about how you can filter and slice your data to make it more useful, check out our Querying LightDB Stream documentation, to see even more ways to interact with data on the Golioth platform.

The new WebSockets feature on Golioth allows users to stream data out to external services, such as visualization platforms and web apps. This includes showing “real-time” data from sources on embedded devices, such as sensors. Let’s look at how these are different than previous offerings.

What is a WebSocket?

A WebSocket is a persistent connection that runs over TCP connections between two entities, normally a browser and a server. Thought about in the abstract, it is a datapipe that allows bidirectional information. Golioth is using these to push and pull data between the Golioth Cloud and another endpoint, such as a browser or visualization tool.

How is this different?

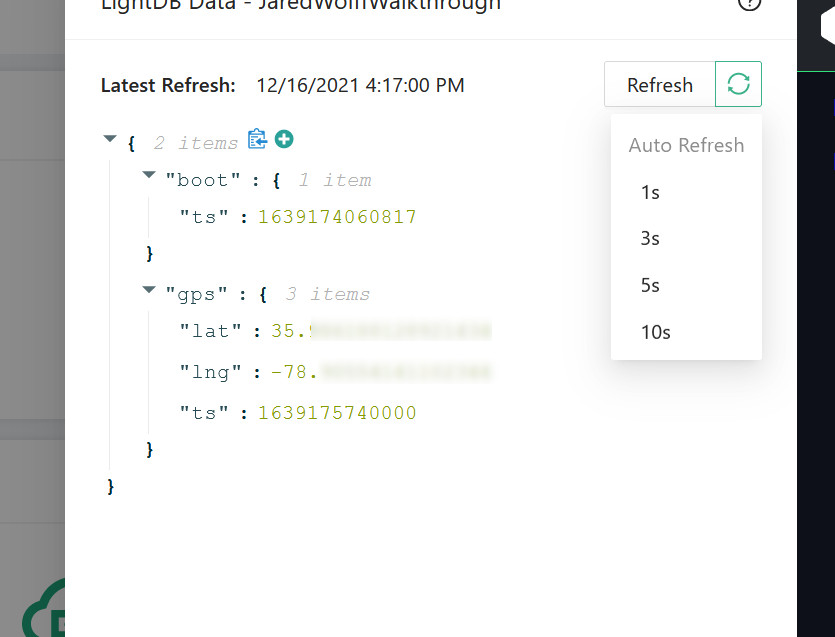
As a hardware engineer, I find myself falling into the familiar trap of, “it’s all just moving data around!”. But that, of course, is wrong. Once your data moves from your device up to the Golioth cloud, you normally want it to go somewhere or to do something. Readers familiar with our other service offerings will remember that we have a REST API. If you want to pull data using the REST API, you need to request that next chunk of data. An external application like an Android app would need to ask for an update from the API on a regular basis, perhaps every second. This pull action is akin to “polling” in a microcontroller. Hardware and firmware designers will know the downsides to this method, especially in terms of processing overhead. But it happens all over the web and there are lots of reasons to use the REST API. In fact, this is how we update the Golioth Console when users are viewing LightDB data:

With WebSockets, you are not polling; you are being pushed data as it appears on the platform. That is, “from the perspective of the web application showcasing the data”, it’s a push, instead of a pull. The WebSocket connection must remain open in order to receive this data, but if it is, any new data will flow to the web application on the other side. Combining a WebSocket with LightDB Stream (Golioth’s time-series database) allows you to potentially stream data from a device up to the Golioth cloud and then out to a charting service like Grafana. In this way, it’s a conduit for sensor data in “real-time” (overhead will cause some delay between the action and the charting of the event).

Let’s imagine environmental sensors connected to an nRF9160 development board like the CircuitDojo nRF9160 feather. In fact, there is a demo from Jared Wolff (creator of the nRF91 Feather), showcasing the environmental add-on board called the “Air Quality Wing”. That demo implements this using the REST API. Now instead of Grafana constantly pinging the REST API for the next data point, we’ll be able to update that demo to have data streaming directly to Grafana as a change happens. We’ll have demos showcasing this functionality in the near future.

Get started today

Our team released new documentation about WebSockets alongside the new functionality. We love to hear from users putting features to good use, so be sure to stop by Golioth Office Hours on our Discord server to show off what you have built.

Scaling makes things more difficult

As your deployments grow, things start to get messy.

At 100, or maybe even just below 1000 devices…you can do it however you’d like. You might have a spreadsheet listing the location of devices and all of the relevant information about them. But even then, it is a full-time job to manage devices. What’s more, as new people come in to take action on particular devices, they need to slice and dice the data about where the device is located, its status, the capabilities that the device has.  According to Satistia in 2021, there are more than 13.8 billion active IoT devices. It’s estimated that the number of active IoT devices will surpass 30 billion by the end of 2025.

A good organizational system will reduce mistakes

Planning and organizing will help you get your work done accurately while avoiding costly mistakes. Managing this huge number of devices requires a good organizational system. Golioth provides a simple solution to manage devices: tags.

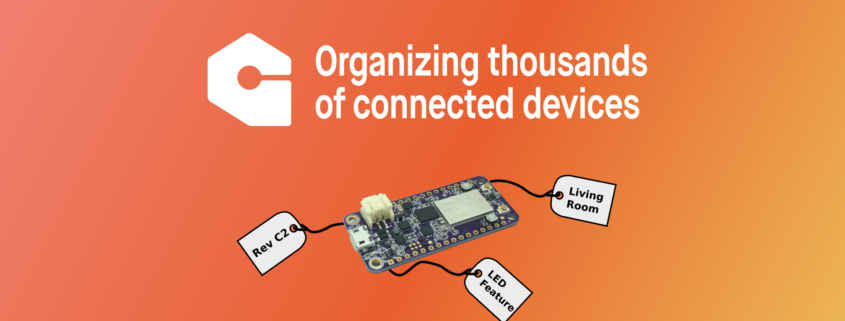
Tags provide a flexible, flat hierarchical structure in which you can group multiple devices. We are going to explore the usefulness of tagging in the Golioth platform.

Why use tags?

A tag is a simple text, generally, one to three words, that provides details about a device. The tag is assigned to a unique device on the Golioth network. Later, when searching, it is a simple click or search term in order to locate similar devices with the same tag.

You can easily separate your devices with any criteria you choose. For example, a separation between development devices and production devices. This can be useful when you want to change configurations for a specific set of devices. By using tags, you can group these devices and push the needed configuration using something like the OTA DFU on the nRF91.

You can also group different devices depending on your deployments or regions. Maybe you’re building an asset tracker application and you want to separate your devices that are on the east coast of the US vs the west coast. Or maybe you want to only update devices that are in a particular time zone. Or even separate when you push an update based on timezone, preferring to push firmware when no one is actively using the device. With tags, it’s possible to target firmware update deployment where and when you want it.

Flat structure

Right now, Golioth tags are a flat structure. You can assign multiple tags to a device without the concept of hierarchy. Even with this flat structure, it’s possible to do some powerful things like we just described. For example, using tags with LightDB allows us to pull or send data to specifically tagged devices. If you want to toggle an LED on a group of devices, you can send the new state to that group by sending the command to the associated tag, as shown in the video below. This is practical for test purposes. You can manipulate a device’s tags graphically on the console, or you can use the Golioth Command Lines Interface (CLI) to remove, add, or modify certain tags. The CLI in particular can be really useful as you start to have a deployment that’s much bigger (hundreds, thousands, millions).

When you’re ready to retrieve data from groups of devices, you can also query data and even do aggregations using tags. For example, if you want to see the average temperature of devices located on the 3rd floor in a factory, you could filter the logs for “factory”, “3rd floor”, “temperature” and then aggregate the data. Extending this idea, pulling data from tagged devices in a region could even lead to a sort of ad-hoc mapping.

Watch the demo


“I’m sorry boss, I am working as fast as I can here. I reprogrammed about 36 out of the total 50 units, but this is slow going. I only have one programming cable and I need to disassemble the deployed units so I can get to the header on the boards first.”

A bad firmware image on your deployed IoT devices can mean ruined weekends, upset customers, and lost time. Many businesses pursue a network based firmware update so that they can push new versions to their devices. In fact, this is a critical part of the firmware development process, often a very early one. Developing or implementing a bootloader allows engineers to ship new control software to their devices. A straw poll on Twitter showed that some engineers spend a significant amount of time putting this tooling in place.

While the “barely any time” group seems large, it also includes those who aren’t doing a custom bootloader, nor a bootloader that is networked:

In the past, networked firmware updates took a significant amount of planning and coordination between hardware, firmware, software, and web teams. Golioth has collapsed this down to a simple process.

Update all the devices in your fleet with the click of a button

Golioth Device Firmware Update (DFU) is possible because the Golioth SDK is built on top of the Zephyr Project. Part of that implementation includes MCUboot, an open source bootloader. Using open source software up and down the stack, Golioth enables quick, secure deployment of firmware packages to IoT devices throughout the world. The Golioth Console enables easy management of firmware releases, including multi-part binary bundles, enabling updates for devices as diverse as smart speakers, digital signage, machine learning enabled sensor systems, multiple processor embedded devices, and more.

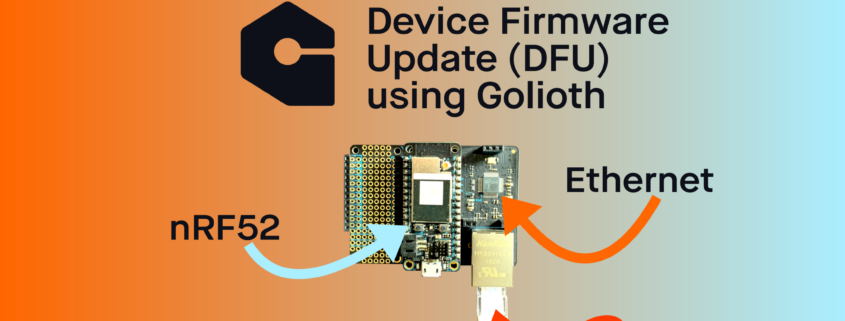
In the video linked below, Lead Engineer Alvaro Viebrantz demonstrates with Chris Gammell how to update the firmware of an nRF52 based device over Ethernet. The video includes code snippets in Zephyr and walking through the build process using the command line tool West. Once the firmware image is built, Alvaro showcases how to push the image to the Golioth cloud, package it for delivery, and then deploying to Golioth enabled devices.

No more fussing with programming cables out in the field, Golioth allows engineers to update their devices with new features, requested fixes, and efficiency improvements. Try it out today!

About Golioth

Golioth is a cloud company dedicated to making it easier to prototype, deploy, and manage IoT systems. Learn more by joining the Golioth Beta program and reading through Golioth Documentation.