IoT devices have the potential to generate a LOT of data. That’s kind of the point, right? You have a fleet spread out among a geographic area, or factory, or warehouse, or wherever you’re trying to measure data and you pipe it all back to the internet to collate that data for use elsewhere.
How do we make sense of all that data?
Other posts on this blog have showcased how you might chart the data using Grafana, or pipe it to an app using WebSockets. But before you do that, you probably want to get a feel for what’s in your dataset, especially as you’re streaming more and more data back to the platform. Today we’re going to explore that data using the Golioth Query Builder.
What is the Golioth Query Builder?
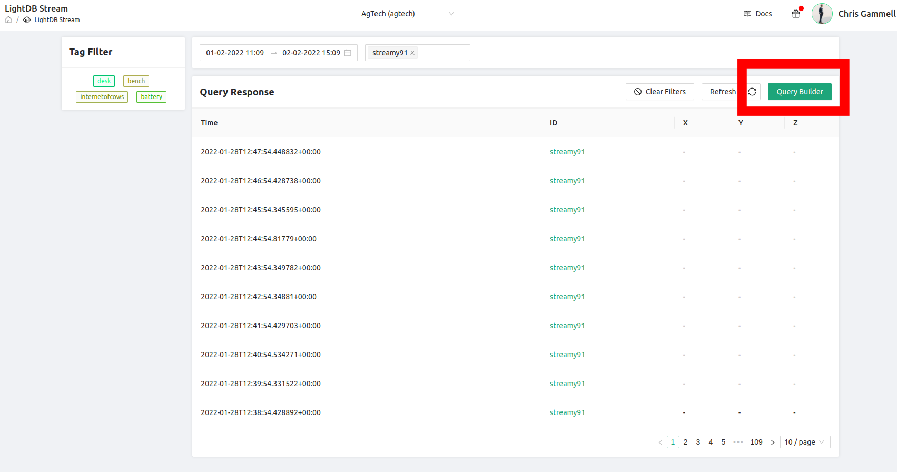
The Golioth Query Builder is built into the Golioth Console. Any time you are looking at data sent through the LightDB Stream database (and associated API), you will be looking at a Query. It’s accessed via the green button in the upper right corner of your LightDB Stream View:
Viewing datasets
So you have data piling up in your database and you want to try to make sense of it. In my case, I was streaming built-in sensor data from my Nordic Semiconductor Thingy91 over LightDB Stream to Golioth. Every minute the device sends the following:
- Temperature
- Pressure
- Humidity
- Gas
- Accelerometer (as separate values for X, Y, and Z)
By default, your Query Builder has 3 fields pre-populated: time, deviceid, and *
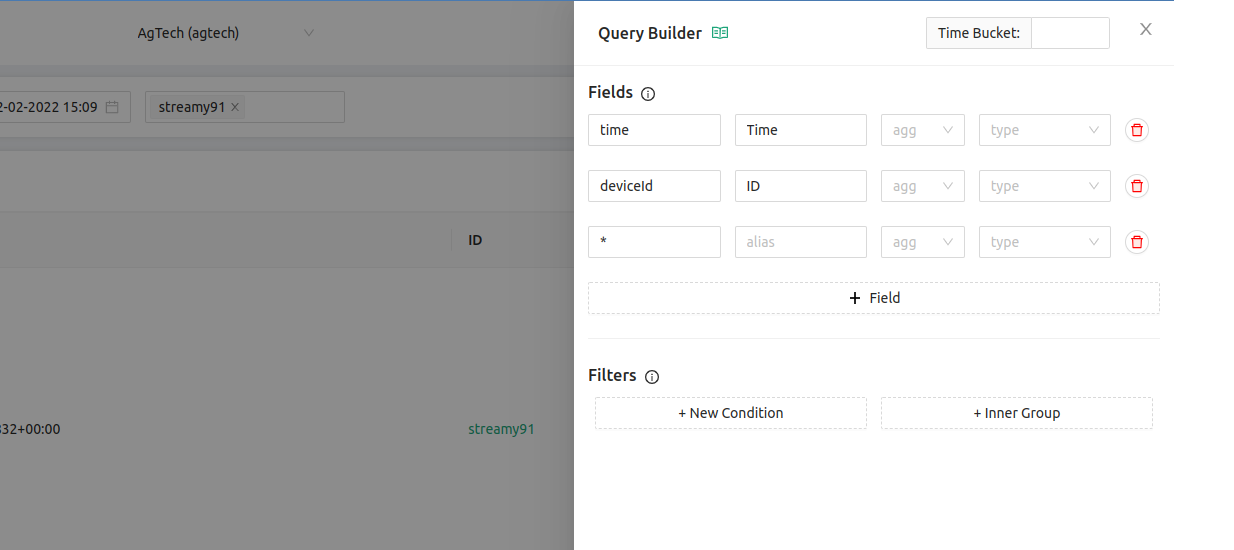
This means that when you look at the output, there are columns that correspond to those fields. time is the timestamp of when the data was sent back (which is stored in LightDB Stream by default, as it is a time-series database). deviceid is the name of the device you’re looking at.
There is a secondary filter at the top of the page which can also narrow it to a particular piece of hardware. In the image above, you see this as “streamy91”, the name I gave to my device. This means that only the data from that one device will show on this page, though I can remove that device-specific filter and look at data across multiple devices in my deployment.
Finally, the * (star) operator is a directive to display all of the remaining data. This is formatted depending on how you created your LightDB Stream data from the firmware on your device. As a result, I see datapoints coming back that look like this:
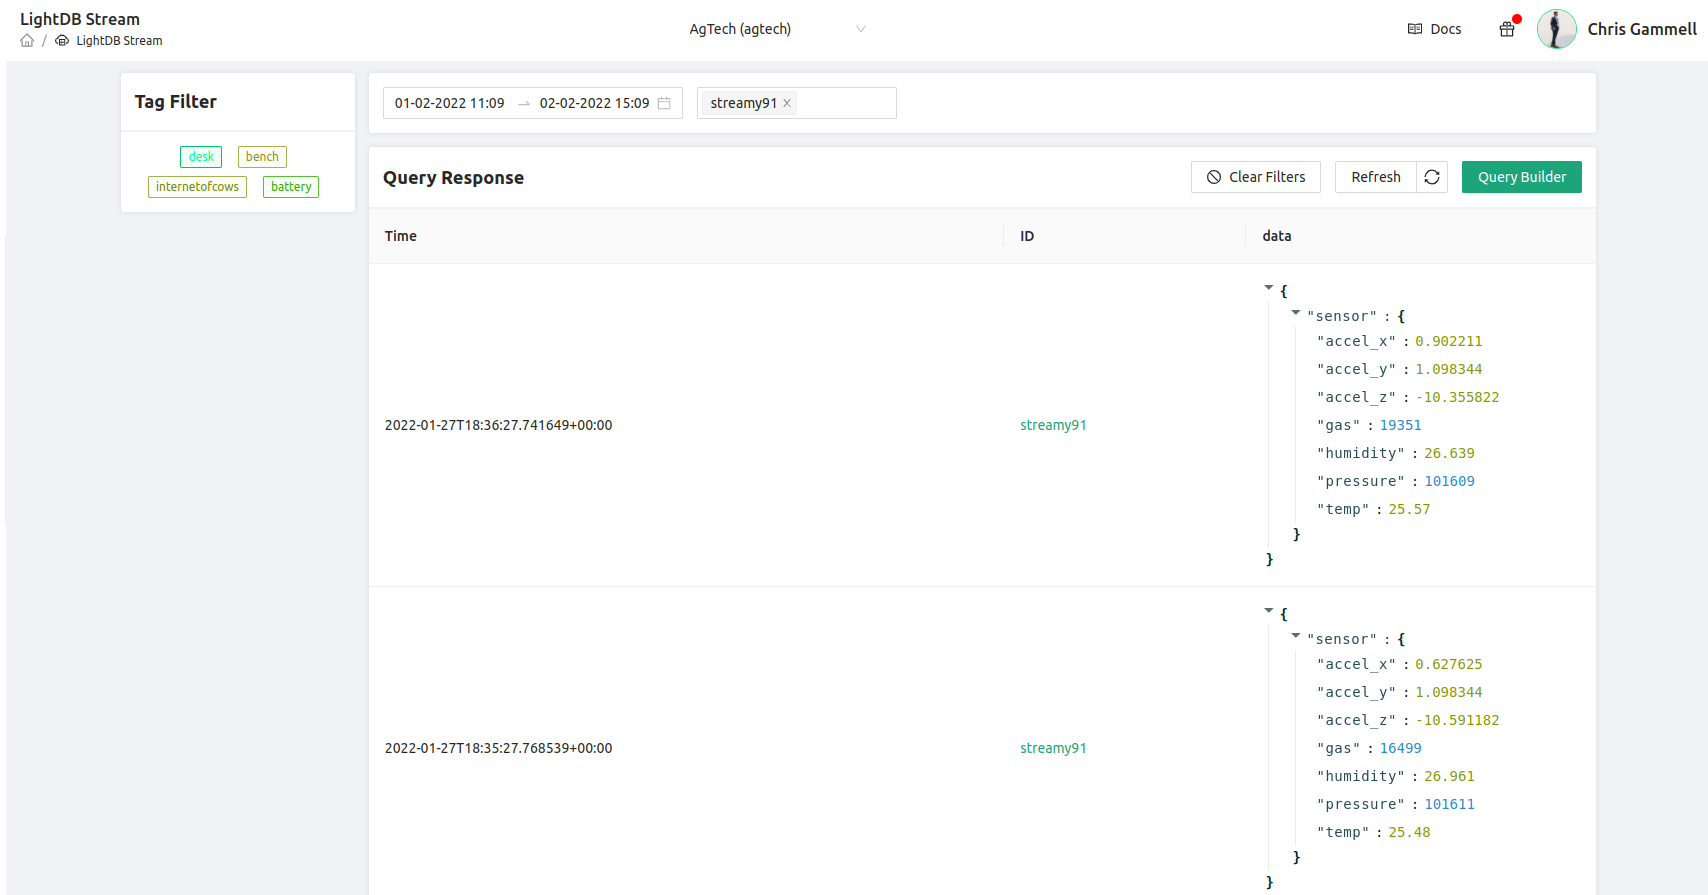
Notice that the data is in its raw form, delivered in a hierarchical view (each data point is listed under sensor). This is how the Zephyr program on my nRF9160 is sending data back to the platform. It’s a useful way to organize and data, but makes it hard to view the data directly.
Cleaning up data
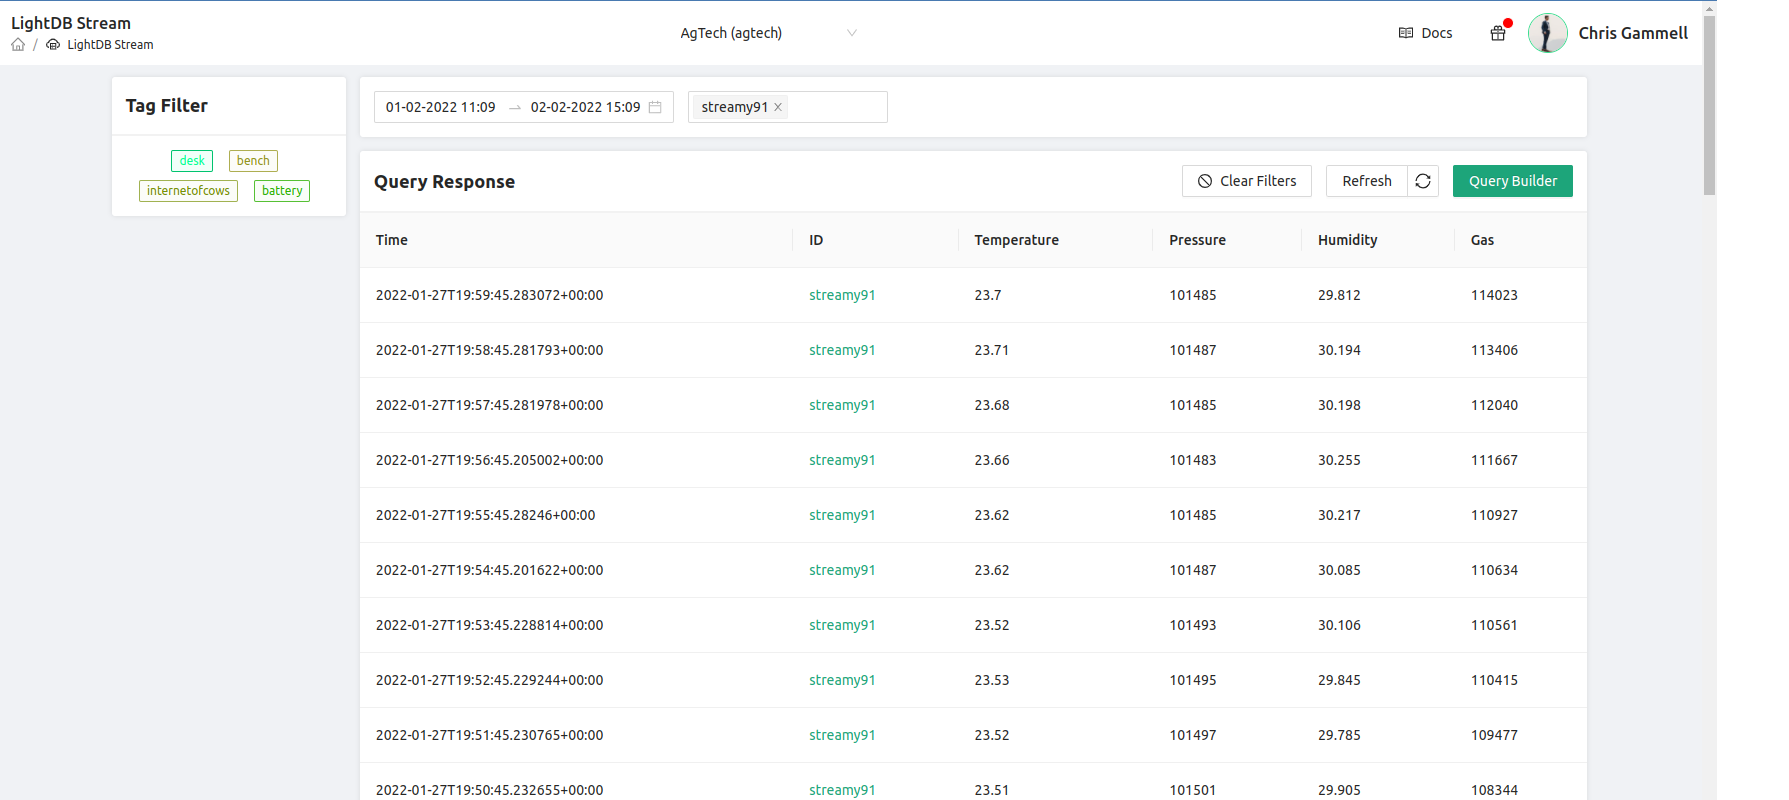
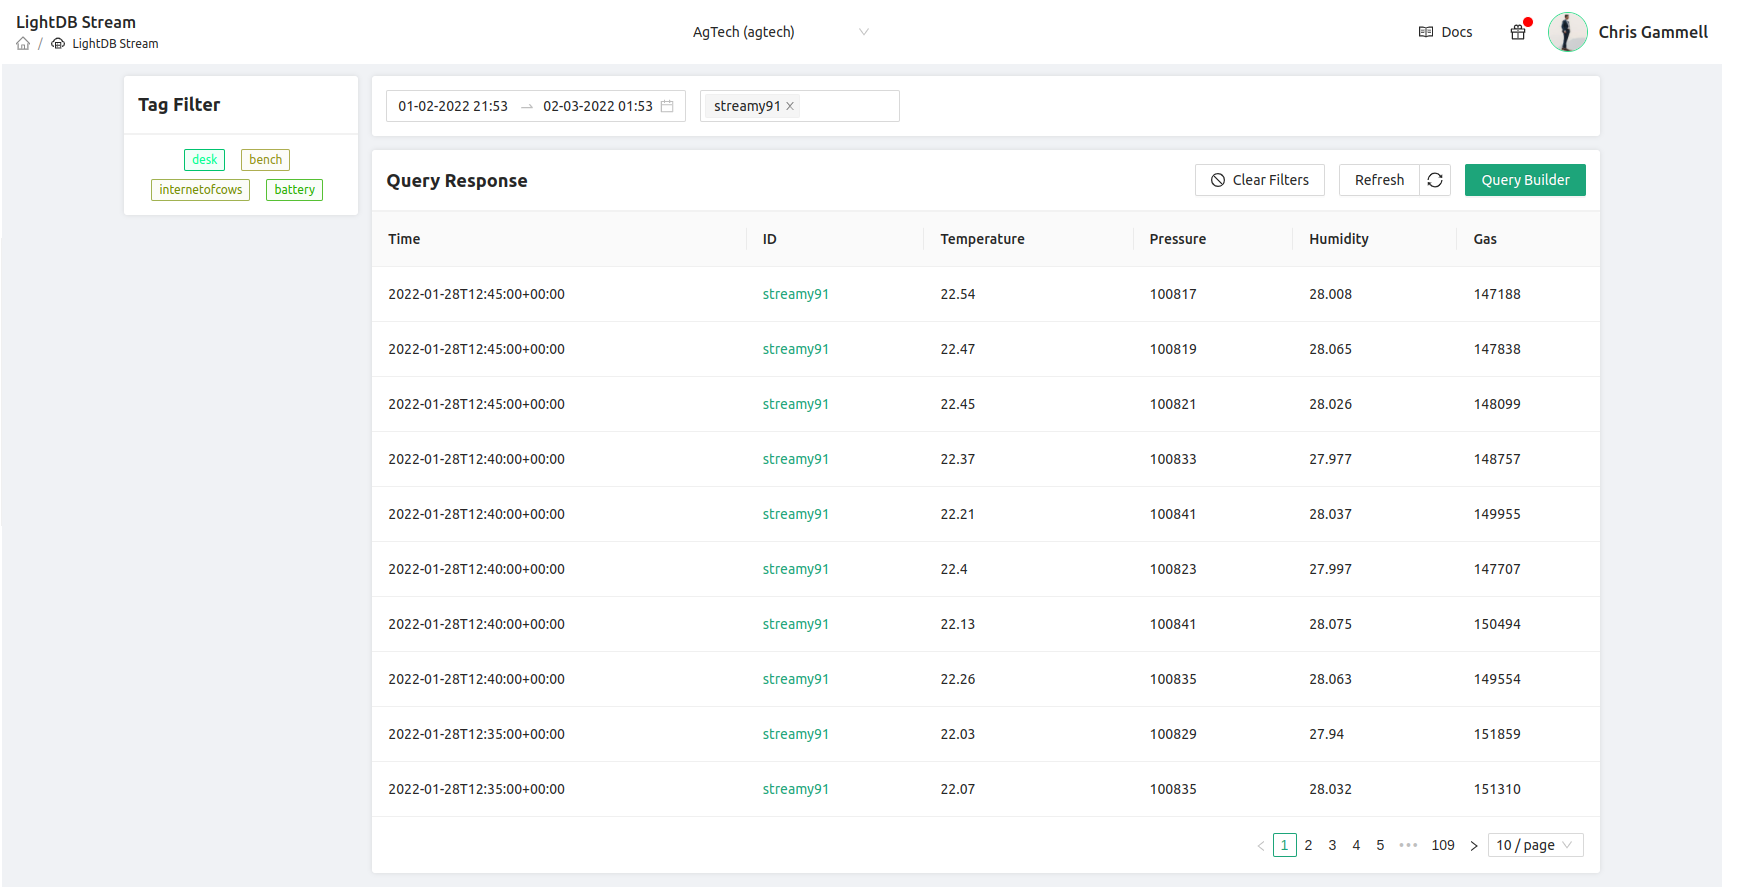
One of the most obvious values of the Query Builder is to clean up and modify how we view data coming back over LightDB Stream. Instead of having data as a JSON style hierarchy, I can break it out into side-by-side columns. I can also apply labels to make things a bit easier to read:

Already the table is much more readable. I left out accelerometer data as I wasn’t moving the device very much while this data was collected:
If I also want to see the raw data on this chart, I just add an additional field for * and it will add that hierarchical view as an additional column. In the above example we only have 7 data fields, but you can imagine with a complex product, you might be sending back tens or hundreds of fields that might be in that hierarchical view. Query builder already makes it easier to choose what data you want to display at any given time.
New views on the data
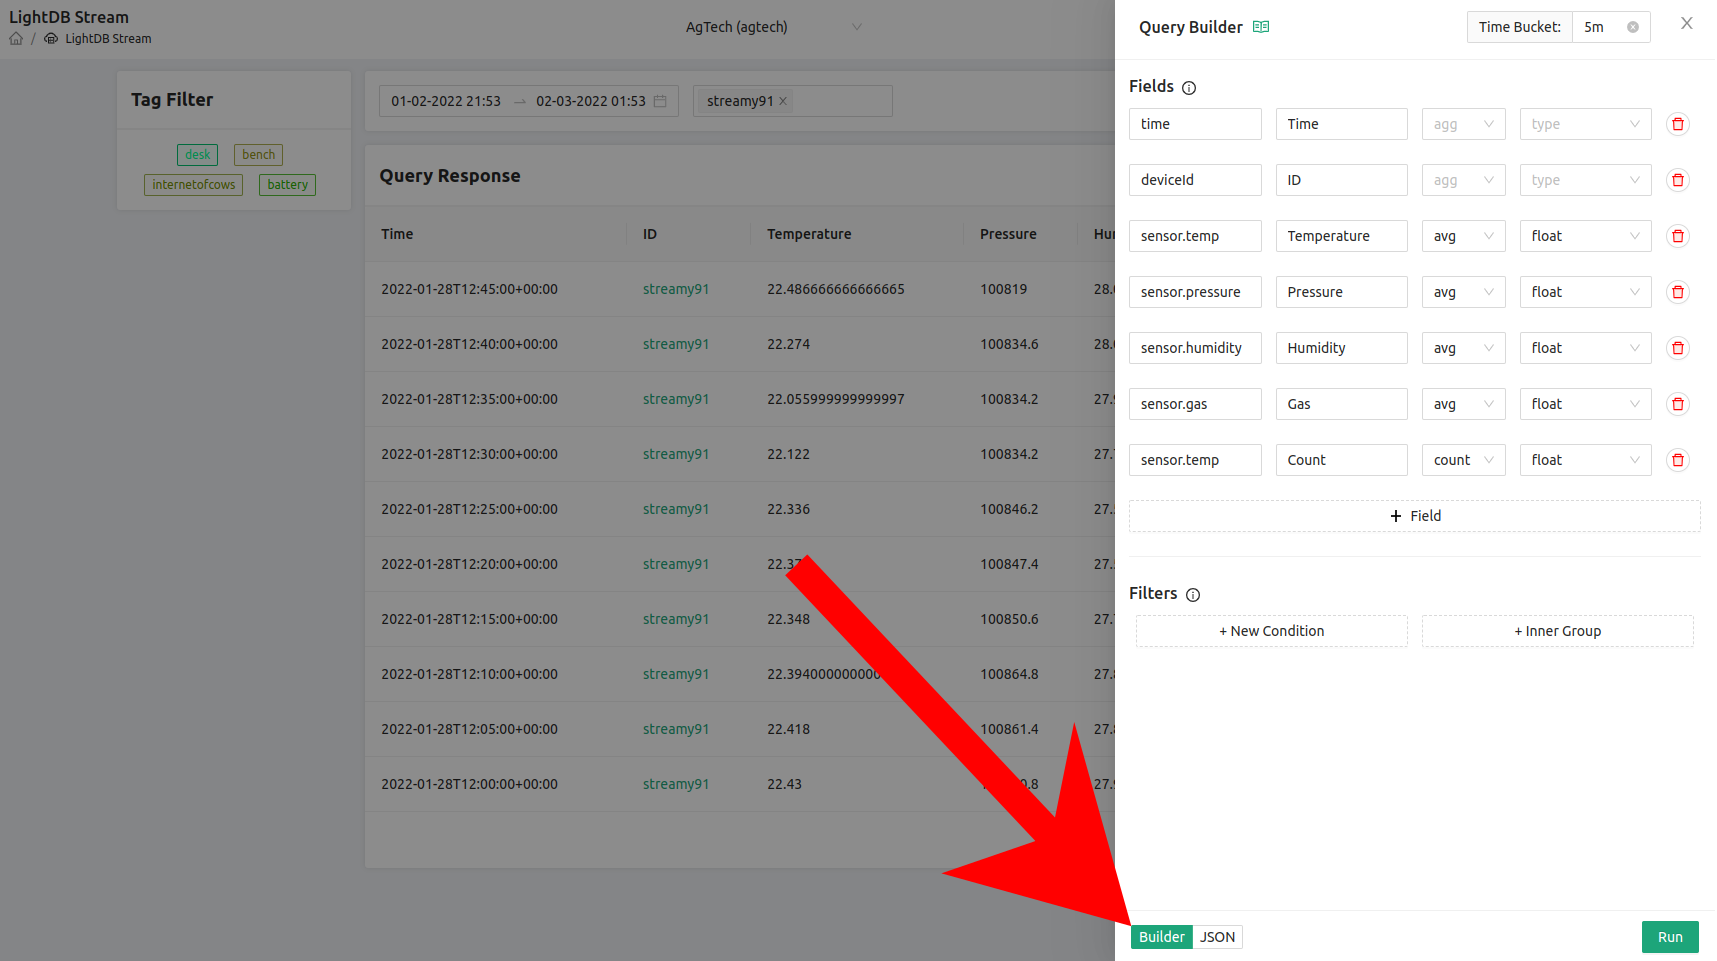
Now that we can better view the data and use visual scanning through the data, we see just how much of it is there. For a physical measurement like Temperature, we might not care about data every minute as it’s being sent back. In fact, we might want to average the values to smooth out small spikes in the data. We can easily add a modifier on any of the parameters:
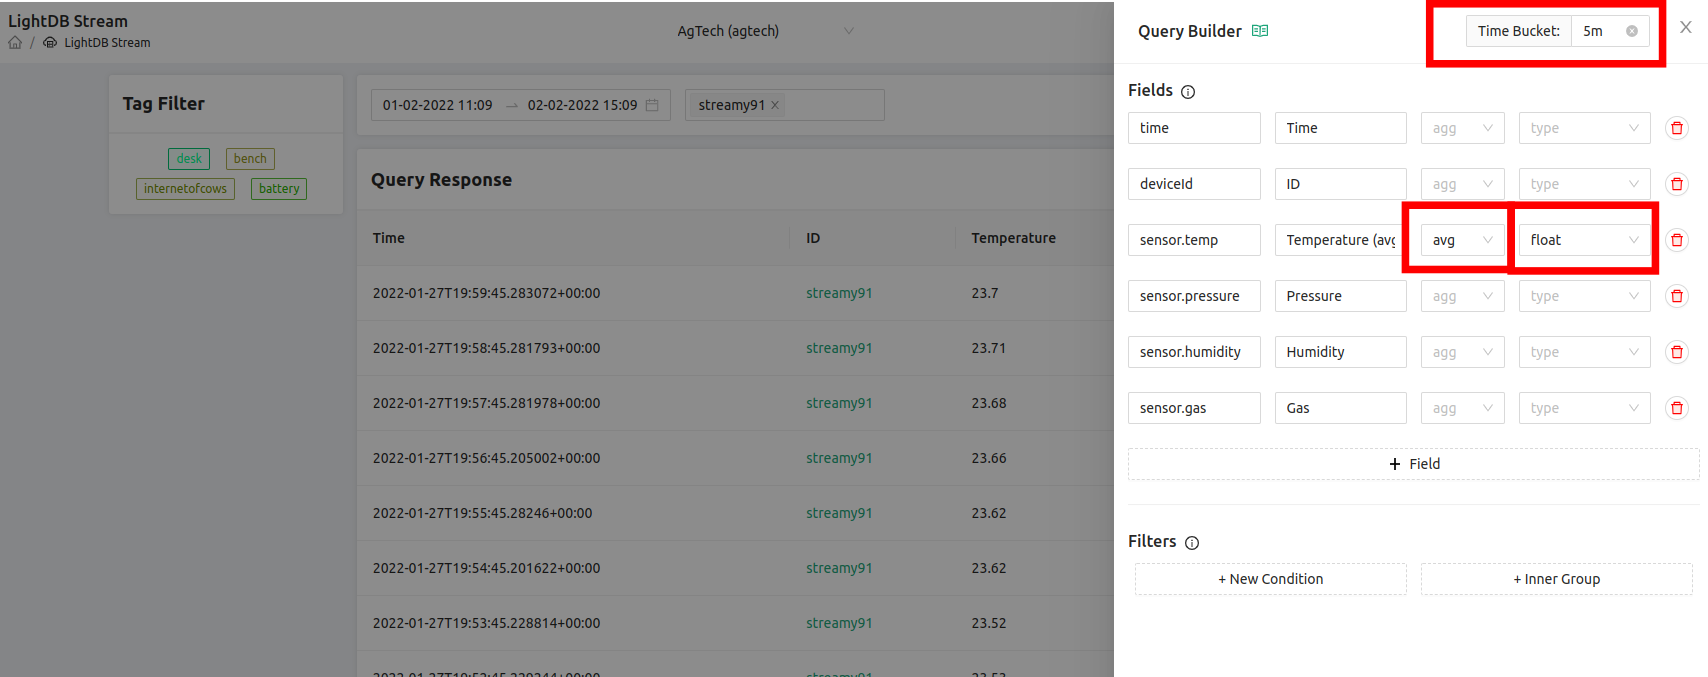
We choose avg to indicate we want to average the temperature field, float to indicate that field is representing a number, and we set the “Time Bucket” field to be 5m (5 minutes), though we can bucket by other conventions such as 10s (10 seconds), 1h (1 hour), or 2d (2 days). The higher the value for the time bucket, the more datapoints will be averaged together.
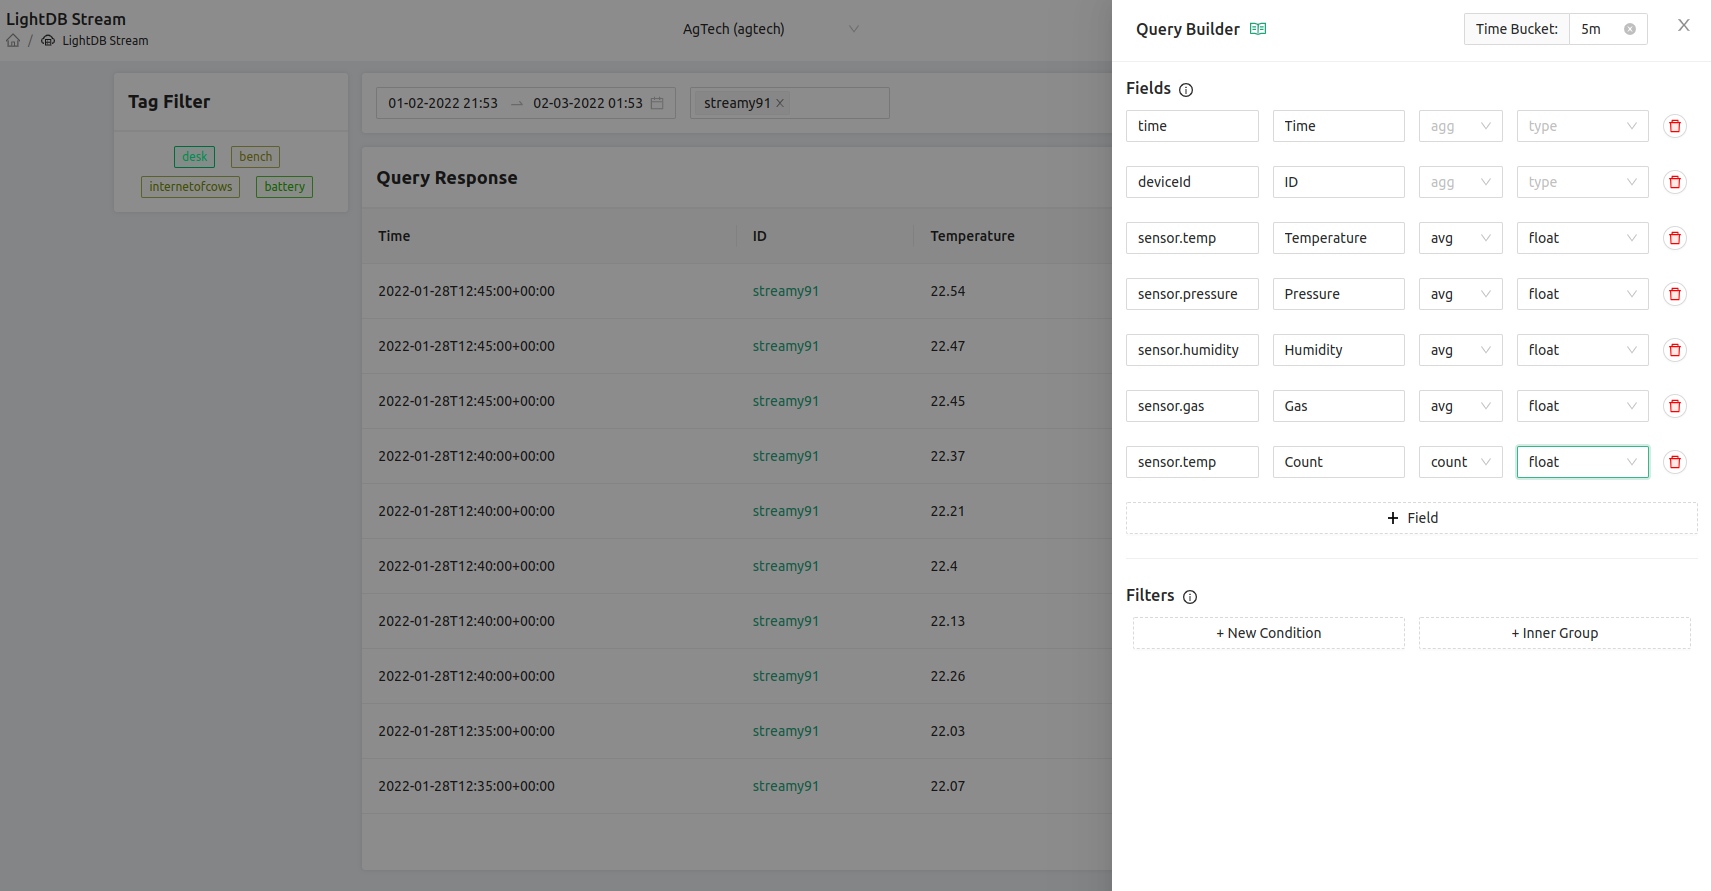
You’ll note here that the time column now is in 5 minute increments, however there are multiple datapoints at each of those buckets. That’s because we only averaged the sensor.temp data and not all of the fields we’re trying to show. Let’s now average all of the data shown on the screen and also add a new field that calculates the count of the sensor.temp column. This will showcase how many samples are in each bucket:
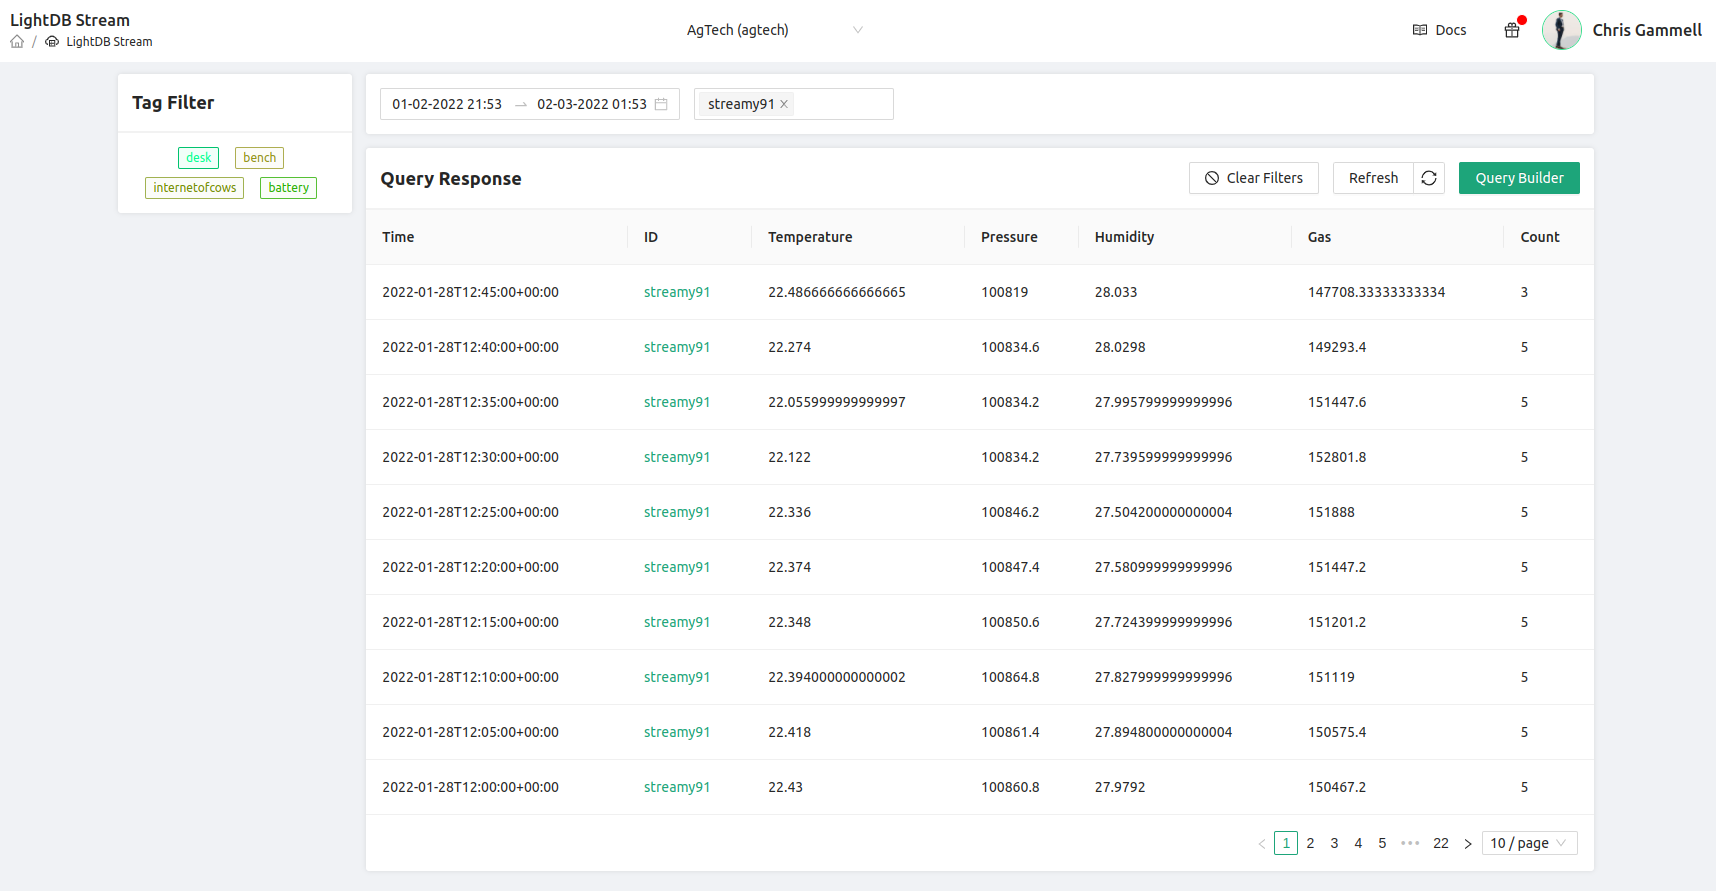
And now we see that each of these values have been averaged:
Take your queries with you
This is just the tip of the iceberg when it comes to displaying and filtering your data. We can set up even more complex queries using the filter, especially when implementing boolean functions. And though we are only looking at the output from one device in the example above, we might want to average across tens of devices that have the same tag (see our post on the power of tagging), such as devices that are in a test group, or are in a particular geographic area. The important thing is that the query builder gives users insight into how their data is streaming back from devices in the field and how they might be able to use it for their end goals.
On that topic, the query builder lives up to its namesake: It is actually building the query for you. You can peek under the hood by switching from the “Builder” view to the “JSON” view:
The JSON view allows you to copy the JSON query that Golioth is using on the Console to manipulate the data on the LightDB Stream database.
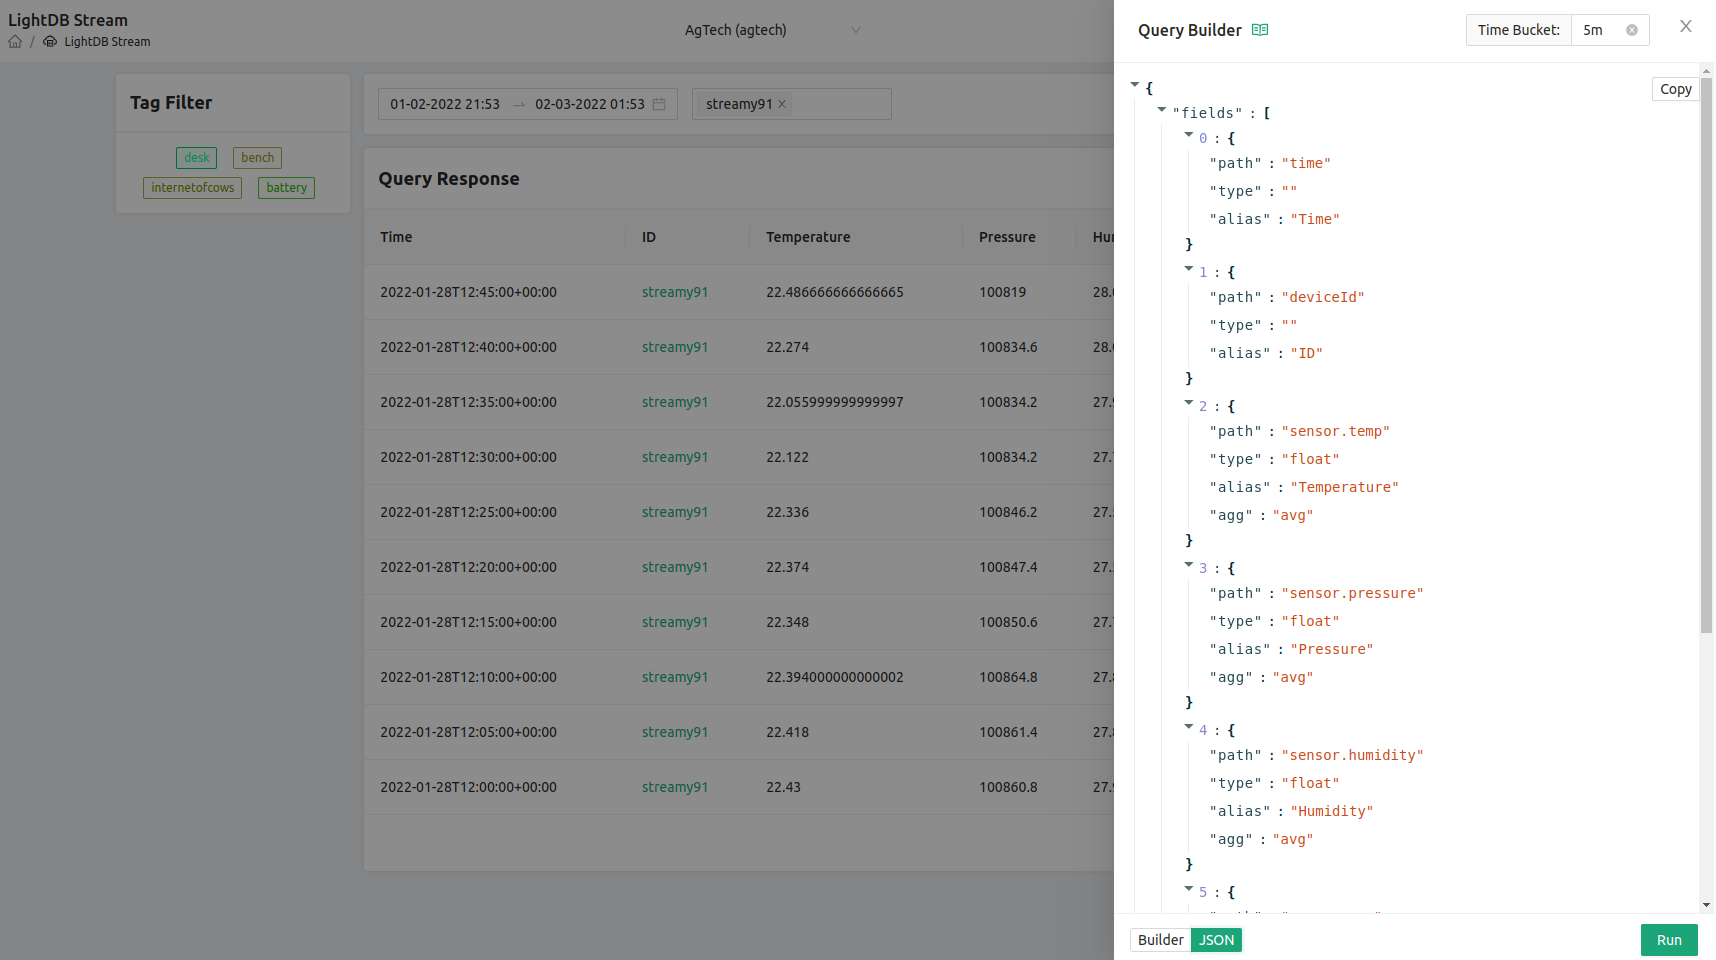
You can take this query and use it to interact with the Golioth REST API from outside visualization tools, such as Grafana.
Parse your data, gain more insight
The Golioth Query Builder allows users to get a better understanding of what range of data is coming back to the cloud from their embedded devices. With a platform like Golioth, you can write code using our Zephyr SDK, send a firmware update using our DFU service, determine what data should be transported back to the cloud, and now viewing that data in a real time and more nuanced way. We are continually seeking to shorten the cycle from embedded programming to cloud data.
Like many of the Golioth features, the best way to learn is to try it yourself. The Golioth Dev Tier means you can build out a small deployment and see the power of easily sending data back through the Golioth cloud. Sign up for the Golioth Console today and start streaming data back using platforms like the nRF9160 or the ESP32. If you’d like to read more about how you can filter and slice your data to make it more useful, check out our Querying LightDB Stream documentation, to see even more ways to interact with data on the Golioth platform.
