This is the second part of How Golioth uses Hardware-in-the-Loop (HIL) Testing. In the first part, I covered what HIL testing is, why we use it at Golioth, and provided a high-level view of the system.
In this post, I’ll talk about each step we took to set up our HIL. It’s my belief that HIL testing should be a part of any firmware testing strategy, and my goal with this post is to show you that it’s not so difficult to get a minimum viable HIL set up within one week.
The Big Pieces
To recap, this is the system block diagram presented at the end of part 1:
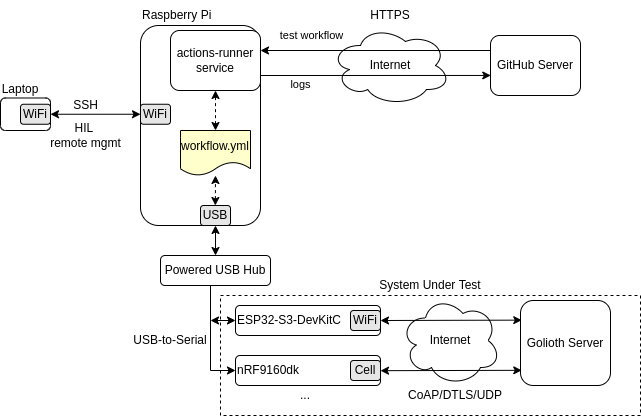
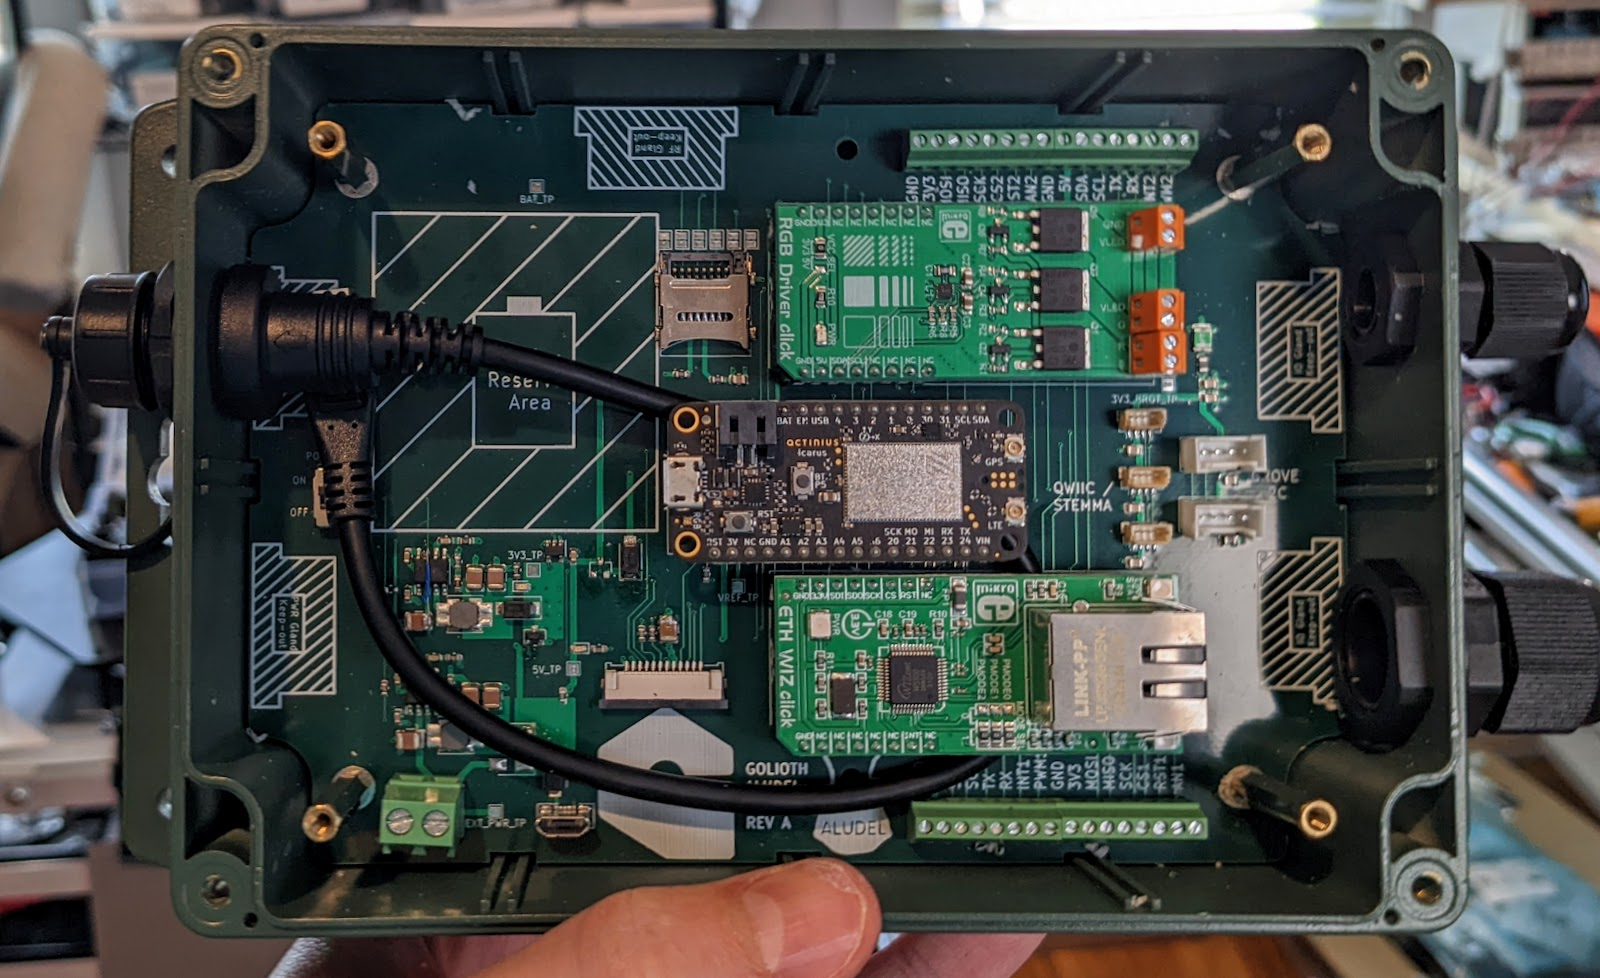
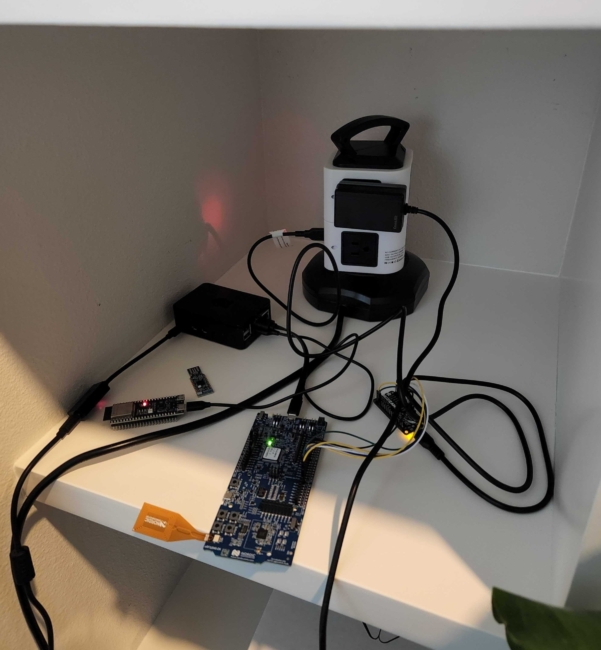
The Raspberry Pi acts as a GitHub Actions Self-Hosted Runner which communicates with microcontroller devices via USB-to-serial adapters.
The major software pieces required are:
- Firmware with Built-In-Test Capabilities – Runs tests on the device (e.g. ESP32-S3-DevKitC), and reports pass/fail for each test over serial.
- Python Test Runner Script – Initiates tests and checks serial output from device. Runs on the self-hosted runner (e.g. Raspberry Pi).
- GitHub Actions Workflow – Initiates the python test runner and reports results to GitHub. Runs on the self-hosted runner.
Firmware Built-In-Test
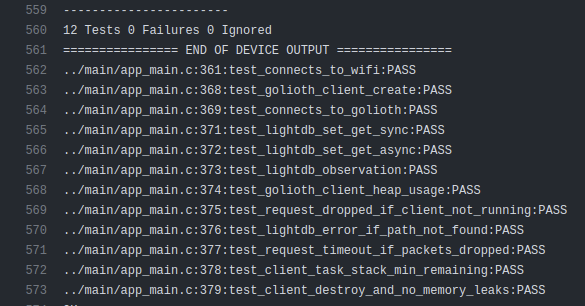
To test our SDK, we use a special build of firmware which exposes commands over a shell/CLI interface. There is a command named built_in_test which runs a suite of tests in firmware:
esp32> built_in_test
...
12 Tests 0 Failures 0 Ignored
../main/app_main.c:371:test_connects_to_wifi:PASS
../main/app_main.c:378:test_golioth_client_create:PASS
../main/app_main.c:379:test_connects_to_golioth:PASS
../main/app_main.c:381:test_lightdb_set_get_sync:PASS
../main/app_main.c:382:test_lightdb_set_get_async:PASS
../main/app_main.c:383:test_lightdb_observation:PASS
../main/app_main.c:384:test_golioth_client_heap_usage:PASS
../main/app_main.c:385:test_request_dropped_if_client_not_running:PASS
../main/app_main.c:386:test_lightdb_error_if_path_not_found:PASS
../main/app_main.c:387:test_request_timeout_if_packets_dropped:PASS
../main/app_main.c:388:test_client_task_stack_min_remaining:PASS
../main/app_main.c:389:test_client_destroy_and_no_memory_leaks:PASS
These tests cover major functionality of the SDK, including connecting to Golioth servers, and sending/receiving CoAP messages. There are also a couple of tests to verify that stack and heap usage are within allowed limits, and that there are no detected memory leaks.
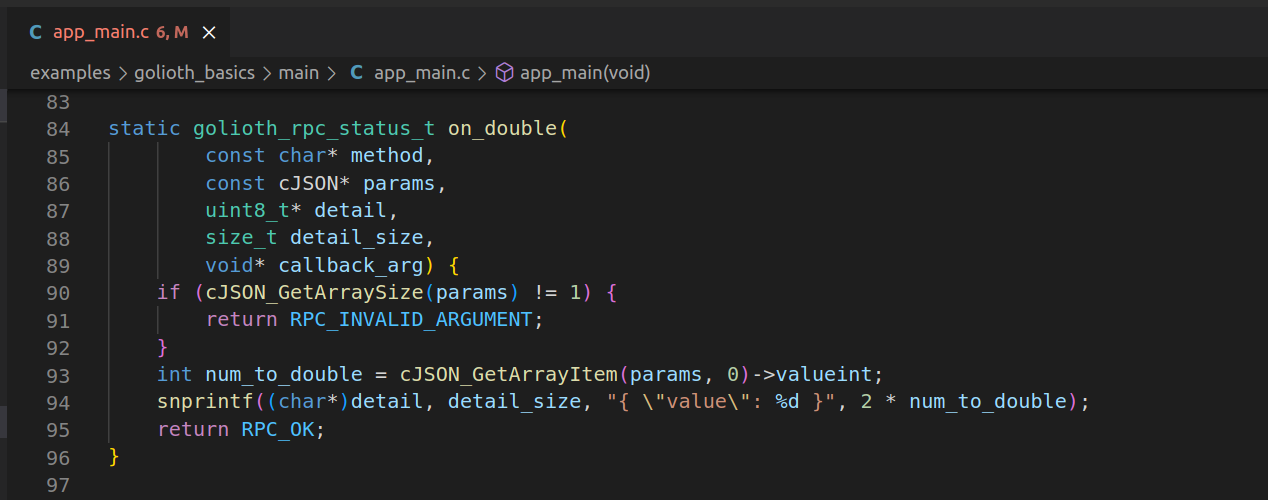
Here’s an example of one of the tests that runs on the device, test_connects_to_golioth:
#include "unity.h"
#include "golioth.h"

static golioth_client_t _client;
static SemaphoreHandle_t _connected_sem;

static void on_client_event(golioth_client_t client,
                            golioth_client_event_t event,
                            void* arg) {
    if (event == GOLIOTH_CLIENT_EVENT_CONNECTED) {
        xSemaphoreGive(_connected_sem);
    }
}

static void test_connects_to_golioth(void) {
    TEST_ASSERT_NOT_NULL(_client);
    TEST_ASSERT_EQUAL(GOLIOTH_OK, golioth_client_start(_client));
    TEST_ASSERT_EQUAL(pdTRUE, xSemaphoreTake(_connected_sem, 10000 / portTICK_PERIOD_MS));
}
This test attempts to connect to Golioth servers. If it connects, a semaphore is given which the test waits on for up to 10 seconds (or else the test fails). For such a simple test, it covers a large portion of our SDK, including the network stack (WiFi/IP/UDP), security (DTLS), and CoAP Rx/Tx.
We use the Unity test framework for basic test execution and assertion macros.
If you’re curious about the details, you can see the full test code here: https://github.com/golioth/golioth-firmware-sdk/blob/main/examples/esp_idf/test/main/app_main.c
Python Test Runner
Another key piece of software is a Python script that runs on the self-hosted runner and communicates with the device over serial. We call this script verify.py. In this script, we provision the device with credentials, issue the built_in_test command, and verify the serial output to make sure all tests pass.
Here’s the main function of the script:
def main():
    port = sys.argv[1]

    # Connect to the device over serial and use the shell CLI to interact and run tests
    ser = serial.Serial(port, 115200, timeout=1)

    # Set WiFi and Golioth credentials over device shell CLI
    set_credentials(ser)
    reset(ser)

    # Run built in tests on the device and check output
    num_test_failures = run_built_in_tests(ser)
    reset(ser)

    if num_test_failures == 0:
        run_ota_test(ser)

    sys.exit(num_test_failures)
This opens the serial port and calls various helper functions to set credentials, reset the board, run built-in-tests, and run an OTA test. The exit code is the number of failed tests, so 0 means all passed.
The script spends most of its time in this helper function which looks for a string in a line of serial text:
def wait_for_str_in_line(ser, str, timeout_s=20, log=True):
    start_time = time()
    while True:
        line = ser.readline().decode('utf-8', errors='replace').replace("\r\n", "")
        if line != "" and log:
            print(line)
        if "CPU halted" in line:
            raise RuntimeError(line)
        if time() - start_time > timeout_s:
            raise RuntimeError('Timeout')
        if str in line:
            return line
The script will continually read lines from serial for up to timeout_s seconds until it finds what it’s looking for. And if “CPU halted” ever appears in the output, that means the board crashed, so a runtime error is raised.
This verify.py script is what gets invoked by the GitHub Actions Workflow file.
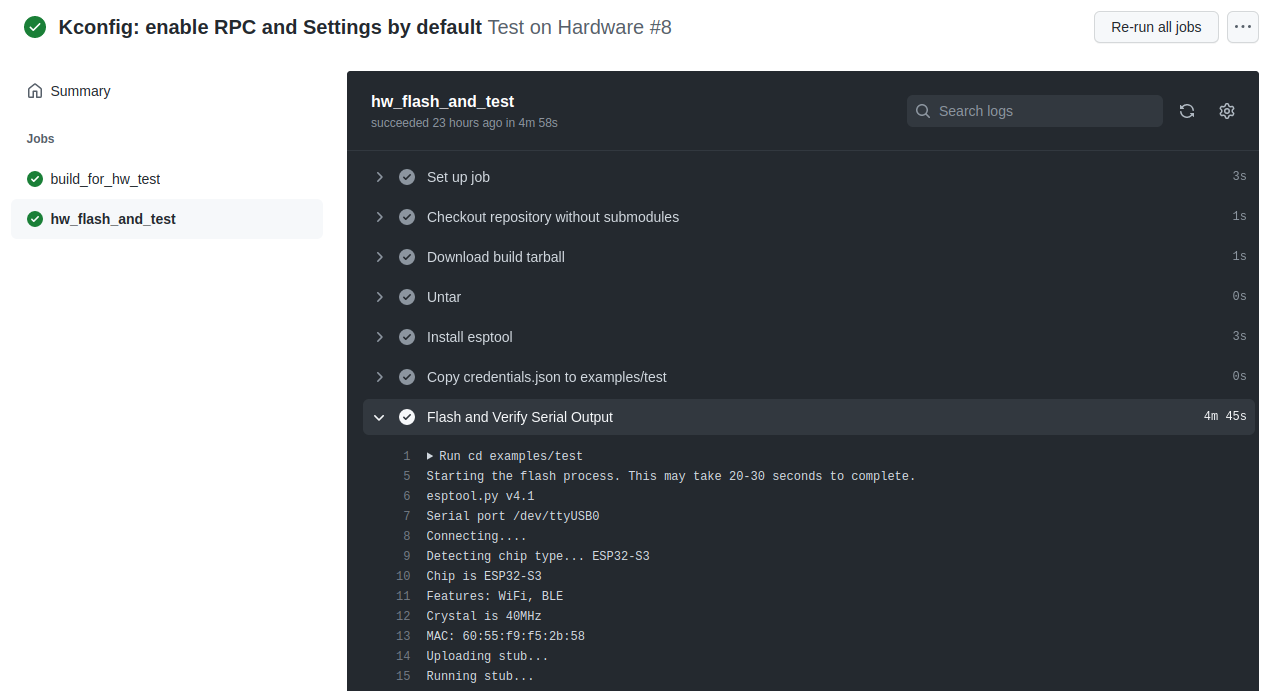
GitHub Actions Workflow
The workflow file is a YAML file that defines what will be executed by GitHub Actions. If one of the steps in the workflow returns a non-zero exit code, then the workflow will fail, which results in a red ❌ in CI.
Our workflow is divided into two jobs:
- Build the firmware and upload build artifacts. This is executed on cloud servers, since building the firmware on a Raspberry Pi would take a prohibitively long time (adding precious minutes to CI time).
- Download firmware build, flash the device, and run
verify.py. This is executed on the self-hosted runner (my Raspberry Pi).
The workflow file is created in .github/workflows/test_esp32s3.yml. Here are the important parts of the file:
name: Test on Hardware

on:
  push:
    branches: [ main ]
  pull_request:

jobs:
  build_for_hw_test:
    runs-on: ubuntu-latest
    steps:
    ...
    - name: Build test project
      uses: espressif/esp-idf-ci-action@v1
      with:
        esp_idf_version: v4.4.1
        target: esp32s3
        path: 'examples/test'
    ...

  hw_flash_and_test:
    needs: build_for_hw_test
    runs-on: [self-hosted, has_esp32s3]
    ...
    - name: Flash and Verify Serial Output
      run: |
        cd examples/test
        python flash.py $CI_ESP32_PORT && python verify.py $CI_ESP32_PORT
The first job runs in a normal GitHub runner based on Ubuntu. For building the test firmware, Espressif provides a handy CI Action to do the heavy lifting.
The second job has a needs: build_for_hw_test requirement, meaning it must wait until the first job completes (i.e. firmware is built) before it can run.
The second job has two further requirements – it must run on self-hosted and there must be a label has_esp32s3. GitHub will dispatch the job to the first available self-hosted runner that meets the requirements.
If the workflow completes all jobs, and all steps return non-zero exit code, then everything has passed, and you get the green CI checkmark  .
.
Self-Hosted Runner Setup
With all of the major software pieces in place (FW test framework, Python runner script, and Actions workflow), the next step is to set up a machine as a self-hosted runner. Any machine capable of running one of the big 3 operating systems will do (Linux, Windows, MacOS).
It helps if the machine is always on and connected to the Internet, though that is not a requirement. GitHub will simply not dispatch jobs to any self-hosted runners that are not online.
Install System Dependencies
There are a few system dependencies that need to be installed first. On my Raspberry Pi, I had to install these:
sudo apt install \
    python3 python3-pip python3-dev python-dev \
    libffi-dev cmake direnv wget gcovr clang-format \
    libssl-dev git
pip3 install pyserial
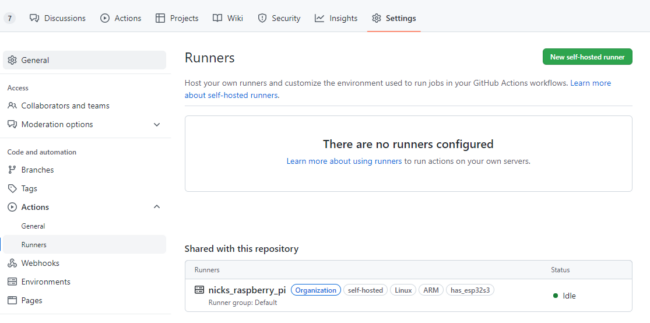
Next, log into GitHub and create a new self-hosted runner for your repo (Settings -> Actions -> Runners -> New self-hosted runner):
When you add a new self-hosted runner, GitHub will provide some very simple instructions to install the Actions service on your machine:
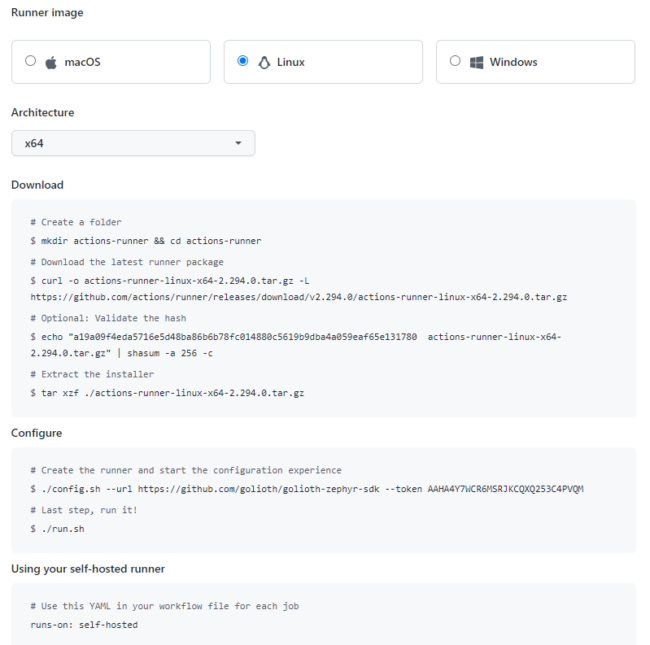
When I ran the config.sh line, I added --name and --unattended arguments:
./config.sh --url <https://github.com/golioth/golioth-firmware-sdk> --token XXXXXXXXXXXXXXXXXXXXXXXXXXXXX --name nicks-raspberry-pi --unattended
Next, install the service, which ensures GitHub can communicate with the self-hosted runner even if it reboots:
cd actions-runner
sudo ./svc.sh install
If there are any special environment variables needed when executing workflows, these can be added to runsvc.sh. For instance, I defined a variable for the serial port of the ESP32:
# insert anything to setup env when running as a service
export CI_ESP32_PORT=/dev/ttyUSB0
Finally, you can start the service:
sudo ./svc.sh start
And now you should see your self-hosted runner as “Idle” in GitHub Actions, meaning it is ready to accept jobs:
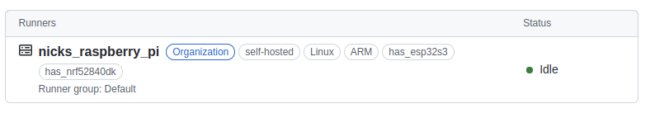
I added two custom labels to my runner: has_esp32s3 and has_nrf52840dk, to indicate that I have those two dev boards attached to my self-hosted runner. The workflow file uses these labels so that jobs get dispatched to self-hosted runners only if they have the required board.
And that’s it! With those steps, a basic HIL is up and running, integrated into CI, and covering a large amount of firmware code on real hardware.
Security
There’s an important note from GitHub regarding security of self-hosted runners:
Warning: We recommend that you only use self-hosted runners with private repositories. This is because forks of your repository can potentially run dangerous code on your self-hosted runner machine by creating a pull request that executes the code in a workflow.
I also stand by that recommendation. But it’s not always feasible if you’re maintaining an open-source project. Our SDKs are public, so this warning certainly applies to us.
If you’re not careful, you could give everyone on the Internet root access to your machine! It wouldn’t be very hard for someone to submit a pull request that modifies the workflow file to run whatever arbitrary Linux commands they want.
We mitigate most of the security risks with three actions.
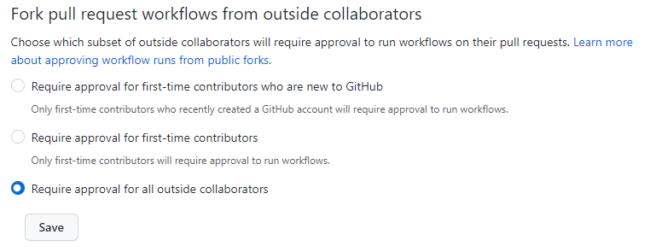
1. Require approval to run workflows for all outside contributors.
This means someone from the Golioth organization must click a button to run the workflow. This allows the repo maintainer time to review any workflow changes before allowing the workflow to run.
This option can be enabled in Settings -> Actions -> General:
Once enabled, pull requests will have a new “Approve and Run” button:
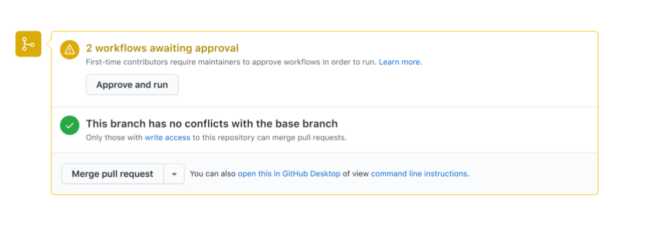
This is not ideal if you’re running a large open-source project with lots of outside contributors, but it is a reasonable compromise to make during early stages of a project.
2. Avoid logging sensitive information
The log output of any GitHub Actions runner is visible publicly. If there is any sensitive information printed out in the workflow steps or from the serial output of the device, then this information could easily fall into the wrong hands.
For our purposes, we disabled logging WiFi and Golioth credentials.
3. Utilize GitHub Actions Secrets
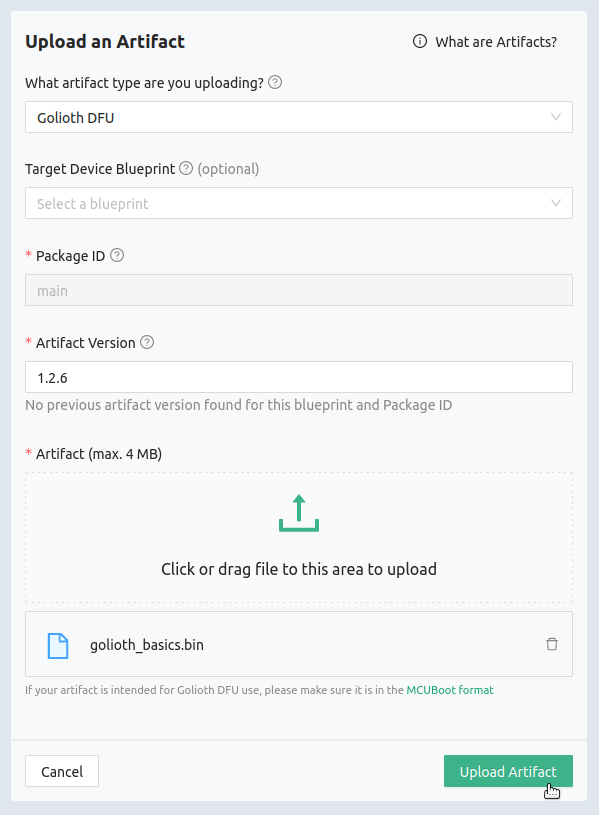
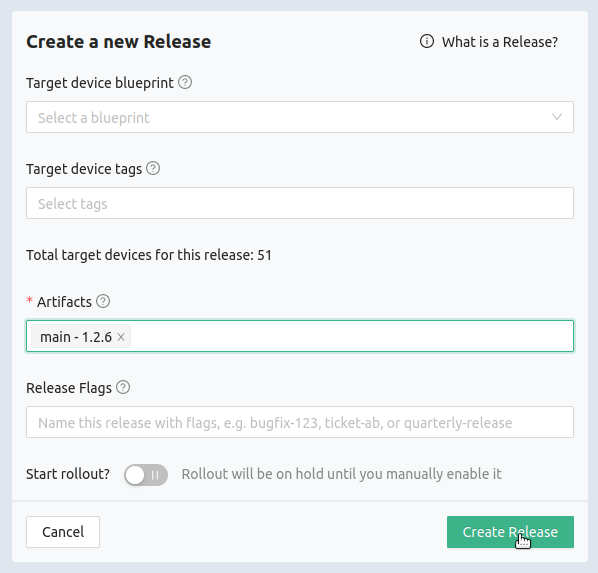
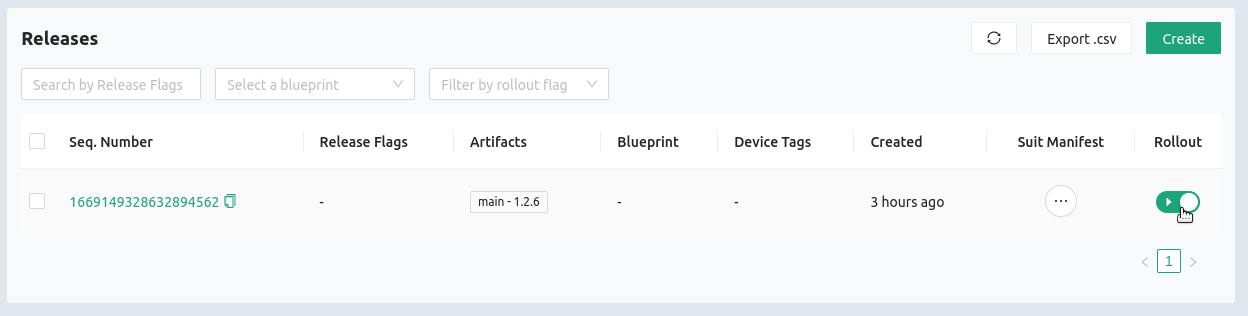
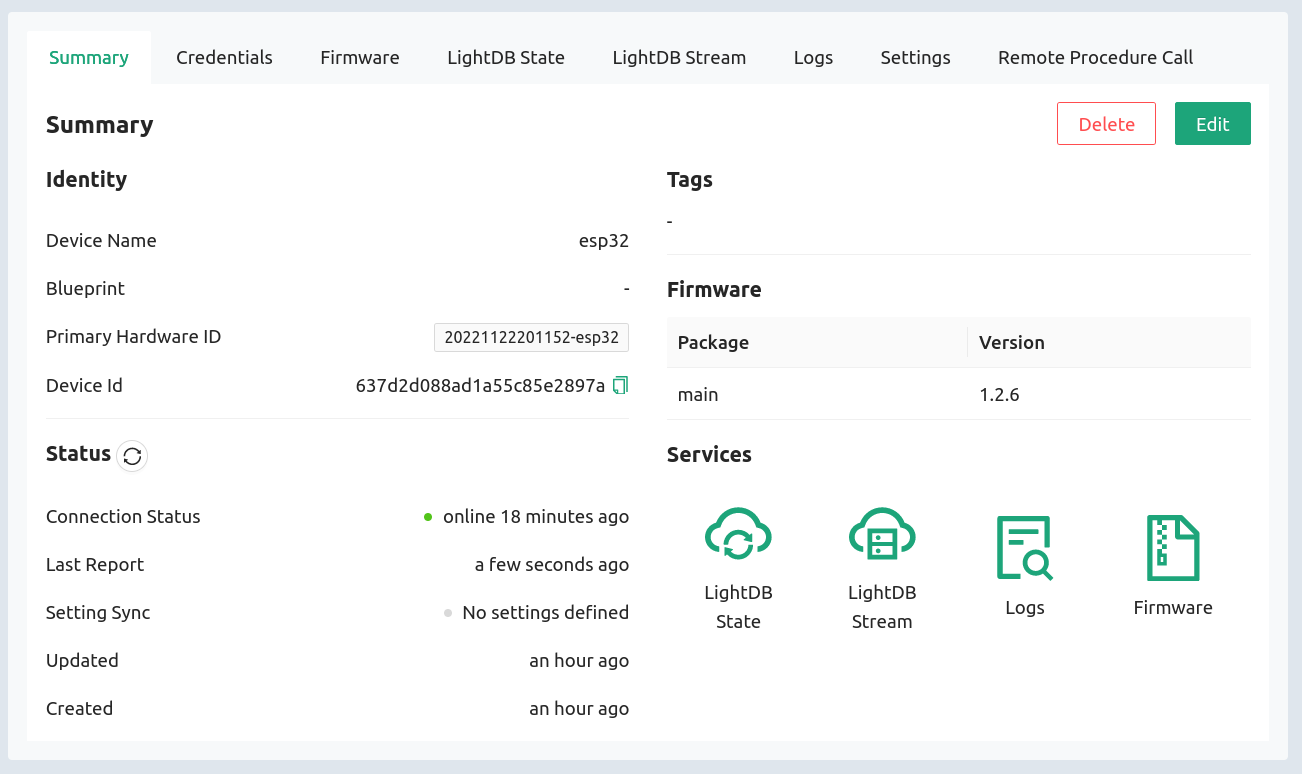
You can use GitHub Actions Secrets to store sensitive information that is required by the runner. In our repo, we define a secret named `GOLIOTH_API_KEY` that allows us access to the Golioth API, which is used to deploy OTA images of built firmware during the workflow run.
If you want to know more about self-hosted runner security, these resources were helpful to me:
Tips and Tricks
Here are a few extra ideas to utilize the full power of GitHub Actions Self-Hosted Runners (SHRs):
- Use the same self-hosted runner in multiple repos. You can define SHRs at the organization level and allow their use in more than one repo. We do this with our SHRs so they can be used to run tests in the Golioth Zephyr SDK repo and the Golioth ESP-IDF SDK repo.
- Use labels to control workflow dispatch. Custom labels can be applied to a runner to control when and how a workflow gets dispatched. As mentioned previously, we use these to enforce that the SHR has the dev board required by the test. We have a label for each dev board, and if the admin of the SHR machine has those dev boards attached via USB, then they’d add a label for each one. This means that machine will only receive workflows that are compatible with that machine. If a board is acting up or requires maintenance, the admin can simply disconnect the board and remove the label to prevent further workflows from executing.
- Distributed self-hosted runners to load balance and minimize CI bottlenecks. If there is only one self-hosted runner, it can become a bottleneck if there are lots of jobs to run. Also, if that runner loses Internet, then CI is blocked indefinitely. To balance the load and create more robust HIL infrastructure, it’s recommended to utilize multiple self-hosted runners. Convince your co-workers to take their unused Intel NUC off the shelf and follow the steps in the “Self-Hosted Runner Setup” section to add another runner to the pool. This allows for HIL tests to run in a distributed way, no matter where in the world you are.