Datacake makes beautiful dashboards for your IoT data. Golioth delivers the tools you need to manage your IoT hardware fleets. What if the two platforms worked well together? They do!
We’ve partnered with Datacake for an integration that easily connects your device data to create visually stunning presentations.
Demo
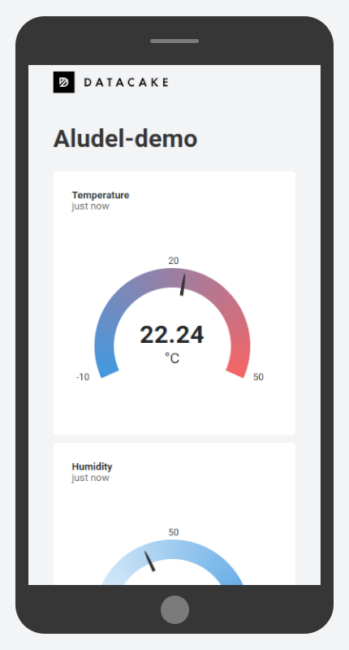 You’ll have no problem packing all kinds of display data into one computer screen with this setup. But one added bonus when working with Datacake is that you can generate publicly viewable links that include a dashboard optimized for mobile viewing. Think of sending your prospective customers a link to a sleek dashboard with live data from the proof-of-concept hardware you just bootstrapped.
Our demo today uses the temperature, humidity, and pressure data from a BME280 sensor, but the pattern is easily adapted to any visualization you need.
Setting up a Datacake Connection
Golioth and Datacake have integrations in place to communicate between the two platforms, so there are only a few steps to complete setup:
- Find your Golioth device ID
- Add a device on Datacake
- Use the Datacake endpoint to set up a Golioth output stream
- Select the specific data to visualize on your Datacake dashboard
For this demo, the weather-sensor sample code was used to stream temperature, humidity, and pressure. This will send real data from a BME280 sensor, or send simulated data if a sensor is not available.
Step 1: Golioth device ID
The prerequisite for this step is to have a device set up on Golioth to stream data. We have a free Dev Tier, so if you haven’t done so yet, register your account and set up a device.
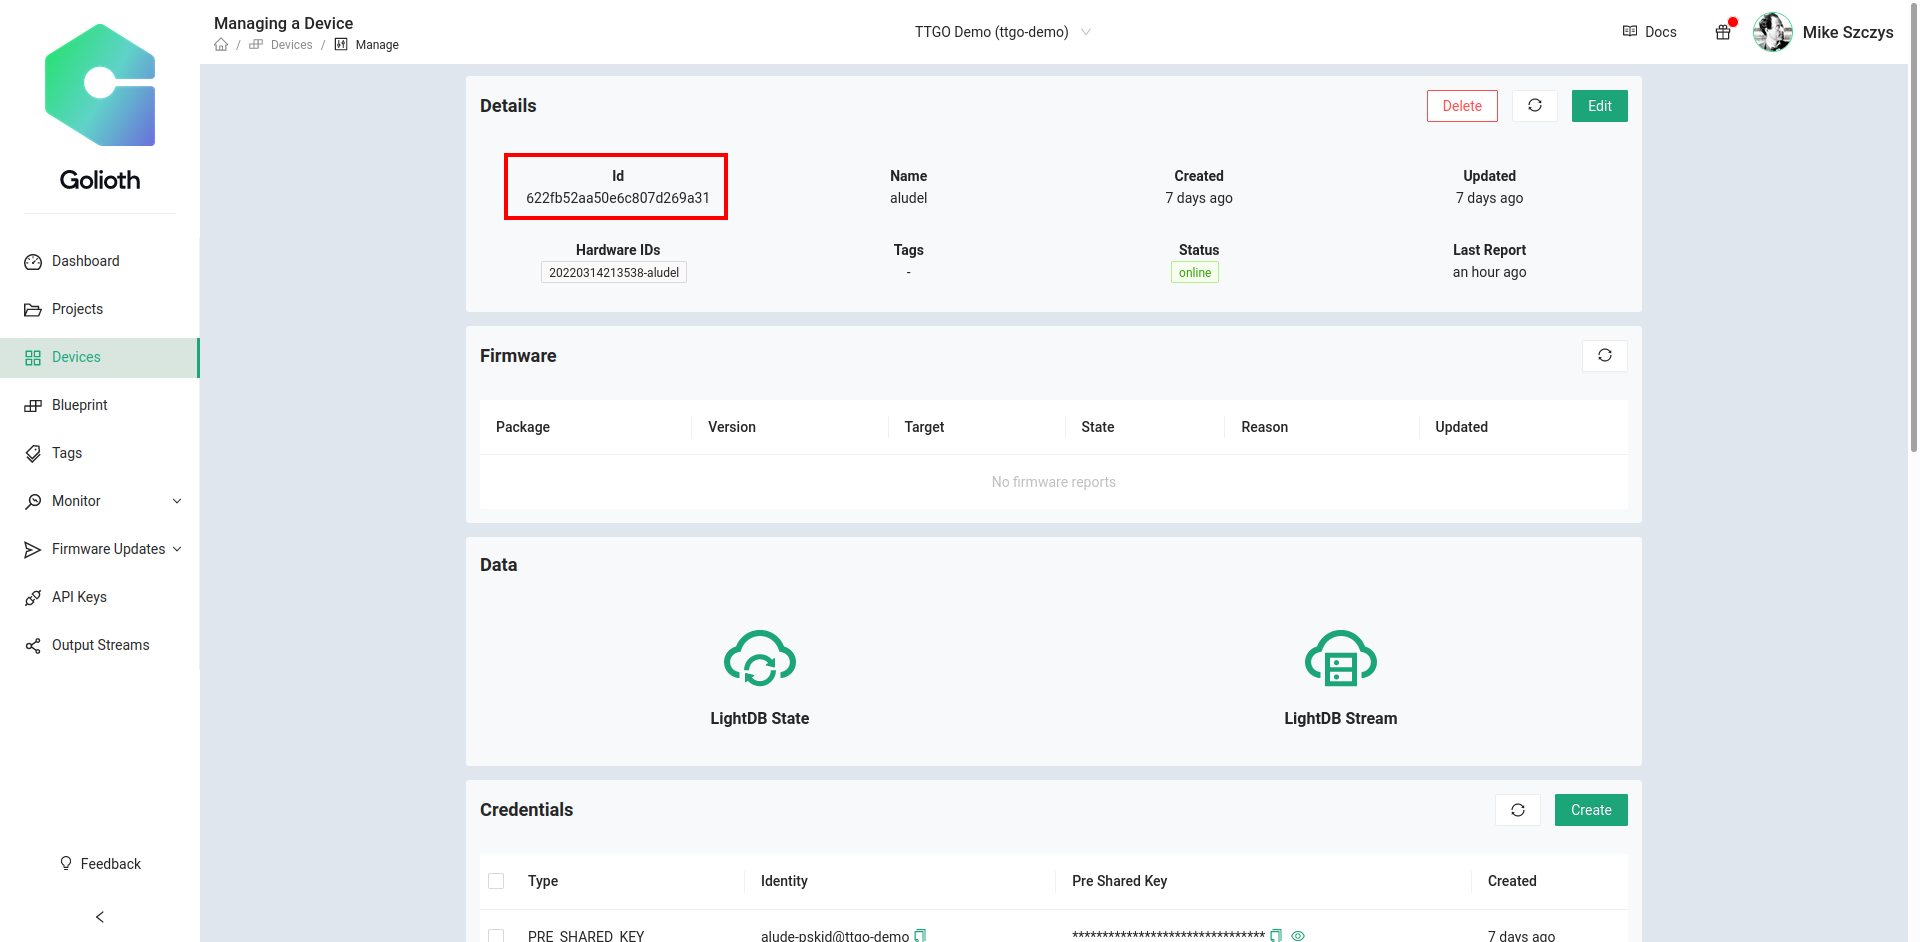
In the Golioth Console, select Devices from the left sidebar and click on your device in the resulting list. In the device view, as shown above, copy the Id, which we’ll need when adding a device in Datacake.
Step 2: Add a device in Datacake
The prerequisite for this step is to have a Datacake account. Your first two devices are free, so to give this guide a try, sign up for Datacake.
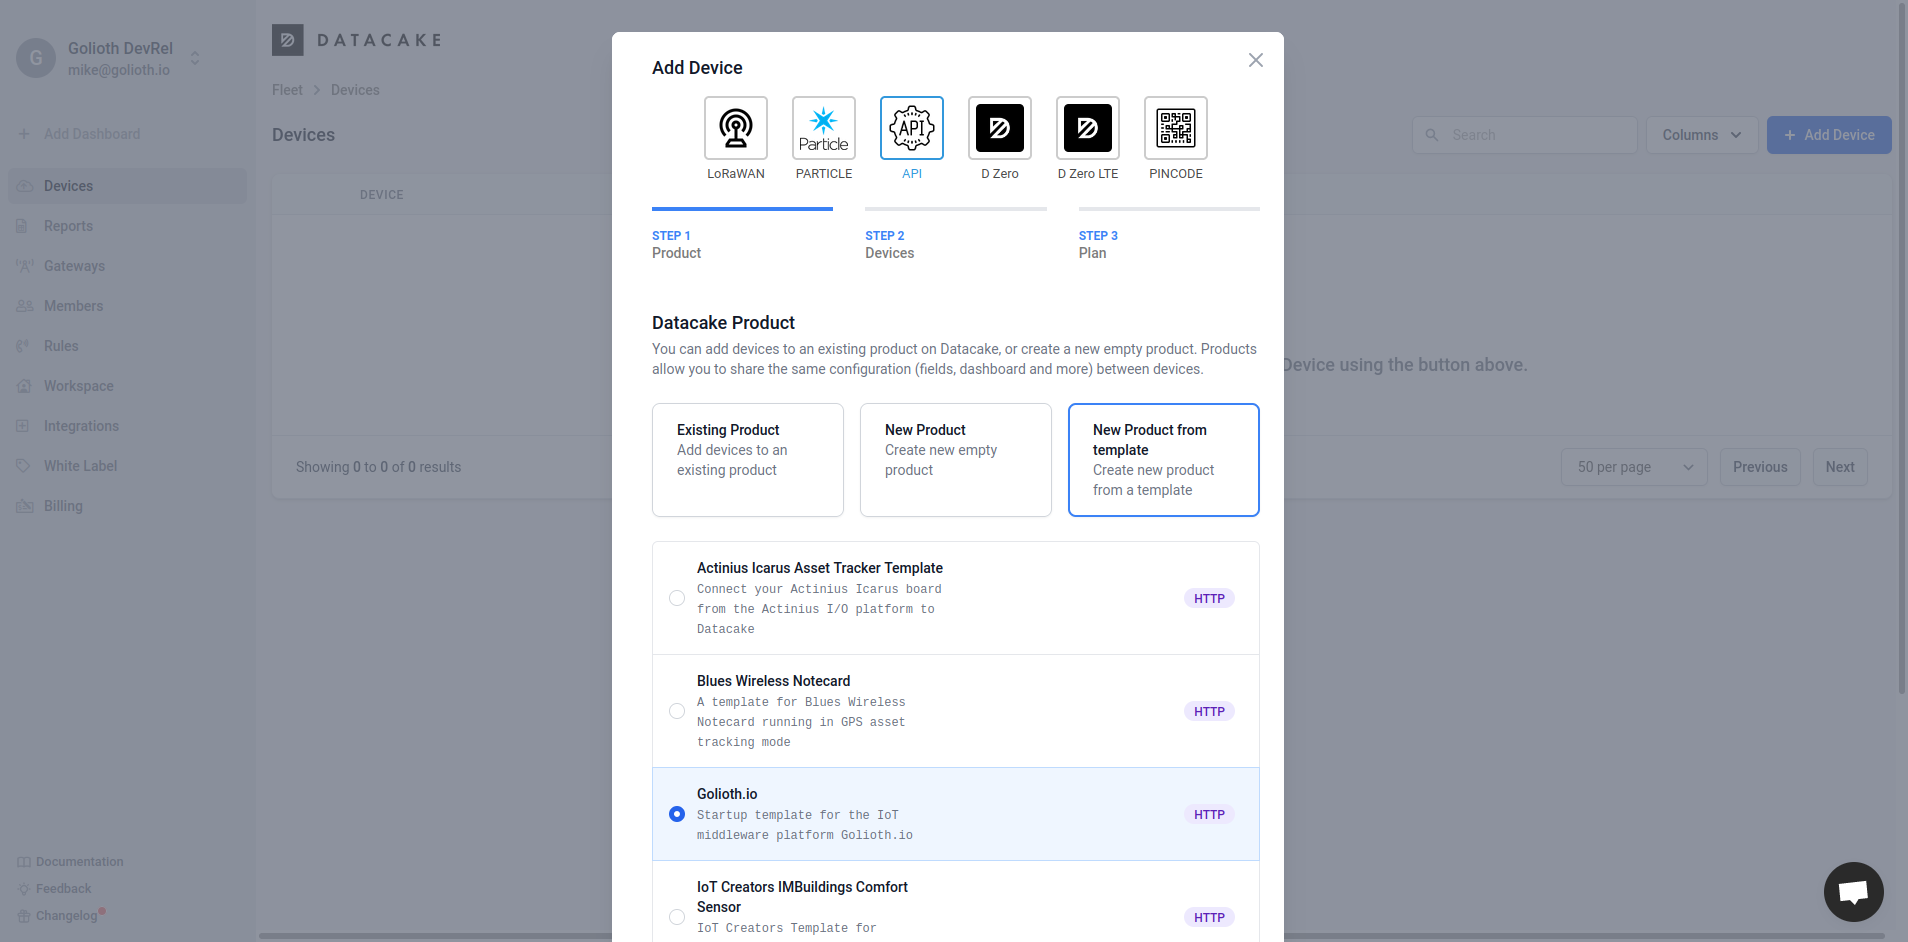
Once you have logged in, choose Devices from the left sidebar menu, then click the blue Add Device button in the upper right. As you can see above, you first click the API button at the top, select the New Product from template tile, and select Golioth.io from the list. Scroll down and click the blue Next button.
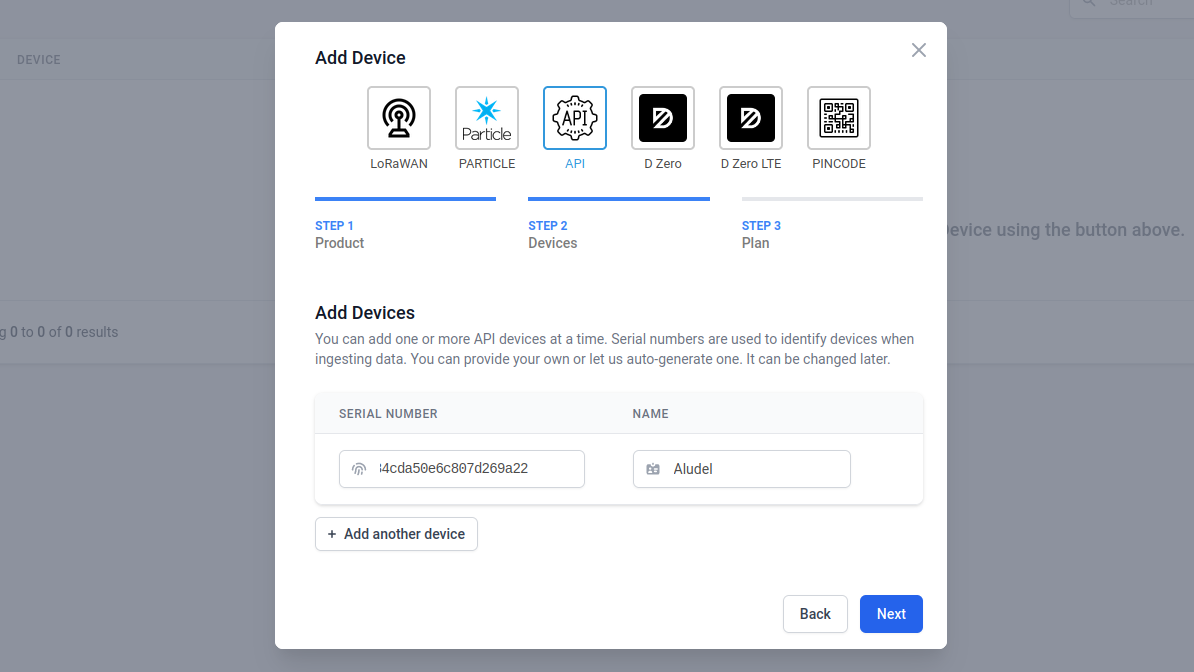
The resulting window asks us to enter a Serial Number, this the device ID we copied from the Golioth console in the previous step. (NOTE: double check that there are no spaces before or after your device ID.) Give this device a Name that makes sense to you. After clicking the Next button you will be asked to choose a plan for this device. There is a free plan option.
You will be returned to the Device page. Click on the name of your newly created device and choose the Configuration tab. Scroll about half way down the page until you see the HTTP Endpoint URL. We need to give this to Golioth to authorize the output stream.
Step 3: Configure the Golioth Output Stream for Datacake
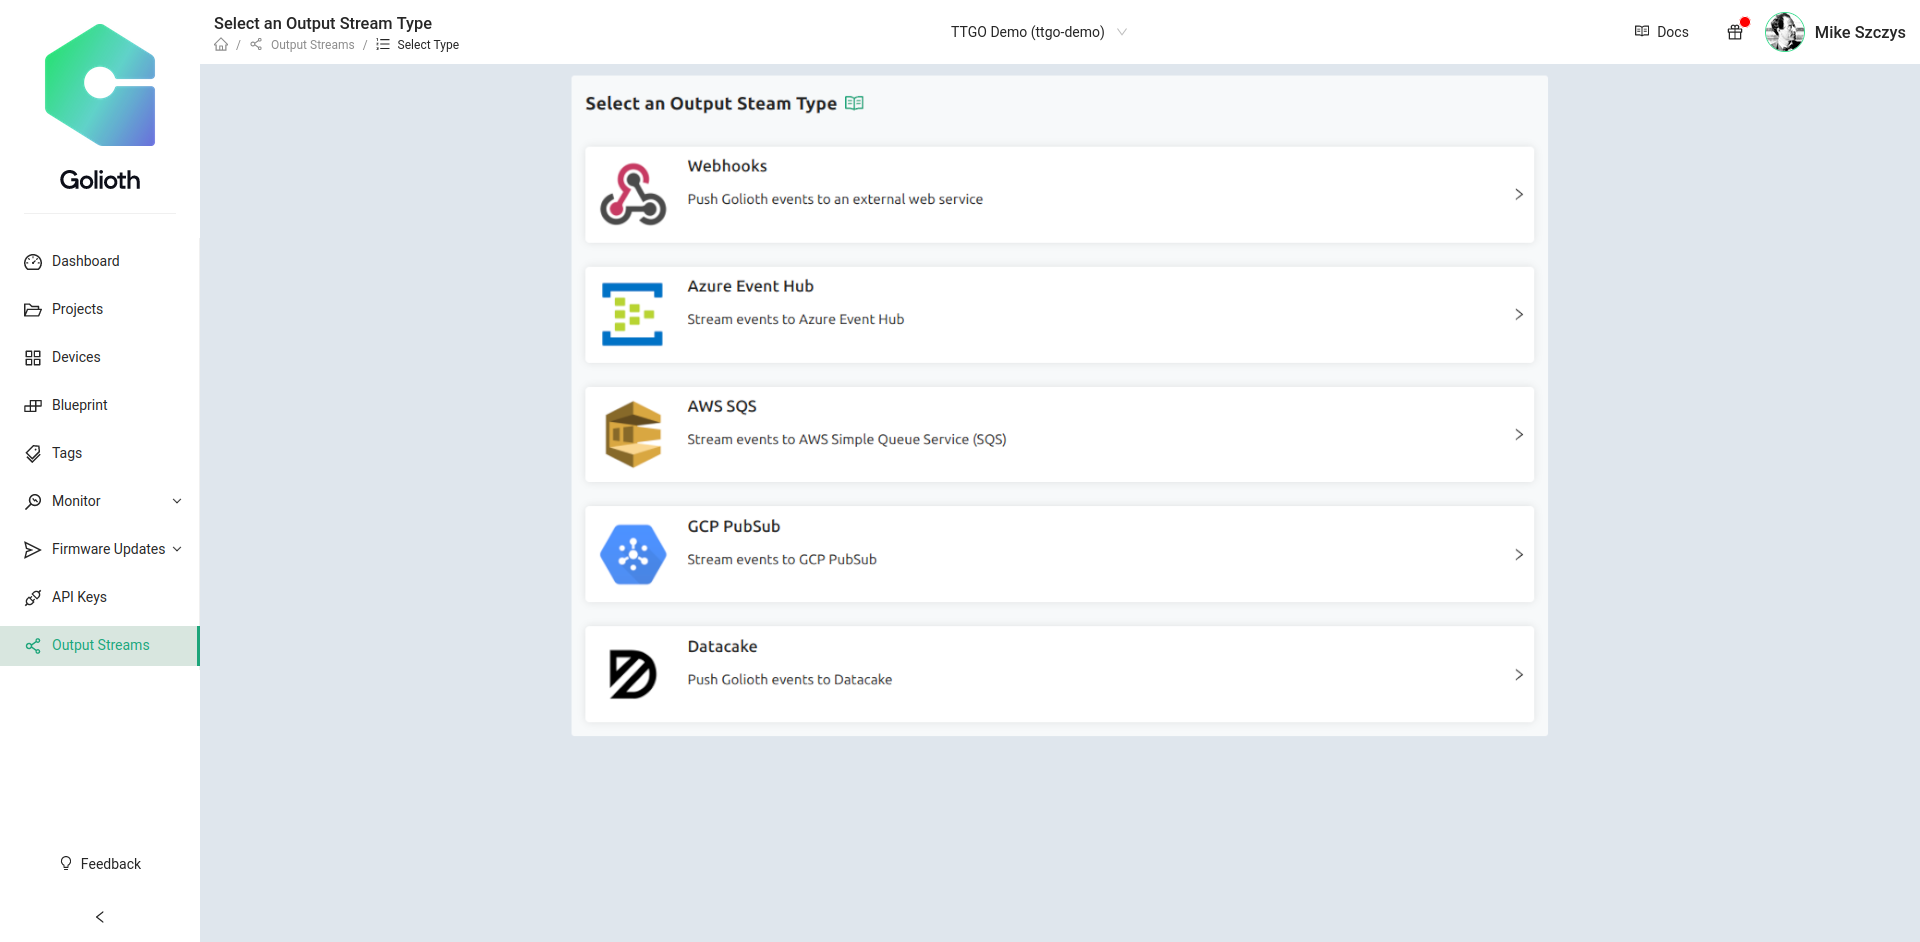
Back in the Golioth Console, select Output Streams from left sidebar menu, then select Datacake from the resulting list.
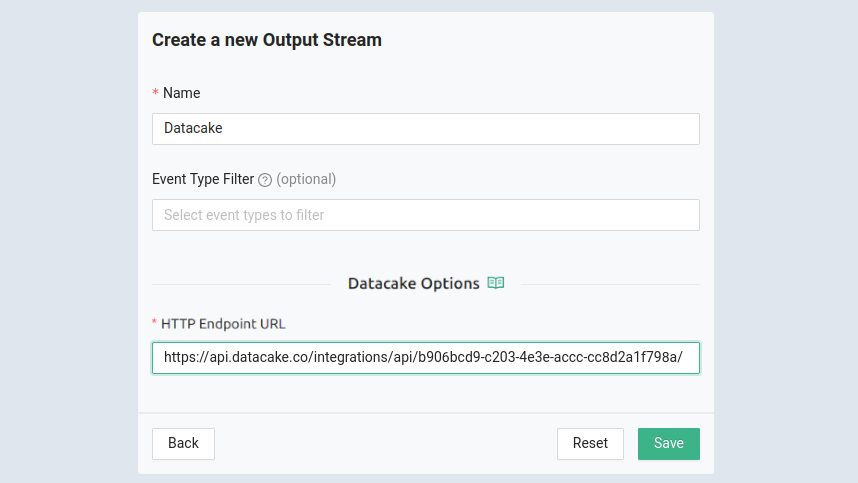
The Name field can be anything of your choosing. Paste the endpoint URL from Datacake into the HTTP Endpoint URL box as shown above, and click save.
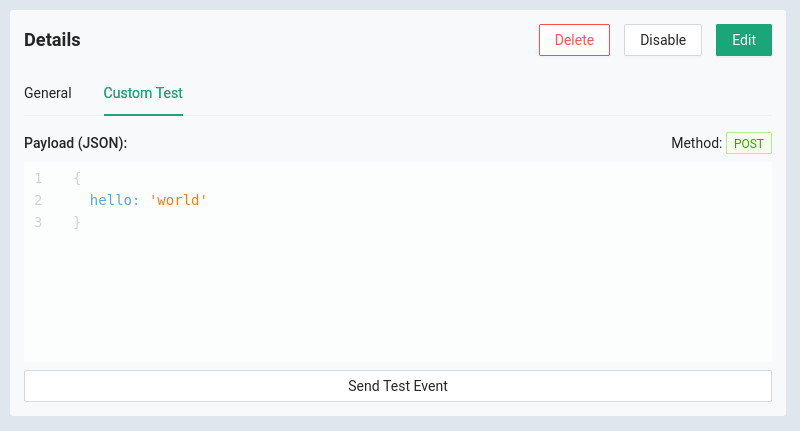
It’s a good idea to test the Webhook connection to Datacake that we just created to make sure it is working. After clicking save on the Webhook, choose the Custom Test tab in the window that appeared, and click Send Test Event.
Back in the configuration page of your Datacake device you will see a Show logs button in the right side of the HTTP Payload Decoder section. When you click it, a dialog opens. Wait a few seconds and you will see our {"data":{"hello":"world"},… test message appear. Success!
Step 4: Choose the data to show on your dashboard
Datacake sets up a default dashboard for Golioth data to display temperature, humidity, and pressure data. It expects data packets to stream in that look like the code below.
{
  "data": {
    "environment": {
      "humidity": 37.325195,
      "press": 98.508472,
      "temp": 23.46
    }
  },
  "device_id": "622fb52aa50e6c807d269a31",
  "project_id": "datacake-demo",
  "timestamp": {
    "nanos": 206247513,
    "seconds": 1647879865
  }
}
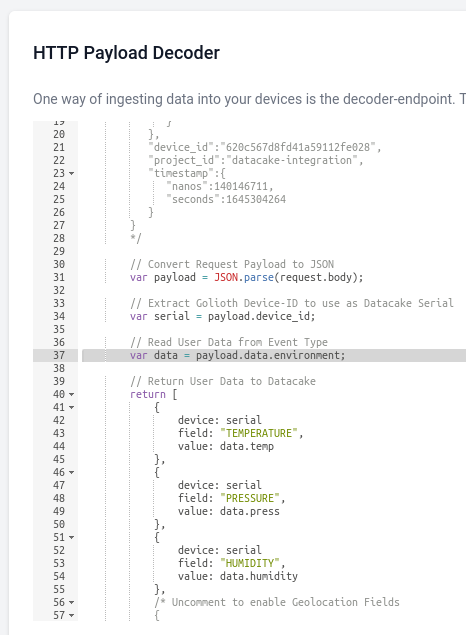 You can customize the Datacake interface to use the data of your choosing. In your device’s configuration tab, scroll down to the HTTP Payload Decoder section.
Important here is the var data assignment that you see highlighted in the screenshot. This should map to the object in your JSON data that holds the key/value pairs you wish to access. Look a few lines lower (44, 49, and 54 in the Datacake example) and you will see the values being mapped to field names for graphing on Datacake.
There is a Golioth specific guide in the Datacake documentation that goes into detail about these field values, and how to further test the decoder set up.
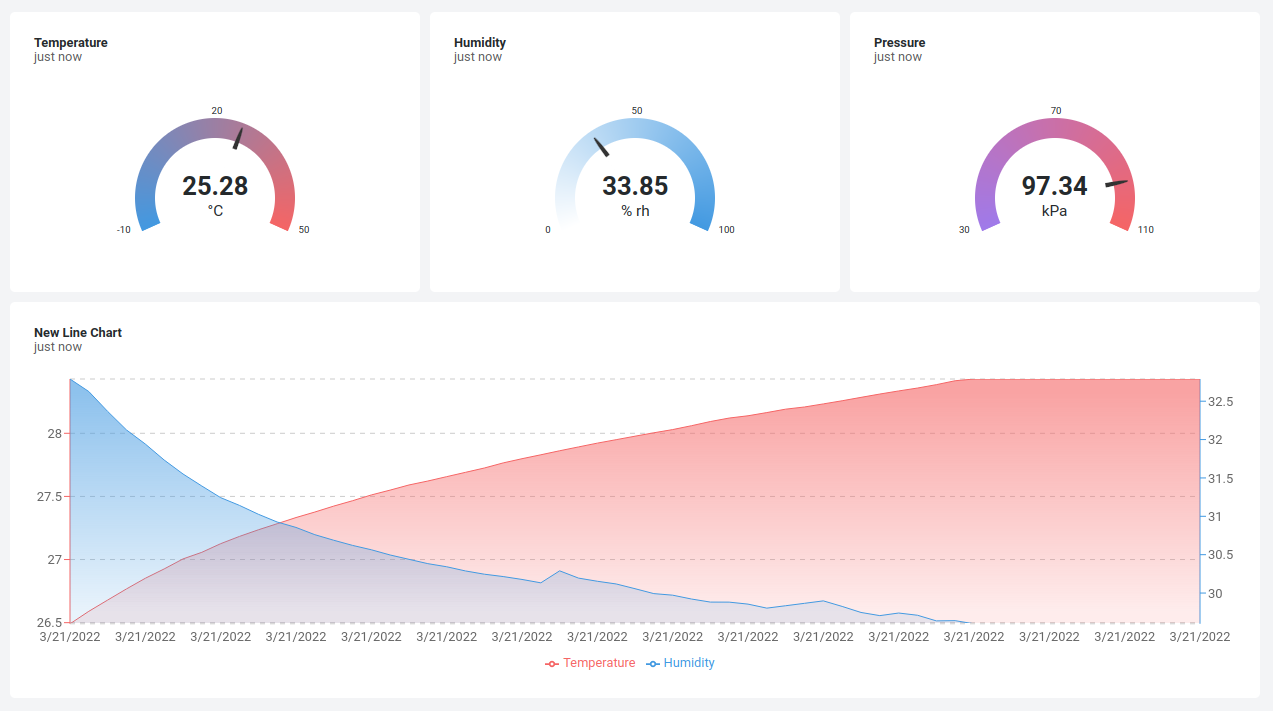
If you have been following along so far, and have a device actively sending data, then all you need to do is to click the Save button for the decoder settings to take effect and the the graphs will begin displaying live data. Click the Dashboard tab at the top of your device page and the Temperature, Humidity, and Pressure gauges will appear. In this view it’s easy to add more widgets and play around with how the data is presented. This is also where you can generate a public link to your dashboard.
Better visuals in less time
Your customers want to know what’s going on with their IoT fleets. Being able to build out professional quality visualizations quickly is both impressive, and a way to free yourself up to work on other rollout issues. That’s why we continue to add to the Output Stream options here on Golioth and we’re particularly excited about this partnership with Datacake. You should give it a try!

