Today we are launching a new feature in the Golioth console: usage visualization. All Golioth users can now access real-time usage data, broken down by project and service, on the settings page for organizations in which they are an admin.
This feature follows a series of console updates, including the launch of the Golioth Simulator, and a restructuring of project and organization navigation. With each new release, Golioth is becoming more conducive to managing large fleets with greater visibility, while also enabling more seamless collaboration between users in an organization.
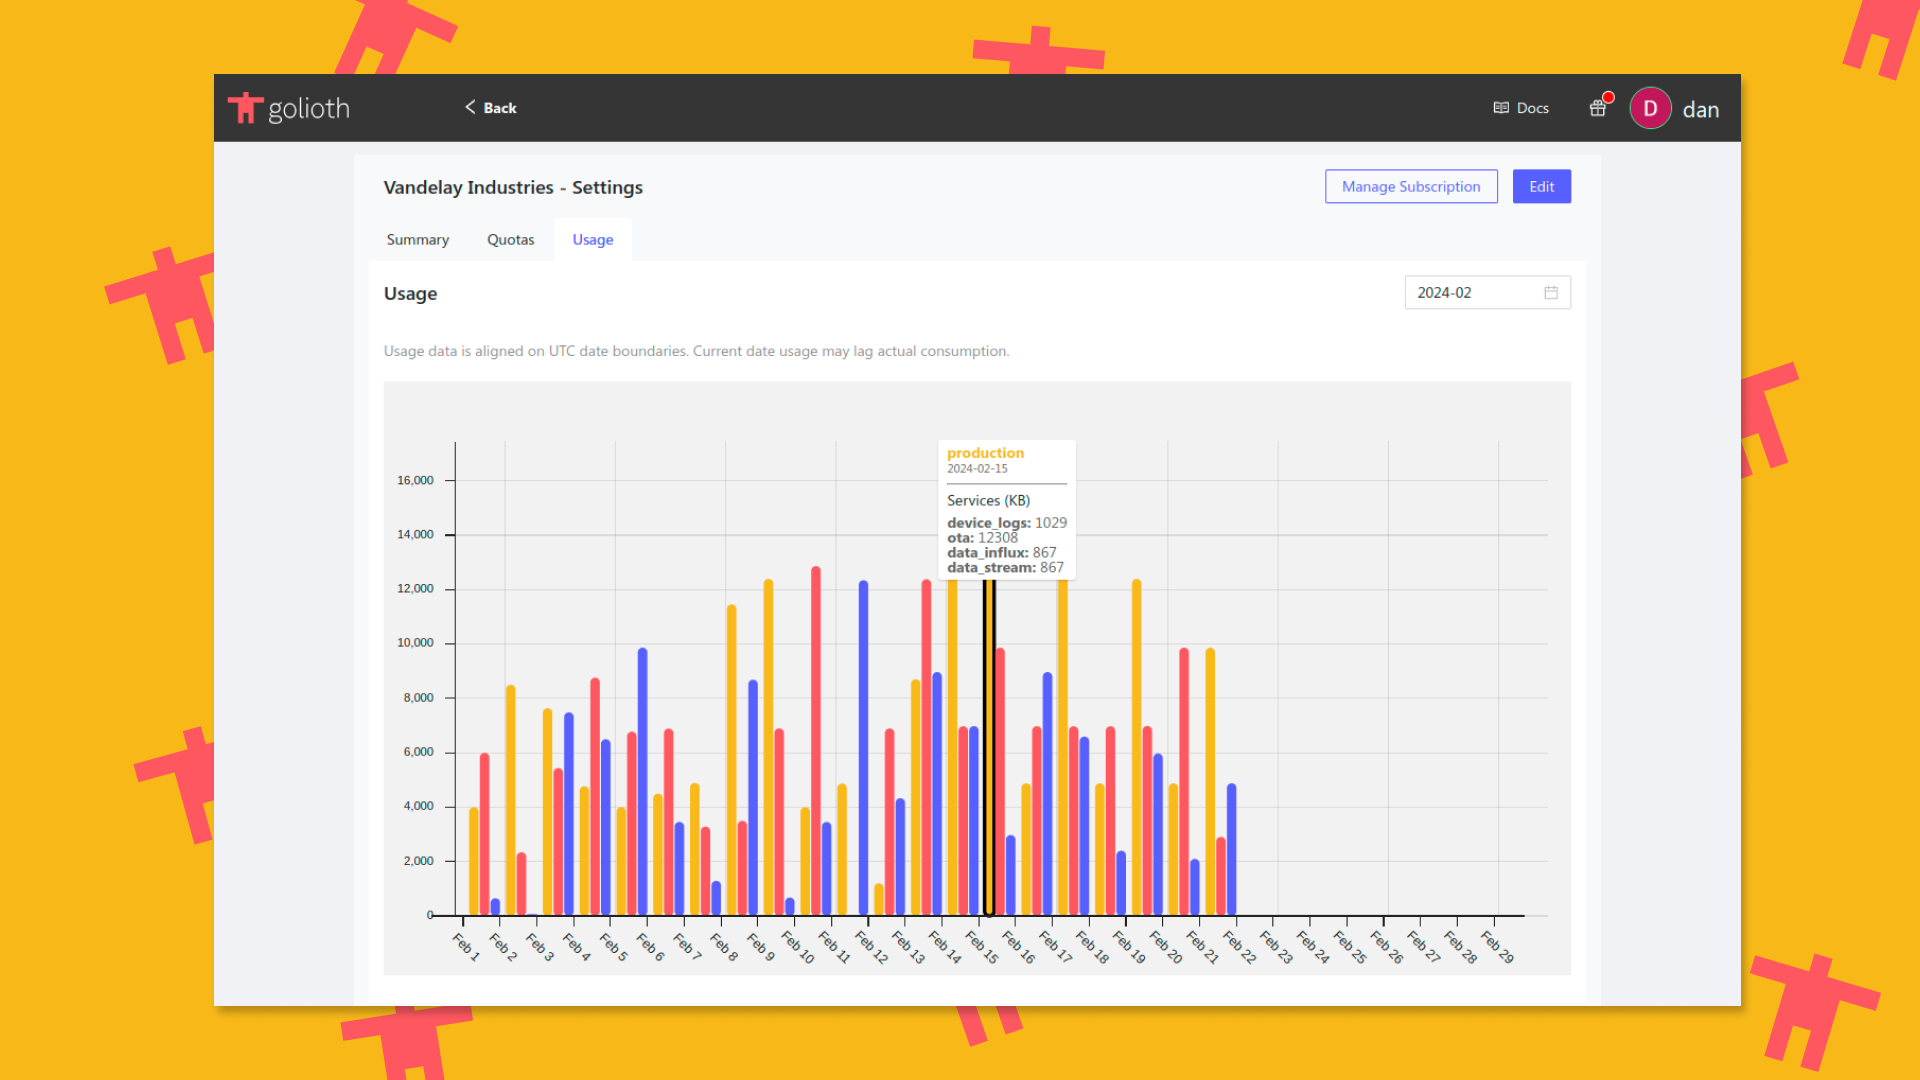
Usage data is currently displayed for the following services:
By default, the current month’s usage is displayed, but the selector in the top right can be used to change the range. Additional usage metrics, as well as more advanced filtering and visualization functionality will be introduced over the next few weeks.
Sign in to the Golioth console to view your usage data, and reach out on the forum with any feature requests or feedback!

No comments yet! Start the discussion at forum.golioth.io