IoT devices are usually battery-operated and, more often than not, need to run on a single battery charge for multiple years. Before we know it, MCU power consumption becomes a huge deal when developing a product. Measuring power consumption of an MCU can be challenging since it does not depend on just one thing. It depends on multiple factors like clock frequency, what is connected to the outputs, which peripherals are enabled, and also the different MCU-specific power modes in use.
With known average current consumption and battery voltage, we can easily calculate the lifetime of a battery charge. Notice the word average; we are interested in the average current consumption over some fixed time period. To maximize battery life, developers must minimize power consumption over the life of the product.
For this blog post, we are going to measure current consumption with the Power Profiler Kit II. We’ll utilize a well-known friend as the target, the nRF9160 DK.
Device Operating Modes
Most battery-powered devices spend much of their time asleep, waking up to perform their functions, and then going back to sleep. For these applications, battery life depends, at least, on three major aspects of the microcontroller:
- Run/Active mode: device is using the most power (fetching sensor data, communication with the Cloud, running algorithms, etc.)
- Standby/Idle mode: the “do-nothing” state (an idle thread, sleeping in a while loop, etc.)
- Sleep Mode: deepest internal power saving mode the system can enter (System OFF mode in the case of nRF9160 DK)
The “do-nothing” state of the microcontroller often has many different forms.
Start-up time, that being how long it takes the microcontroller to go from the do-nothing state to running the application state and the application runtime. The current consumption also varies depending on the operating temperature and schedule of the tasks.
Let’s consider an example where a device needs to measure an ambient temperature from a BME280 sensor, send the reading over cellular to the cloud, and wait for a fixed time period. This is the gist of what we do with our Cold Chain Asset Tracker. Since ambient temperature is not changing rapidly, we can safely say that the fixed time period (task schedule), can be 5 minutes and that starting the measurement and sending data to the cloud takes 5 seconds. This means the duration of the Idle mode is 60 times more than the Active state (application duty cycle).
Current, Power and Energy Consumption
It is common for developers to start their processor power analysis by considering active processing power. Though it may seem counterintuitive, the power the microcontroller consumes when not operating is often more important than active processing power. Referring back to the remote sensing application, the system typically wakes up from standby mode once every 5 minutes, so it remains in standby mode more than 98% of the time.
Power is defined as:
P = I • V [W]
where I is the current drawn from the battery, and V is the battery voltage.
Energy is defined as:
Energy = I • V • Time = P • Time [Wh]
So energy is nothing more than Power used over a period of time. This can be expressed as [V • Ah], where, Ah is the charge stored in the battery (check the back of your power bank 🙂 ).
Lithium Ion Batteries are usually 3.7 V, with different charge stored in the battery (ranging from 100 mAh to 10 Ah or more).
Let’s consider an example. A battery has a rating of 2 Ah at 1.5V (typical AA/AAA battery); the energy stored in the battery is:
E = 2 • 1.5 = 3 [Wh]
If we connect a 1 Ω resistor to the battery (neglecting the internal battery resistance), and use Ohm’s law, it will draw 1.5 A of current. That’s a load of 2.25 W, meaning we’ll run out of battery charge after 1.3 hours.
Now that we know our device has to take advantage of its low-power mode and other techniques to lower power consumption, how do we measure the current consumption? That’s where the Power Profiles Kit 2 from Nordic comes in.
Power Profiler Kit II
The Power Profiler Kit II (PPK2) is a standalone unit, which can measure and optionally supply currents all the way from sub-μA and as high as 1 A on all Nordic DKs, in addition to external hardware. The PPK2 is powered via a standard 5 V USB cable, which can supply up to 500 mA of current. In order to supply up to 1 A of current, two USB cables are required.
An ampere meter-only mode, as well as a source mode (shown as AMP and source measure unit (SMU) respectively on the PCB) are supported. For the ampere meter mode, an external power supply must source VCC levels between 0.8 and 5 V to the device under test (DUT).
For the source mode, the PPK2 supplies VCC levels between 0.8 and 5 V and the on-board regulator supplies up to 1 A of current to external applications. It is possible to measure low sleep currents, higher active currents, as well as short current peaks on all Nordic DKs, in addition to external hardware.
Connecting the PPK2 to the nRF9160 DK is straightforward and explained on Nordic’s website.
Power Consumption of Golioth’s hello example
For the first example, we are going to measure the current consumption of Golioth’s hello sample without modifications and use the PPK2 in ampere meter mode.
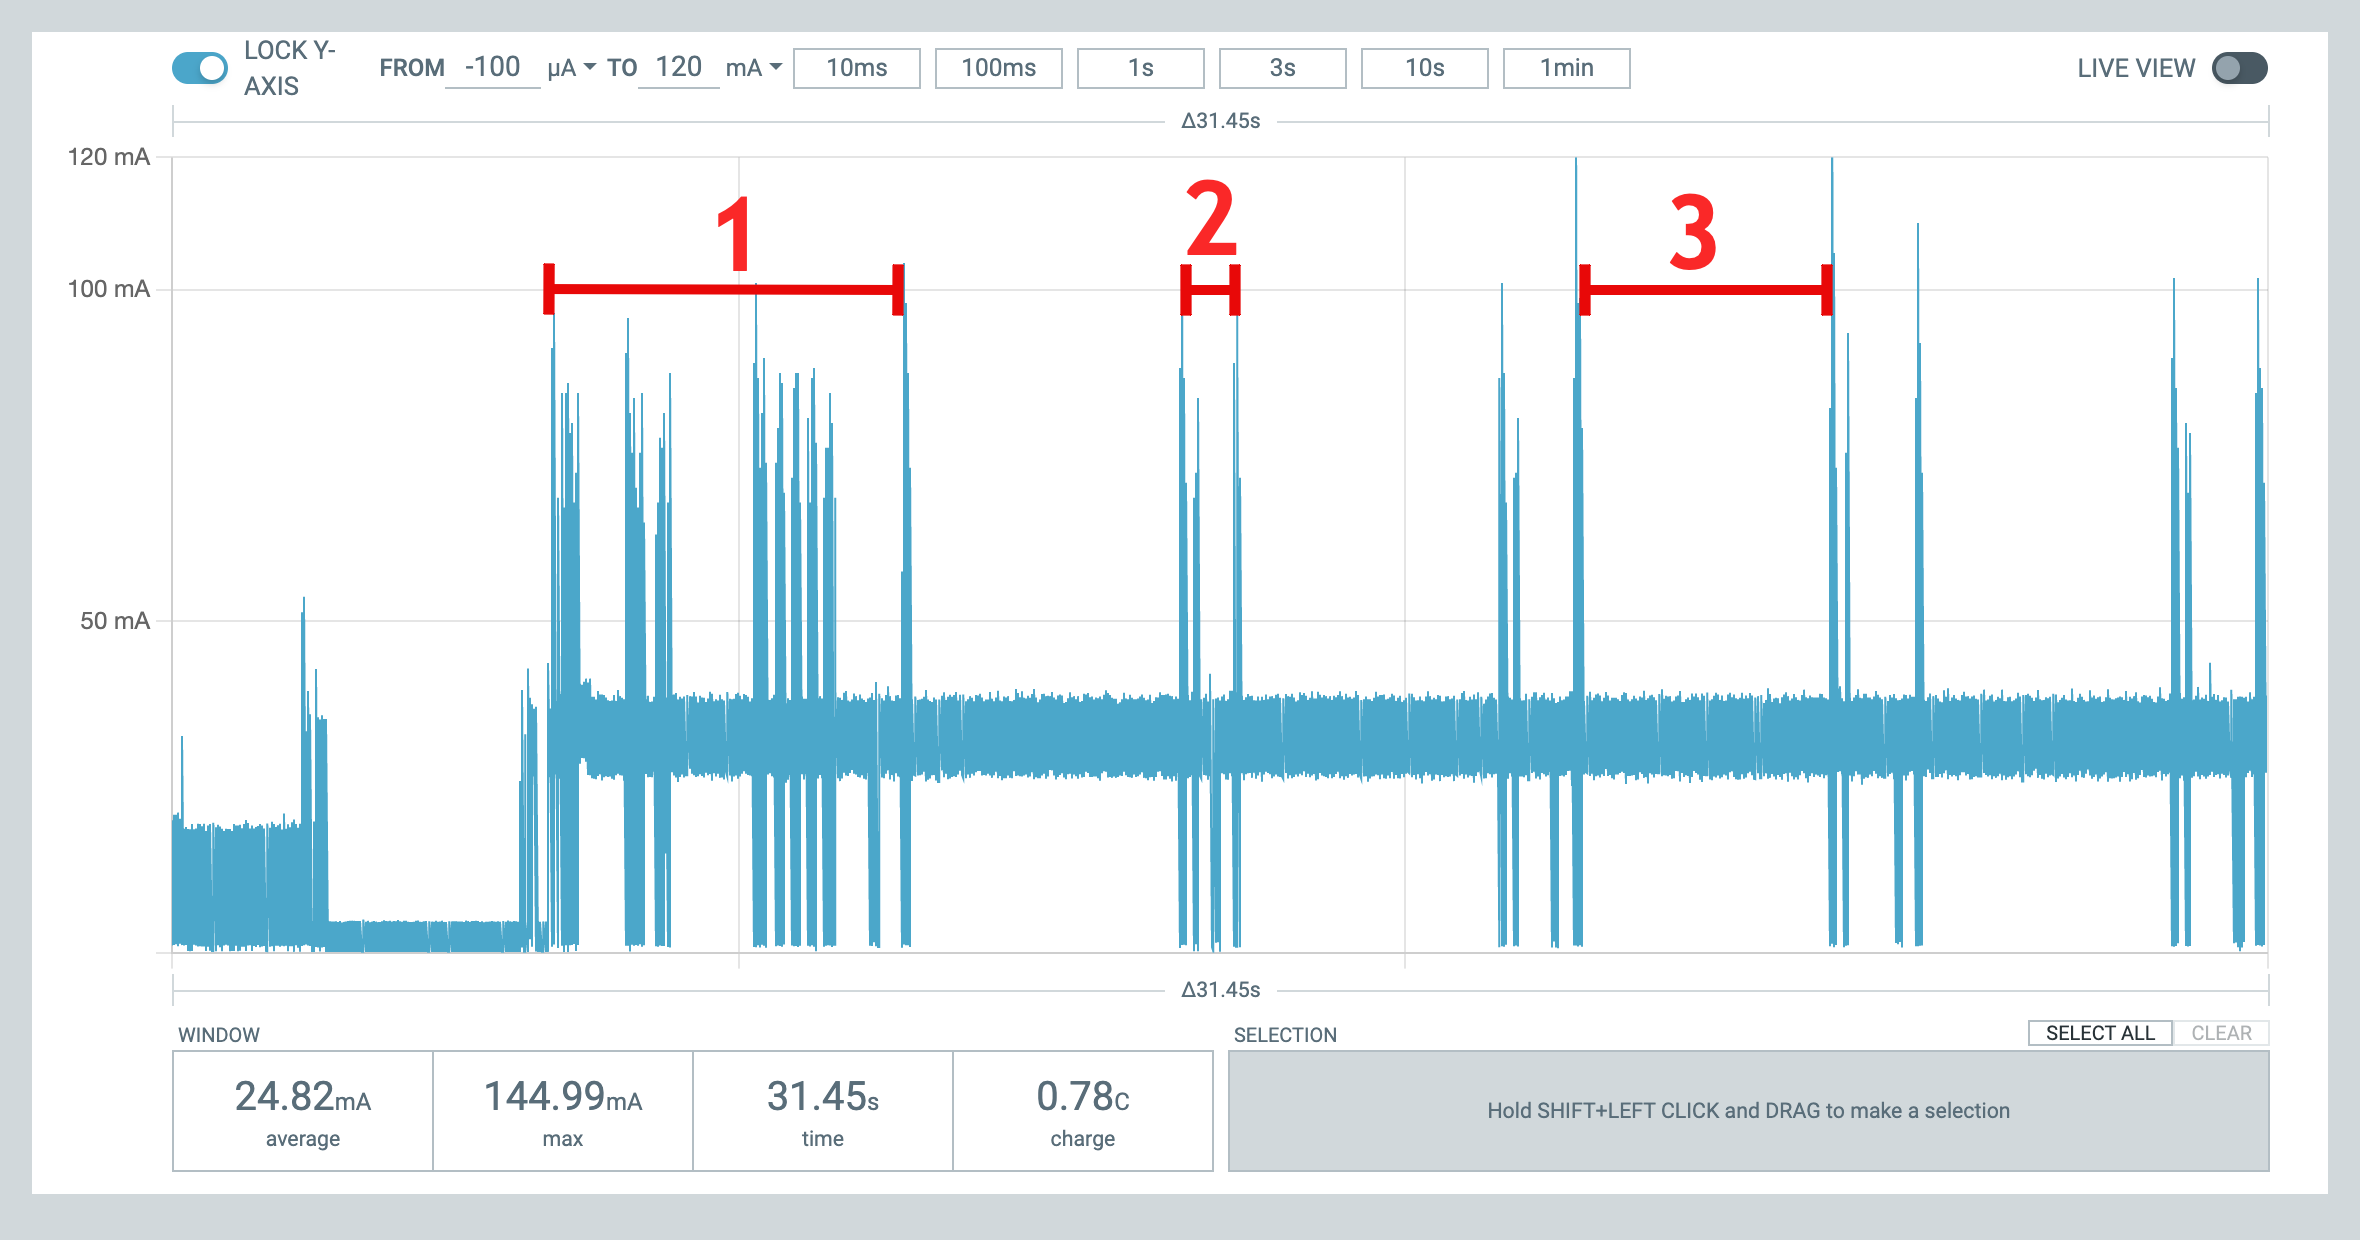
We focus on three areas:
- Device connects to the cellular tower, Golioth Cloud, and sends a
hellomessage - Device sends a
hellomessage to Golioth Cloud - Device is in an Idle mode
From the image, the most power-intensive is the first area, where the nRF9160 DK is connecting to the cellular tower, then to Golioth Cloud, and finally, it sends a hello message. Once connected to Golioth, the device is provisioned and does not need to go through the process again (unless the IP address of the device changes or it’s using Connection ID). That’s the reason the power consumption in the second area is lower compared to the first area. Current spikes of ~100 mA come from the modem using its RF circuitry to transmit and receive data from the cellular tower. The third area is when the application is in Idle mode (there is a k_sleep call in the while loop in the sample), and the modem is not in use, with a sustained current consumption of ~35 mA.
For the second example, the hello sample is a bit altered; after five hello messages are sent with a five second delay between them, the Golioth system client is stopped, and lte_lc_offline API call is made, which sets the device to flight mode, disabling both transmit and receive RF circuits and deactivating LTE and GNSS services.
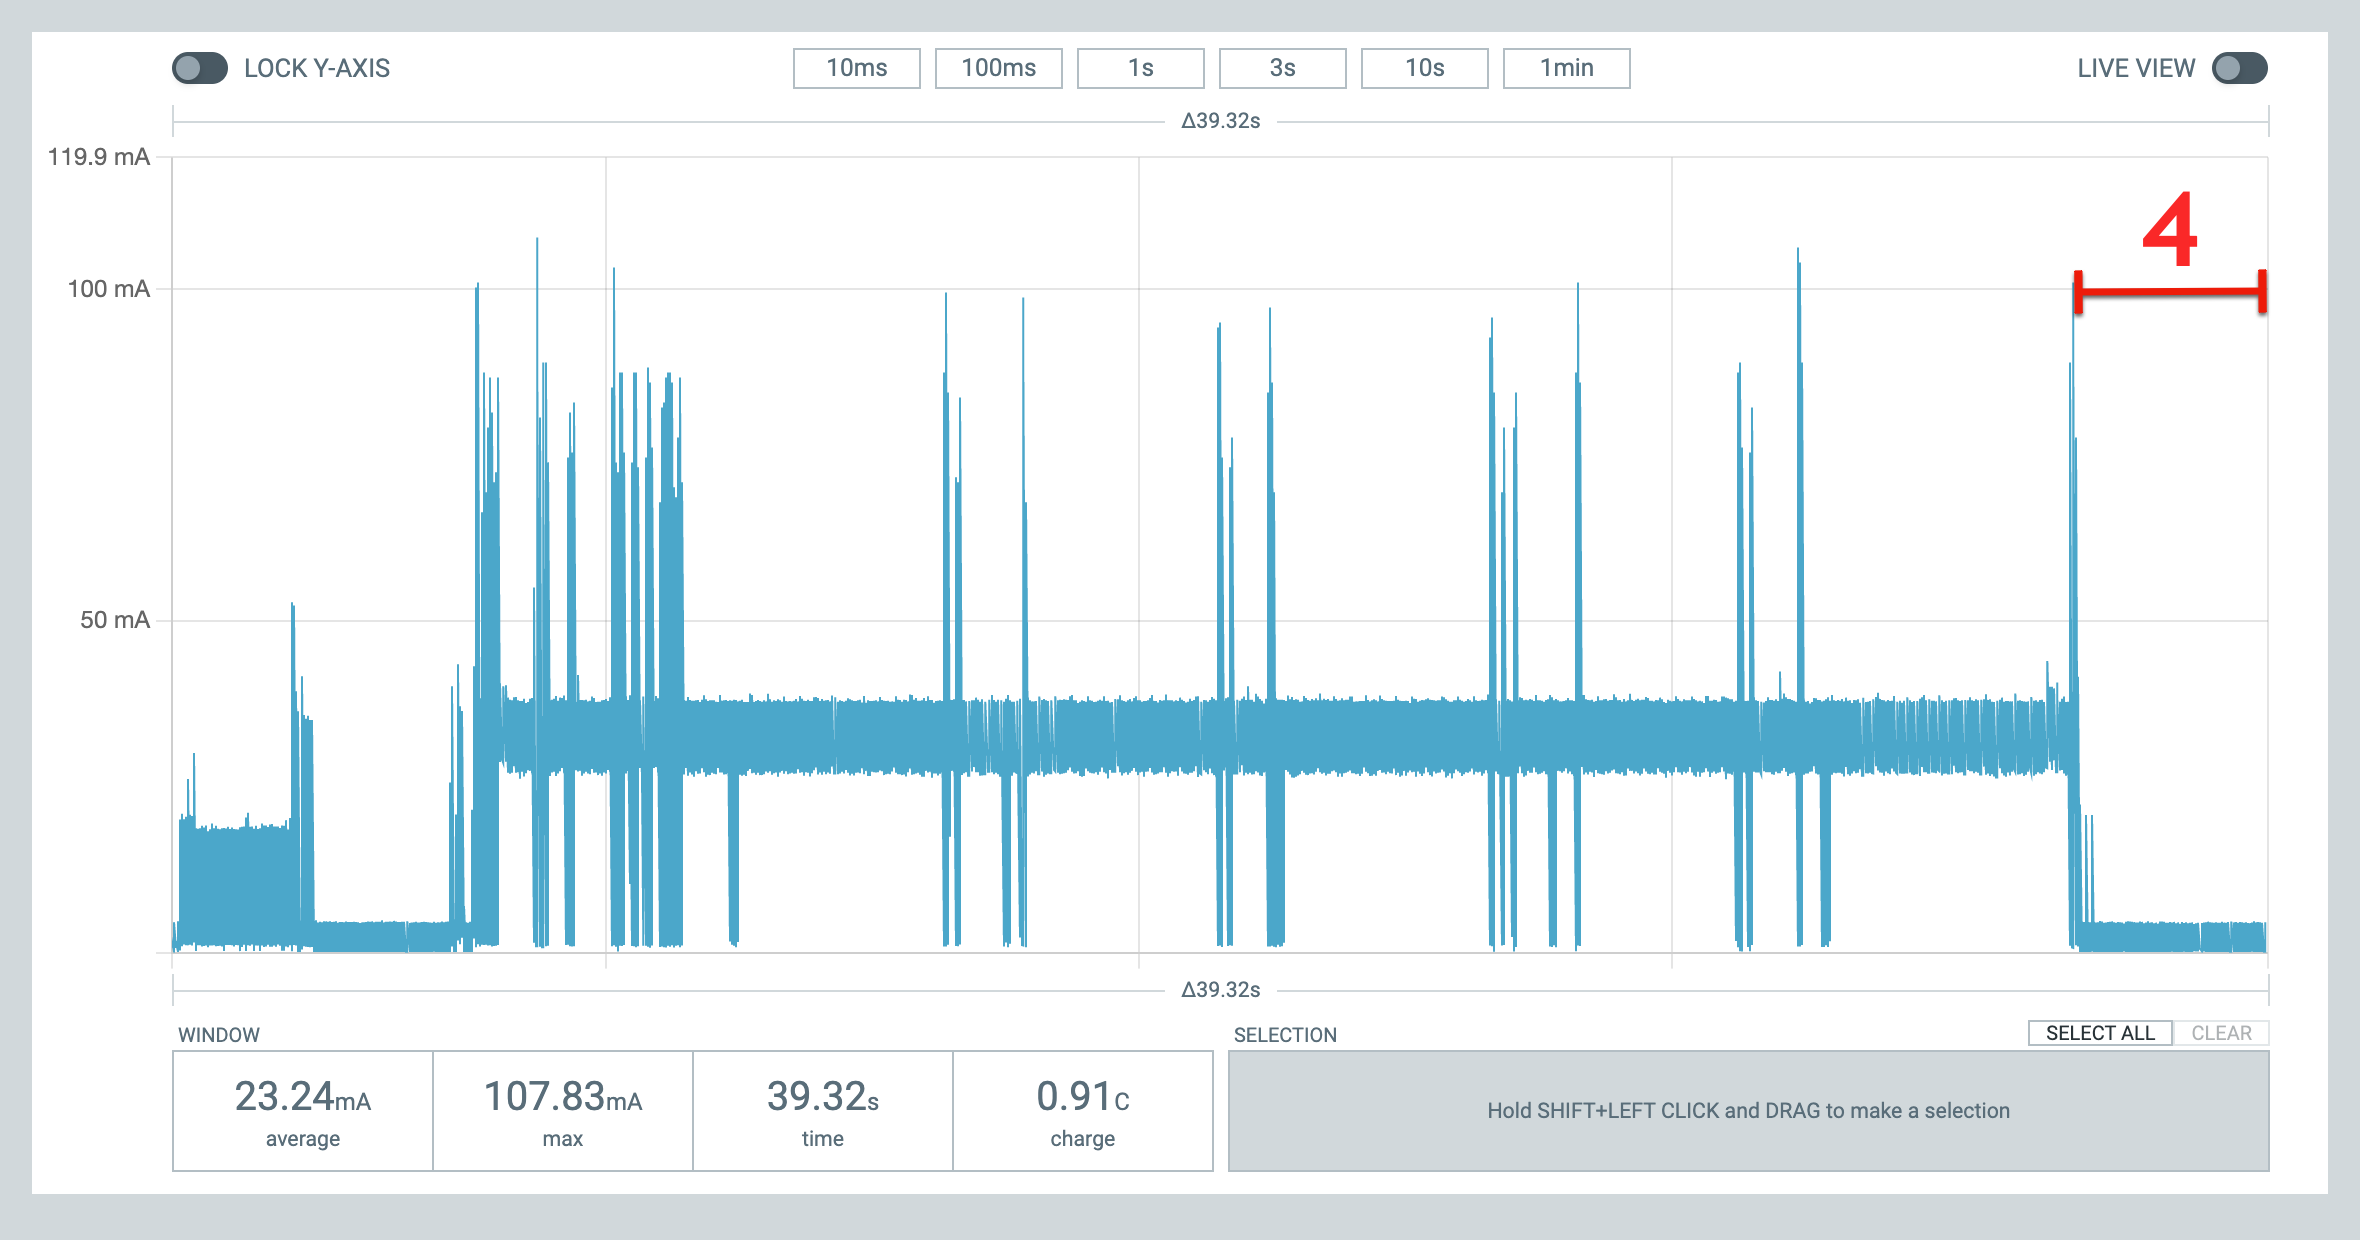
There are still current spikes when the modem is in use, but the current drawn in Idle mode (marked with 4) is 10 times smaller (~4 mA), which will prolong the battery life substantially.
Please note: the 4 mA number above had no optimizations in place and do not represent the low current capabilities of the nRF9160. We will be doing a followup article where we showcase just how low things can go!
Conclusion
While we were successful in lowering current consumption by a factor of 10 by disabling the modem, there are still gains to be found! In the next blog post, we’ll write more about Zephyr’s Power Mode Subsystem and how to utilize it to reduce current consumption even more!

No comments yet! Start the discussion at forum.golioth.io