One of my first engineering jobs was in the Test and Measurement space. Tracing everything back to standards and calibration is a key part of the process. It takes a long time and is taken very seriously. I had many learning experiences that reinforced the importance of calibration (despite my tongue-in-cheek article title).
IoT devices often don’t have the luxury of being as accurate: the cost of sensors, the power usage of analog measurements, the “awake” windows for battery power devices… all of these things contribute to different priorities while measuring the physical world. However, if you have a precise (repeatable) sensor, you can utilize the trend of the data in a useful way.
If you ARE going to calibrate, it’s normally done in a sensor library. For certain sensors, Zephyr excels at this. There are built in sensor libraries that return standard values. You can even pull calibrated and normalized readings from the sensor in real time from Zephyr’s sensor shell. I consistently use sensors like the BME280 and the LIS2DH in my reference designs since it is really easy to add the readings to the pile of data I send back to Golioth.
What happens when a sensor driver is not in tree and I don’t want to go about writing my own sensor driver? I pull the raw readings to the cloud and work with them there!
Prototyping, not production
When you are trying to prove your IoT system can work or test out a business idea, you don’t always start by making production ready designs. But you can still make useful designs by pulling raw data readings.
I did this recently with an i2c sensor that was pulling in ADC readings. The “counts” that I gathered from the ADC are tied to physical phenomenon (in this case, soil moisture), but they are not absolute values. Instead I am able to gather the readings using direct ADC readings and then publish them to Golioth’s LightDB Stream service.
Below, I will discuss three ways you can interact with this data using other Golioth services and interactively produce even more useful data. These include tweaking threshold settings, calibrating via remote procedure call (RPC), and using OTA to upload new machine learning sets.
Set “thresholds” with Settings
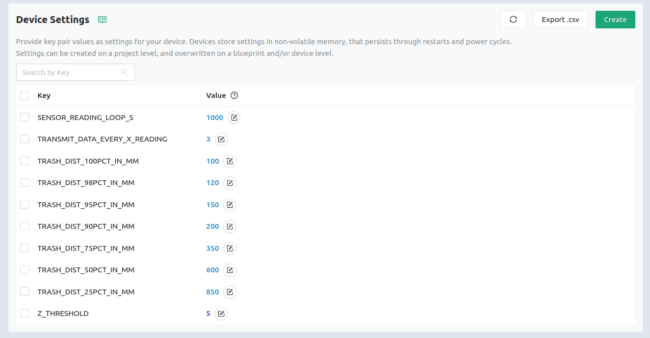
One of my favorite things to use the Golioth Settings Service for is interacting with data and creating an extra layer of intelligence. For the IoT Trashcan Monitor reference design, I do this to set “threshold” on each device in the field. There is a time-of-flight sensor that gathers the distance from the top of the trashcan to the top of the garbage in that trashcan. What happens if you want to utilize the same sensor but on different sized trashcans? What if you want to set the “100%” level of the trashcan differently, say if one part of the national park needs to have a cleaner look than another?
You could keep this intelligence on the Cloud, but then you don’t get the benefit of the device reporting it’s various levels, so it’s harder to read from a terminal or in the logs. I push a level I created on the Settings Service down to each device that defines different thresholds:
I also utilize these levels coming back from each trashcan to trigger icons on our Grafana dashboards, which makes it even easier to tell which devices require intervention.
The above is just for the Trashcan example, there are loads of other examples where you might want to have field-settable values, from the installer or technician. In the case of the soil moisture sensor, I want to be able to calibrate “wet” and “dry” (per the simplistic calibration instructions) and then do some interpolation in between.
On the fly modifications with Remote Procedure Calls
Most of the time when using raw data from a sensor, it is done in a “device to cloud” context. You take the reading from the sensor and ship it off to be dealt with by larger computers (AKA “the cloud”). However, some applications will include the need for some kind of feedback from the cloud computing element. You could argue this is what we were doing above, since the Settings Service is pushing data down to the device.
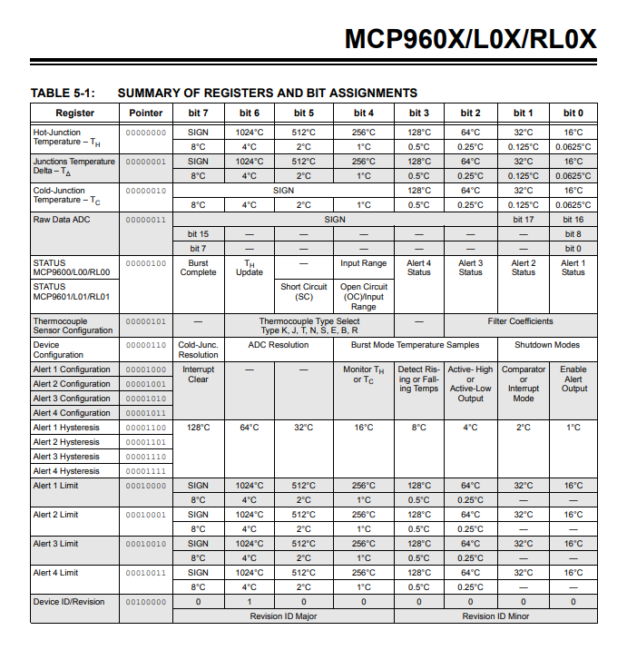
Sometimes you want to be able to inject data into your data measurement and management process on the device, which is a perfect use case for Remote Procedure Calls (RPCs). One way to think of RPCs is if you were accessing a function between two different parts of your code. You put the function prototype in your code.h file… except now you can access that function from the cloud. So maybe I don’t want to do a full calibration on the device, but it is beneficial to set an offset for something like an i2c-based thermocouple measurement chip like the MCP96L01T. I could easily pipe raw data from the chip up to the cloud, but I might want to change a setting for the resolution of that data or the cold junction compensation temperature.

I could have a function on the device that I use during start that sets these values like set_thermocouple_resolution() and set_cold_junction_temp_c(), which I use during startup. Under the covers they would be simple i2c writes to the device to set registers with bit-masked values. However, I could also expose these to the cloud using an RPC. When I call that RPC from the REST API or the Golioth Console, I also pass a value (in this case a new resolution setting or cold junction temp), it gets validated on the device as an acceptable value, and then a success message is sent back to the cloud once its executed. Add in logging messages into the device-side code, and you should be able to easily see that the device has successfully switched modes and the raw data being piped back is now different. (The change means a higher resolution or a different cold junction compensation.)
Machine Learning + data capture + OTA
The ultimate (and most trendy) way to deal with sensor data is to not care at all about the sensor output. Instead, capture and correlate data with desired behaviors; collect data with a “known good” and a “known bad” state of your machine, for instance, to allow the model to discern between the two.
Golioth has the tools to enhance this method of working with data, on a local machine or from afar. First, you can capture general data using LightDB stream, sending back your raw data readings from your sensor. If desired, you could also link a button, switch, or other input on the device to correlate when you are performing “Action A” that is different from “Action B”. Next, you capture and ingest that data into a machine learning algorithm like PyTorch or TinyML. Finally, when you create or revise your model and build it into your design, you can upload that new firmware using the Golioth Over-The-Air (OTA) service. Over time, you can continue to refine the model and even combine it with the other methods mentioned above.
Start prototyping today!
One thing I hope you get out of reading this article is the prototyping capabilities available to you when you use Golioth. While I benefit from the Zephyr driver ecosystem (as well as driver ecosystems from other SDKs that we support), I don’t want to feel limited when I want to try out a new chip that isn’t in-tree yet. I feel comfortable doing things like raw i2c and SPI read/write functions, and now can make that data available to the Cloud for even faster prototyping. If you need help prototyping your next IoT device, stop by our Forum to discuss or send an email to [email protected].


No comments yet! Start the discussion at forum.golioth.io