Marcin Niestrój helped to implement a solution to IoT logging in Zephyr, and that work is the subject of his Connecting Zephyr Logging to the Cloud Over Constrained Channels talk, presented during the 2022 Zephyr Developer’s Summit.
Marcin has been working as an embedded engineer for over 10 years, with the last four of them in Zephyr. He is an active contributor to the Zephyr networking stack, and works on the Zephyr SDK at Golioth, a device management cloud company.
Long-distance logging
Logging is the first line of defense in figuring out what an embedded system is doing. Whether you want to monitor that all is well, get some quick feedback on sensor data, or jump into troubleshooting when something isn’t working, logs are a developer’s best friend. But what about those times when you can’t just plug a programmer or a USB cable into the device sitting on the desk in front of you?
The Internet of Things presents a challenge with device logging as you need to find a way to access logs when you don’t have physical access to the device. The answer, of course, is logging IoT data to the cloud. Marcin guides us through the layers of the existing Zephyr logging system, then shows how Golioth built a backend that allows Zephyr to move messages from the logging core to a remote server.
The Basics of Zephyr Logging
Logs are like fancy printf() statements. They have a subsystem behind them to keep the logs out of the way of more time-sensitive operations. The string messages you would expect to find in each log are joined by some metadata. This includes a timestamp that records the exact timing of the logged event, a log level (Error, Warning, Info, or Debug), and the module/component name where the log originated.
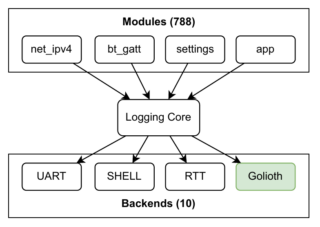
 Hundreds of Zephyr logging modules can send messages to the logging core, which then routes those to whichever backend is configured. You’ve probably used the UART, the Shell, and the RTT backends of Zephyr to route your logs to the most convenient place for your development.
To solve the cloud-logging challenge, Golioth implemented a backend that packages each log message and its metadata for transport. Messages are stored, and may be accessed via a web interface or command line tool. This makes those messages persistent for future debugging, and easily filterable/searchable.
Sending messages with constrained devices in mind
When connected over USB, the more data the better! But when you start to think about devices operating from a small battery source, or chirping data over cellular or a thread network, you need your messaging to be as lean and quick as possible.
One simple way to do this is by making sure that the device only sends messages that are needed, based on the logging level. The device monitors a LightDB endpoint on the server, and will only transmit messages within that log level range. This effectively becomes “on-demand logging”. You can leave it off by default, but you always have the option to turn it on remotely to monitor devices in production without breaking the bank on bandwidth charges.
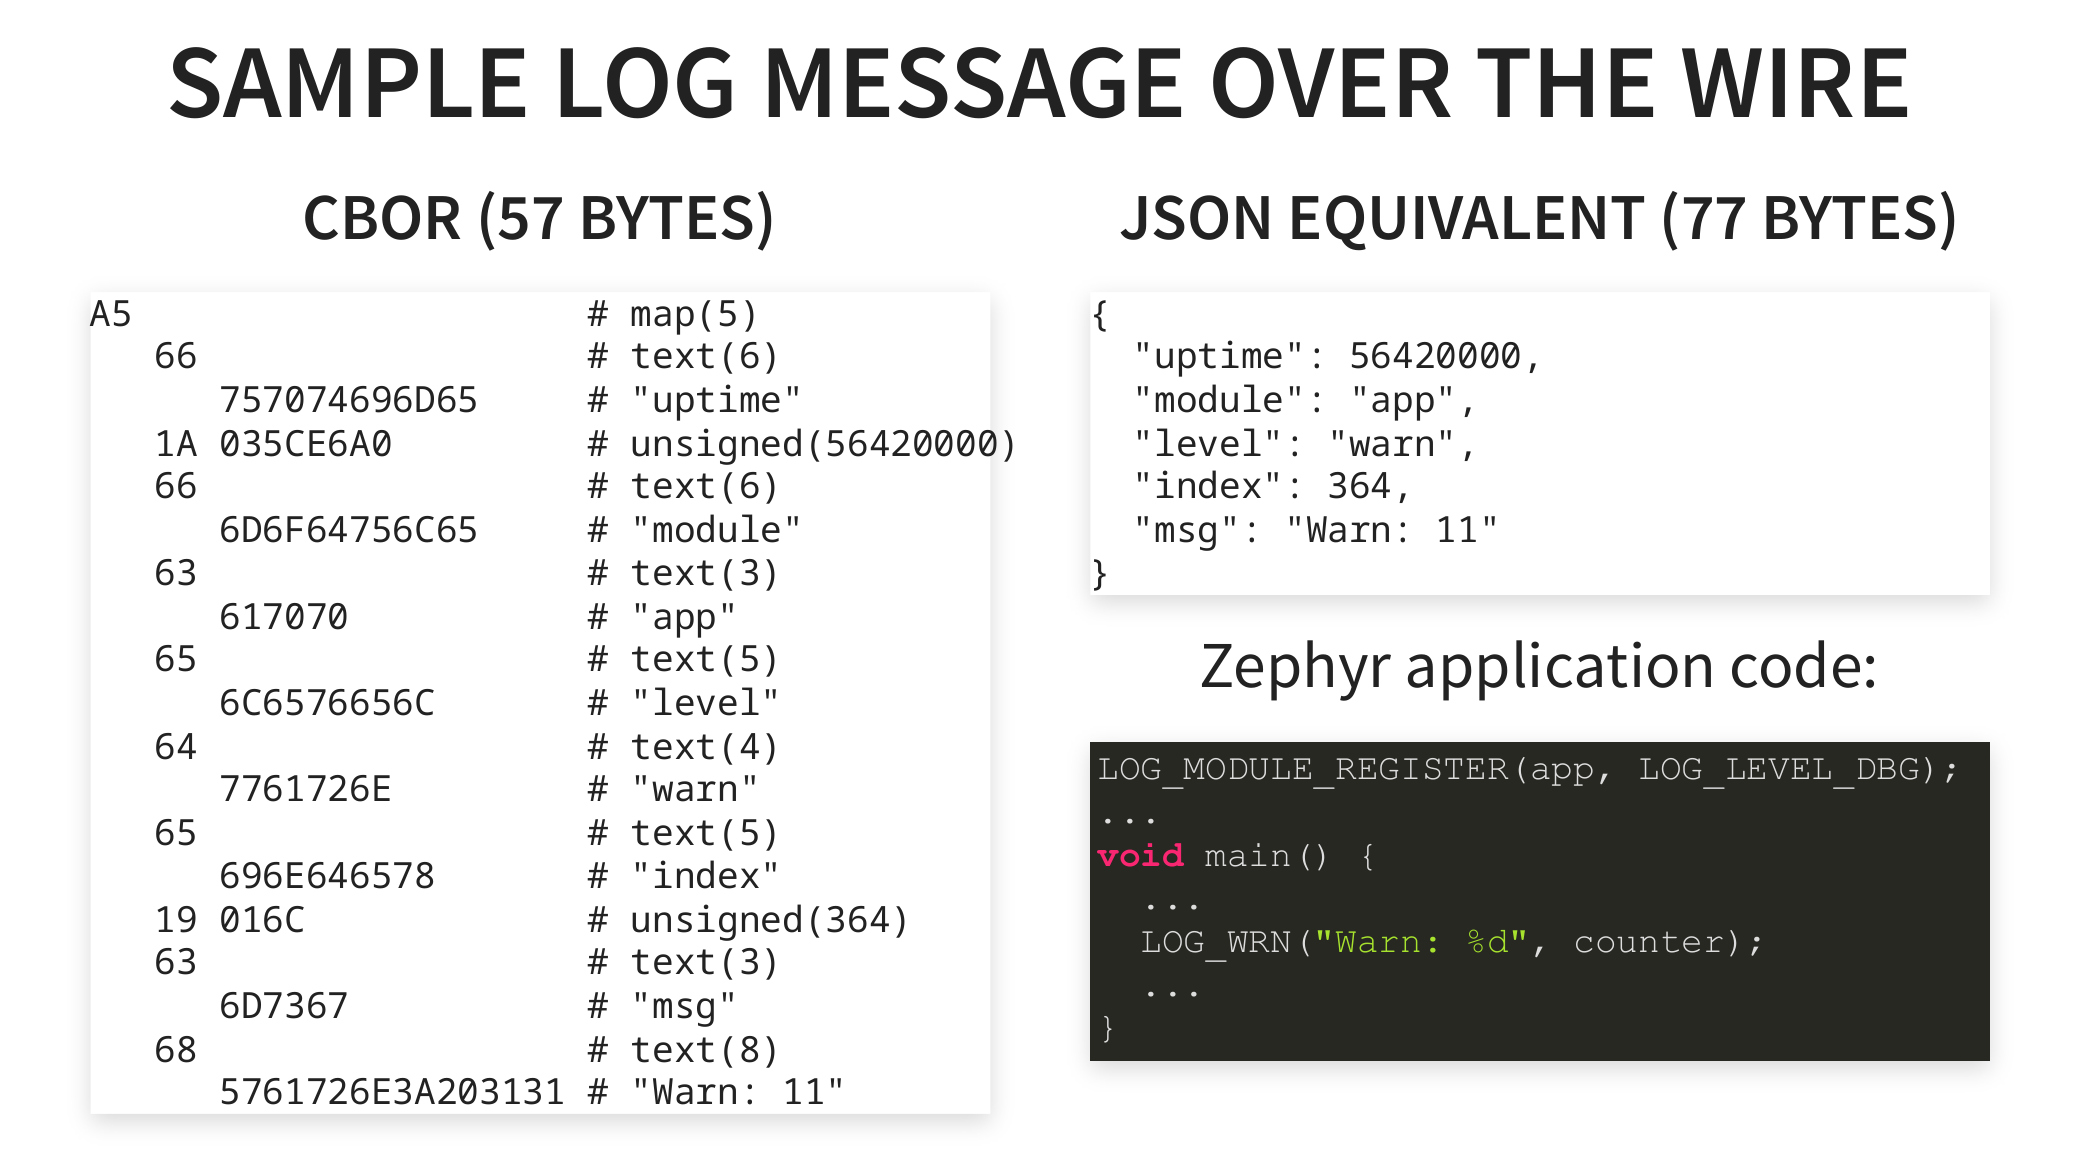
But of course, the way each message is sent also matters greatly. Log messages are transmitted as a UDP datagram, using CBOR for serialization and CoAP as the protocol layer. This has numerous bandwidth-saving benefits (and therefore radio-on time battery benefits) over other options like sending JSON over HTTP. This approach has also shown to be more efficient than the MQTT protocol which itself targets constrained devices.
This is just the preamble
What you’ve read so far is all just set up for the technical dive that Marcin treats us to. Scroll back up and watch his talk which shares the reasoning behind each decision that has been made. He also delves into some areas for future work: advanced message queuing, resend logic, packing multiple messages into each datagram for bandwidth saings, and using a dictionary for module names instead of sending them as text in every message.


