Dynamic memory allocation in C is a powerful tool but also a potential source of hard to replicate bugs. Edge cases that leak memory slowly over time may go unnoticed until your project scales, which can mean your devices are already in the field. But Zephyr includes heap monitoring features that you can add to your testing/debugging process to help you detect leaks and resolve them before they end up in production.
I use heap monitoring in pretty much every Zephyr project where I use dynamic memory allocation. It’s easy to set up and use but it’s also absent from the Zephyr documentation, existing esoterically in the API reference. I’m writing this blog post to help inform you, but also so I can use this as my cheat sheet the next time I need it!
Zephyr System Heap Runtime Stats
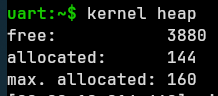 The good news is that if you are using the Zephyr Shell, you likely already have access to the heap stats by typing
 kernel heap. This is a useful tool for spot checking your heap usage. If the command is not working for you, make sure you have CONFIG_KERNEL_SHELL selected.
Spot checks like this will catch egregious leaks where you keep allocating memory on a regular basis without freeing it. However, I’ve found that programmatically tracking heap usage and reporting on anomalous growth is the most reliable way to catch a subtle leak.
If you look deep inside the API reference for Zephyr’s low level heap allocator you’ll be delighted to find sys_heap_runtime_stats_get().
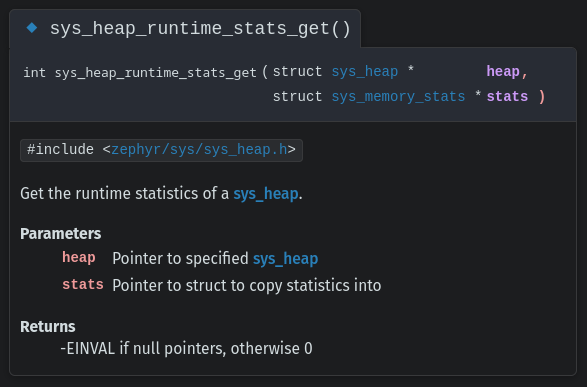 However, it’s not entirely clear how to get the pointer to the system heap that this function requires as a parameter. Luckily, we already know the kernel shell is getting these stats from somewhere so it is just a matter of grepping to find how it’s done. Let’s put together a test app to illustrate.
Memory Leak Test App
Here’s a barebones application that includes a memory leak that is tracked by printing out heap stats during every other loop.
CONFIG_LOG=y
CONFIG_SHELL=y

# Heap size may default to 0 in which case, no heap is allocated
CONFIG_HEAP_MEM_POOL_SIZE=4096

# Use runtime stats
CONFIG_SYS_HEAP_RUNTIME_STATS=y
#include <zephyr/logging/log.h>
LOG_MODULE_REGISTER(memory_leak, LOG_LEVEL_DBG);

#include <stdint.h>
#include <zephyr/sys/sys_heap.h>
#include <zephyr/kernel.h>

struct sys_memory_stats stat;

extern struct sys_heap _system_heap;

int main(void)
{
    uint32_t counter = 0;

    while (true) {
        int *my_int = k_malloc(sizeof(int));

        counter++;
        if (0 == counter % 2)
        {
            continue;
        }

        LOG_INF("Hello %u", counter);
        sys_heap_runtime_stats_get(&_system_heap, &stat);
        LOG_WRN("Heap: Free: %u, Alloc: %u, MaxAlloc: %u", stat.free_bytes,
                stat.allocated_bytes, stat.max_allocated_bytes);

        k_free(my_int);

        k_msleep(2000);
    }
}
The important parts of this code include:
CONFIG_SYS_HEAP_RUNTIME_STATS=yto include the library in the buildextern struct sys_heap _system_heapto point to the system heapsys_heap_runtime_stats_get(&_system_heap, &stat)to poll the heap stat information
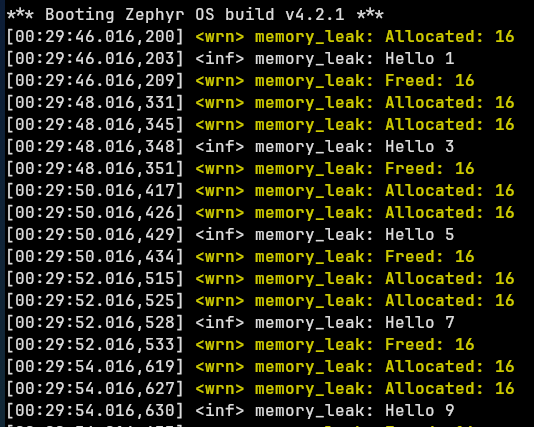
When we run the program, an integer is dynamically allocated at the beginning of the loop and freed at the end. However, if the counter is even, we continue the loop, which jumps past the k_free() command causing a memory leak. Here’s the output of this program.
*** Booting Zephyr OS build v4.2.1 ***
[00:21:16.071,588] <inf> memory_leak: Hello 2
[00:21:16.071,600] <wrn> memory_leak: Heap: Free: 3992, Alloc: 32, MaxAlloc: 32
[00:21:18.071,775] <inf> memory_leak: Hello 4
[00:21:18.071,785] <wrn> memory_leak: Heap: Free: 3976, Alloc: 48, MaxAlloc: 48
[00:21:20.071,868] <inf> memory_leak: Hello 6
[00:21:20.071,876] <wrn> memory_leak: Heap: Free: 3960, Alloc: 64, MaxAlloc: 64
[00:21:22.071,966] <inf> memory_leak: Hello 8
[00:21:22.071,974] <wrn> memory_leak: Heap: Free: 3944, Alloc: 80, MaxAlloc: 80
[00:21:24.072,063] <inf> memory_leak: Hello 10
[00:21:24.072,069] <wrn> memory_leak: Heap: Free: 3928, Alloc: 96, MaxAlloc: 96
[00:21:26.072,163] <inf> memory_leak: Hello 12
Here we see the allocated memory growing and growing. By moving around where the reporting is happening you can narrow down the part of your code that is causing the leak.
Zephyr Heap Listener
Memory stats give you running totals of what is happening with the heap. But it’s also useful to know where and when the allocations are happening. For this we can use Zephyr’s Heap Listener features. Let’s update our application to use listeners instead of stats.
CONFIG_LOG=y
CONFIG_SHELL=y

# Heap size may default to 0 in which case, no heap is allocated
CONFIG_HEAP_MEM_POOL_SIZE=4096

# Use heap listener
CONFIG_SYS_HEAP_LISTENER=y
#include <zephyr/logging/log.h>
LOG_MODULE_REGISTER(memory_leak, LOG_LEVEL_DBG);

#include <stdint.h>
#include <zephyr/sys/sys_heap.h>
#include <zephyr/sys/heap_listener.h>
#include <zephyr/kernel.h>

extern struct sys_heap _system_heap;

void on_heap_alloc(uintptr_t heap_id, void *mem, size_t bytes)
{
    LOG_WRN("Allocated: %zu", bytes);
}
HEAP_LISTENER_ALLOC_DEFINE(my_heap_listener_alloc, HEAP_ID_FROM_POINTER(&_system_heap),
               on_heap_alloc);

void on_heap_free(uintptr_t heap_id, void *mem, size_t bytes)
{
    LOG_WRN("Freed: %zu", bytes);
}
HEAP_LISTENER_FREE_DEFINE(my_heap_listener_free, HEAP_ID_FROM_POINTER(&_system_heap), on_heap_free);

int main(void)
{
    uint32_t counter = 0;

    heap_listener_register(&my_heap_listener_alloc);
    heap_listener_register(&my_heap_listener_free);

    while (true) {
        int *my_int = k_malloc(sizeof(int));

        counter++;
        if (0 == counter % 2)
        {
            continue;
        }

        LOG_INF("Hello %u", counter);

        k_free(my_int);

        k_msleep(2000);
    }
}
This approach uses a familiar Zephyr pattern to define callbacks for the allocation and free events. These listeners are registered at run time so that the callbacks run each time k_malloc() and k_free() are called.
 When we look at this output it is pretty obvious that we’re allocating twice as often as we are freeing memory. For our simple application this visual pattern tells the whole story. But in your own test code, these callbacks can be used to keep track of the stats, or monitor for an imbalance between the two functions. There is also a callback available for heap resize events.
Demystifying Heap Operations
It’s easy to be complacent and never give heap usage a second thought. But memory leaks are notoriously difficult to track down in large code bases, so it pays to keep an eye on the heap starting early in your development. Use these built-in Zephyr tools in your testing and set up alerts to catch an issue early, or better yet, to give you peace of mind when those tests turn up green. If you find that your devices in the field already have a leak that are affecting operations, Golioth’s Over the Air firmware update capabilities will make it easy to push a fix and even monitor the resulting logs.

No comments yet! Start the discussion at forum.golioth.io