GDB–and step debugging generally–is something that often feels unnecessary for my Zephyr development, until it very much is needed. It’s not that it’s difficult, but it’s not part of my normal workflow and printf (or actually printk and LOG_DBG in Zephyr) debugging fits my needs for most applications I’m creating. As a hardware engineer, I’m often leaning on in-tree drivers and protocol stacks that are already proven and working.
Well, sometimes things don’t work.
Today I’m going to go through how to utilize tools like west attach to fire up gdb and start digging into code, one step at a time.
Digging into issues with drivers
I don’t know about you, but as a hardware engineer, I always assume the problem with code is…me. So my first instinct isn’t necessarily to start digging under the hood of Zephyr so much as “let’s figure out what I configured wrong”. This results in lots of tweaking of configurations like devicetree and kconfig symbols.
Sometimes it happens that I need to check if those configurations are even taking effect though. This happened recently with configuring the behavior of an accelerometer we have on a lot of our development boards. I wanted to set up “wake on movement” and I have been struggling. I will get into the details of that in a future post once things are working better using many of the techniques I describe below. My co-worker Mike sat down with me and helped me do some of this debugging, and was the inspiration for this article. Mike has written about using GDB on the bootloader before (a more difficult task) but I realized we didn’t have an article about GDB on the application side of Zephyr. That’s likely because GDB is “obvious” to many engineers, but as this series of articles shows, “Zephyr for Hardware Engineers” is meant to empower folks who don’t dig under the hood of code that often.
GDB over other options?
My expectations around debugging are built from my early experiences with Eclipse-based tools offered from vendors:
- Pre-configured from the vendor, often set up for Windows
- Lots of buttons to click, but one with a bug and a play button
- Double click next to the line I want to break on, start the debugger, wait for the view to change to ‘debug view’, and hope for the best
Transitioning from that to a more command-line driven development flow, it kind of makes sense that I would stick to printk debugging: where do I click?
There are a growing number of vendor-specific options for building on different vendor ecosystems with Zephyr and getting pre-configured VS code setups to work with those boards. It’s still Zephyr and it’s a good option, but I wanted to use this learning opportunity to dig in.
Getting started with west and GDB
We’re unabashed fans of the west meta tool that Zephyr provides because it pulls together so many individual tools like the build system and Python scripts that manage tooling like autocompletion and SDK installation.
The key command we’ll use here is west attach.
After you build and flash the board (as we show how to do in our training pages), you are ready to connect the debugger. Why not use west debug? Well, that’s fine too, but requires more setup. And to be honest, when I see all my smartest firmware coworkers using attach…I take the hint. As an actual explanation: debug reflashes the ELF each time, which can overwrite flash areas you didn’t intend (e.g. bootloader), whereas west attach is non-destructive. Instead, you can run attach and hook up GDB whenever you’d like. If you want to run from the reset vector, you can use a command like monitor reset from within GDB (note the (gdb) callouts to see where you’re executing commands from within GDB vs on the normal command line. That command resets the remote GDB server–which thanks to west, we’re not really thinking about here, but is part of the equation.
I should state my hardware setup, since variations could require different commands. I am building/testing for the Tikk board, which is plugged into an nRF52840 on a ProMicro-compatible form factor. I am connected to that board using a JLink PLUS Compact for programming and debugging, which should mirror other JLink setups. If you’re using a different debugger, look up Zephyr’s concepts of ‘runners’, which can/will be part of your build process and will allow you to customize for whichever board you might be building against. It’s possible (and preferable!) that these are already set up for many of the boards that are in-tree for Zephyr.
So to recap:
west build -p -b promicro_nrf52840 tikk_fleet/app
west flash
west attach
(gdb) monitor reset
Now we have built, programmed, and started debugging an application in Zephyr. Here we go!
Commands within GDB
This is where I almost always get confused about what to do next. So I am writing this article for future-Chris as well. I will encase any shortcut with [ ] because main keywords are shortened for convenience/speed:
[b]reak sensor_read   # Function name to break on (ie. "sensor_read")
[b]reak main.c:34     # Call out a line ("34") of a file ("main.c") to break on
[c]ontinue            # Continue the program until next breakpoint
[n]ext                # step over
[s]tep                # step into
[f]inish              # run until current function returns
[p]rint <var>         # display latest variable, but also can print out complex data structures
[i]nfo [b]reakpoints  # list all breakpoints
[d]elete 1            # delete breakpoint #1 (shown in command above)
[b]ack[t]race         # see all calls that got you to where you currently are
[i]nfo threads        # see all threads (useful since this is an RTOS)
[w]atch <var>         # break when a variable's value changes
x/32bx 0x20020000     # prints out 32 bytes in hex format from that address
clear                 # remove the breakpoint you just stopped on
For commands like [n]ext and [s]tep, it’s also possible to repeat the action by continuing to hit the enter key, especially useful as you’re stepping through a program.
Oh man, there are so many more. This is a deep rabbit hole and there are literal books on the subject. The above will get you started. Almost any command has a help menu that’s accessible from within the (gdb) command line, so take advantage of that as well.
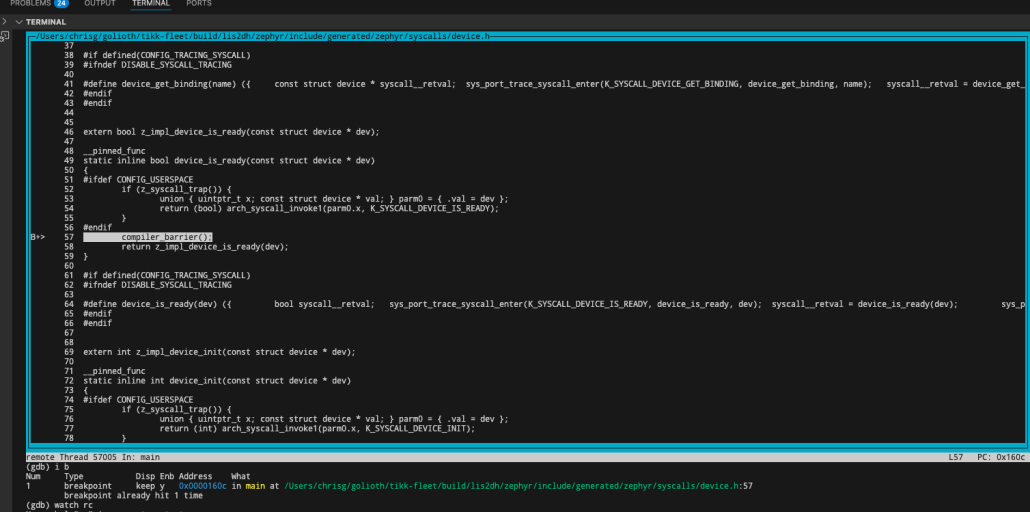
Getting more context with TUI
This one really unlocked more useful info for me. If I’m in a terminal window for my project and I type in west attach, it’ll do that. But where am I in the code? What are some of the available symbols. It’s almost like entering a video game level without a map. Well if you want a map, hit ctrl + x and then a, you will be shown the current location in a program
From here you can scroll up and down in that file. If you don’t want to have focus on the code window, you can repeat the ctrl + x, a command to close the window or ctrl + x, o to change ‘focus’ back to the (gdb) terminal prompt. Other ways to enable TUI include:
layout src           # show source window (same as ctrl + x, a)
layout asm           # show assembly window
layout split         # source + assembly split
layout regs          # registers window
focus src            # focus on the source window (same as ctrl + x, o)
Other navigation
ctrl + c interrupts the target, which is especially useful if your interface gets locked up.
ctrl + d from the (gdb) command line will gracefully exit
help from the (gdb) command line will introduce you to myriad other commands, as will other resources about GDB online. This is just the tip of the iceberg for fellow hardware engineers.
So how did you solve your problem?
The resolution to the problem with the accelerometer is ongoing from a code perspective. I still am not completely certain why configuration isn’t passing down over the i2c bus to the LIS2DH. However, I was able to trigger the expected behavior by directly modifying registers on the i2c device using the i2c shell, another favorite troubleshooting tool around these parts. I could directly manipulate the values I needed to turn on the interrupt mode that I wanted. With the shell interface to i2c and the ability to halt on code and dig into the problem, I’m certain I’ll be able to troubleshoot the root cause. As always with electronics, having the right tool for the job makes things much easier. I’m grateful to have expert co-workers that also help guide me along the path, and hope this article does the same for you. If you get stuck please let us know over on the Golioth forum.

No comments yet! Start the discussion at forum.golioth.io