Cellular connected IoT can be intimidating, especially when the cellular connection doesn’t work, or only works intermittently. Today we will explore Nordic’s LTE Link Monitor and Cellular Monitor applications to show how you can troubleshoot cellular connection using the nRF9160 DK as the development board.
Programming the modem firmware
The modem allows applications to send and receive data on the cellular network, and the application talks to the modem via the AT commands. Every nRF9160 SiP has modem firmware (separate from your application code) that is provided as a pre-compiled binary file, signed and encrypted by Nordic Semiconductor.
It’s always beneficial to update the modem firmware to the latest version. In fact, this is the first thing you should try. Make sure you have the nRF Connect for Desktop tool installed and follow these steps to do so:
- Download the latest modem firmware (at the moment of writing, it’s v1.3.5),
- Open the Programmer Application from nRF Connect for Desktop
- Connect the nRF9160 DK to your computer and select it in the Programmer Application
- Click the
Add filebutton, add themfw_nrf9160_1.3.5.zipfile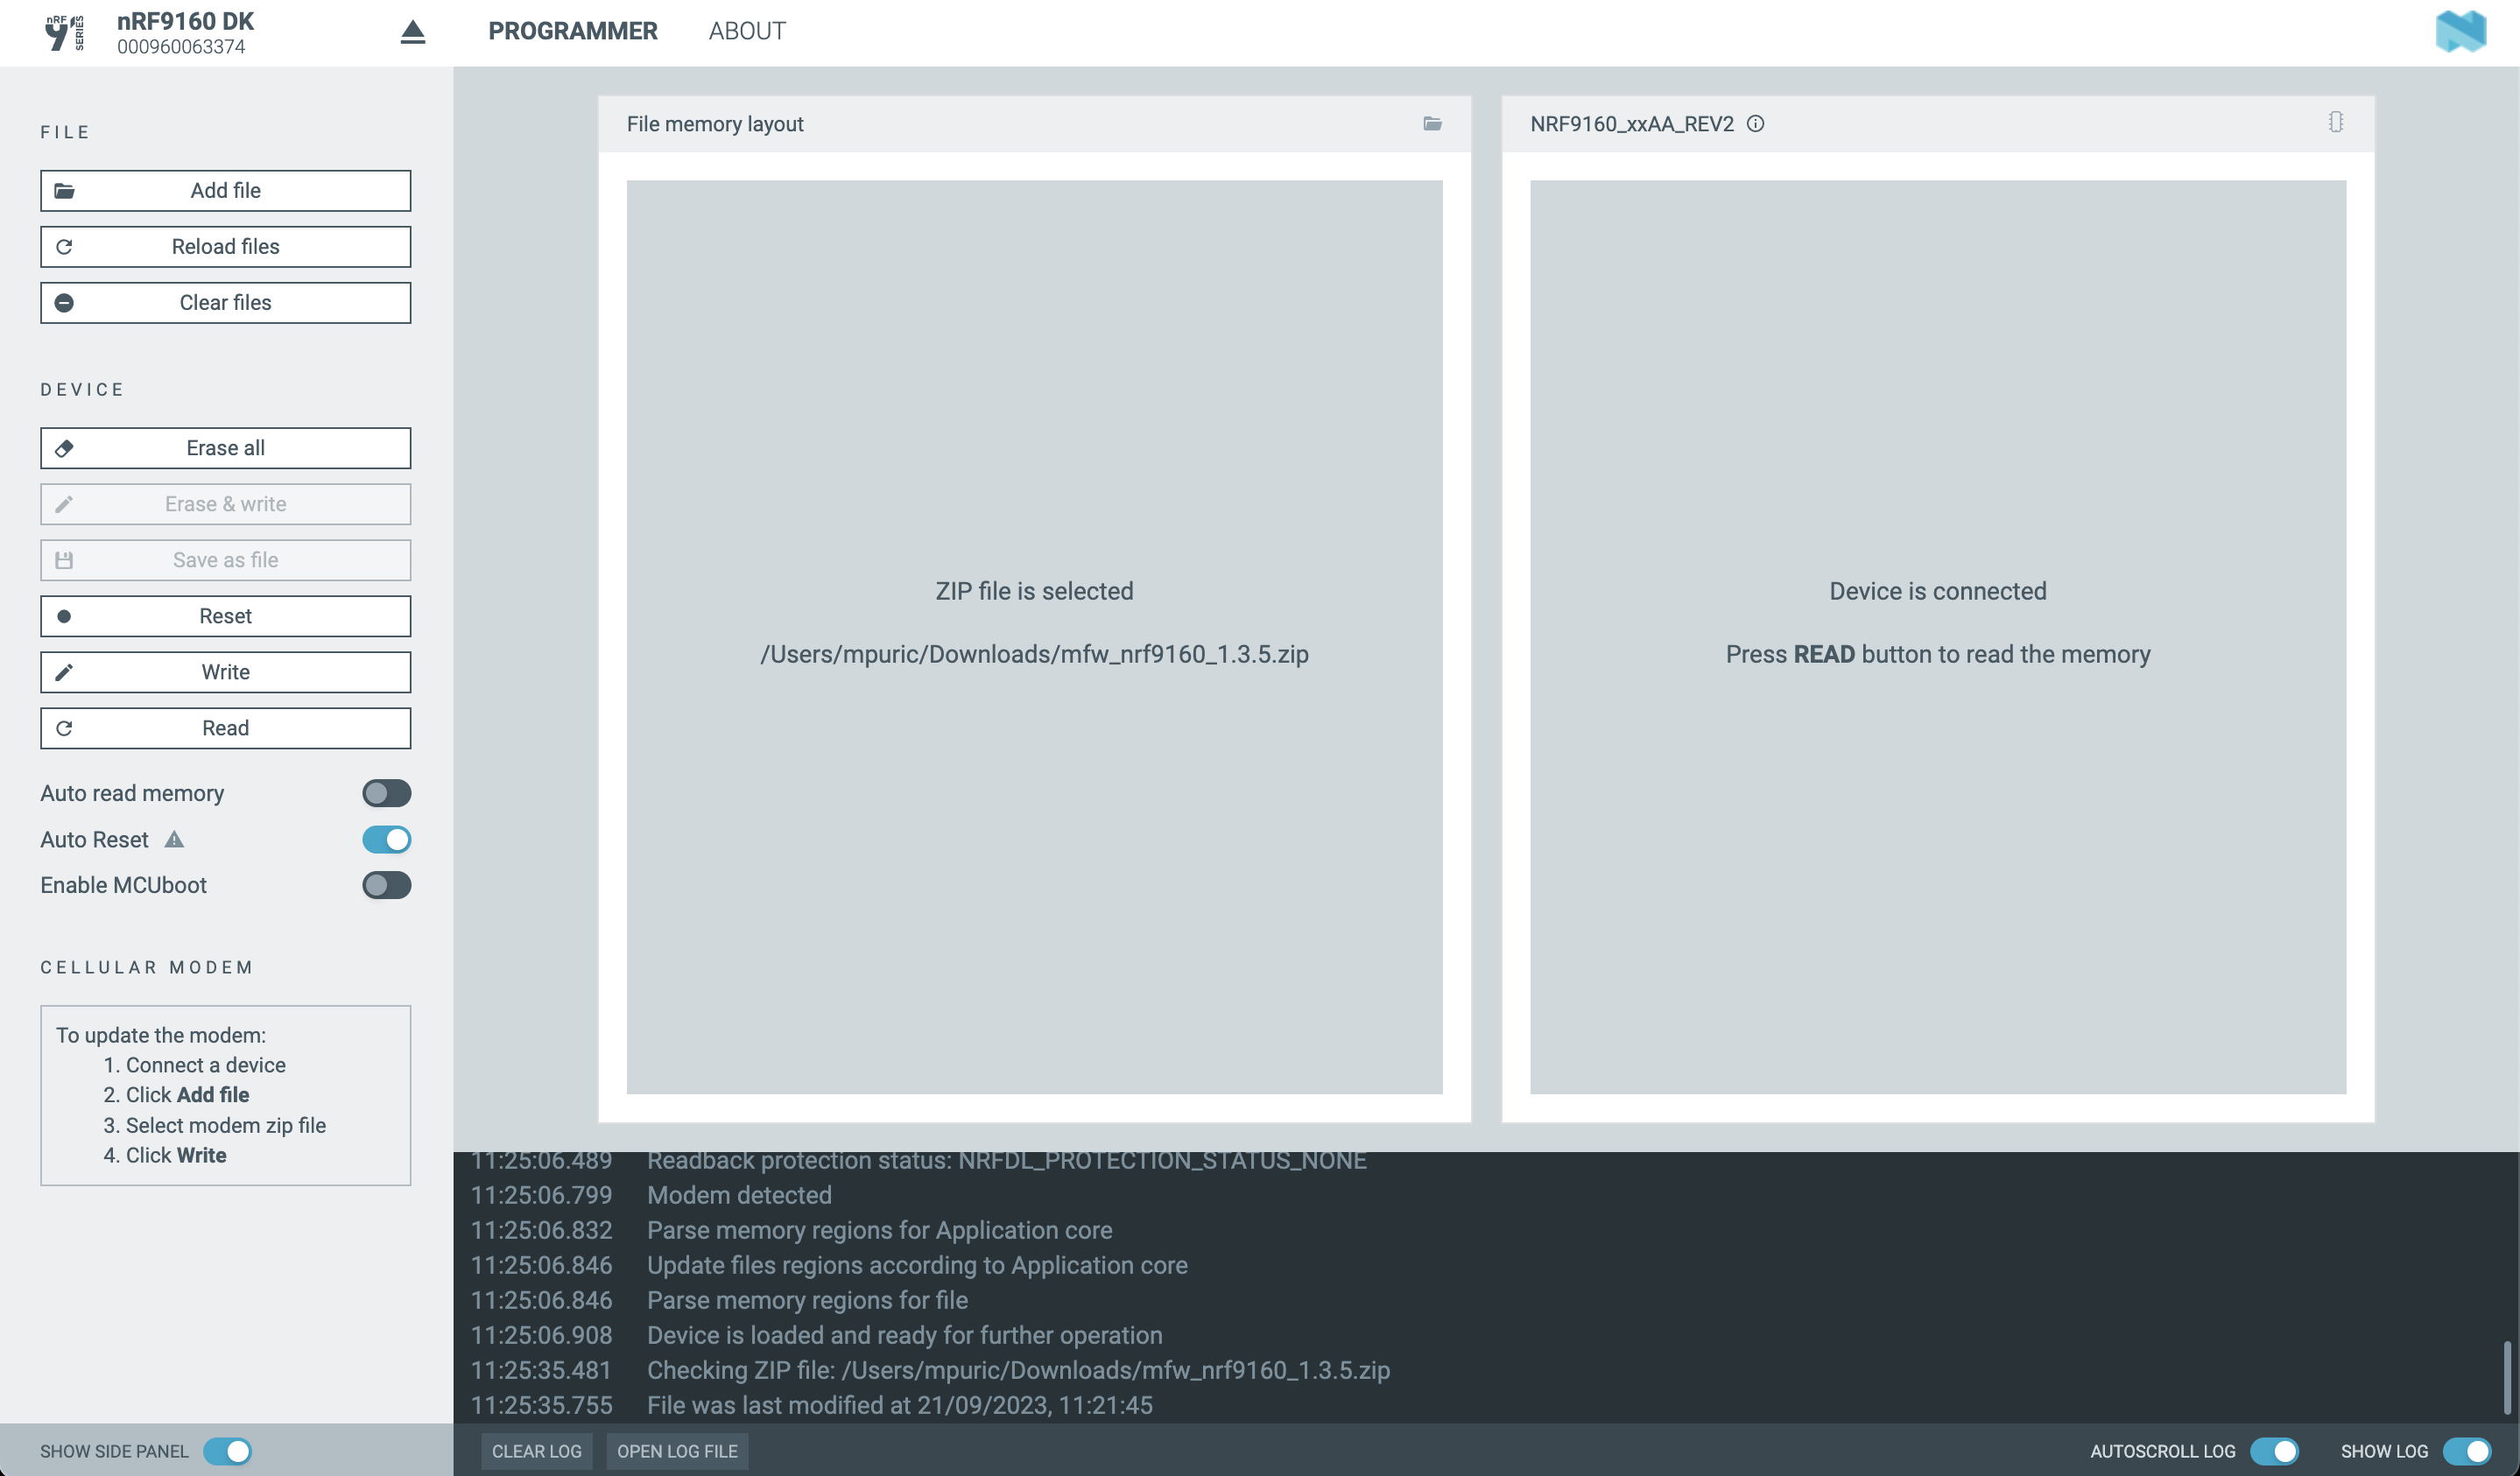
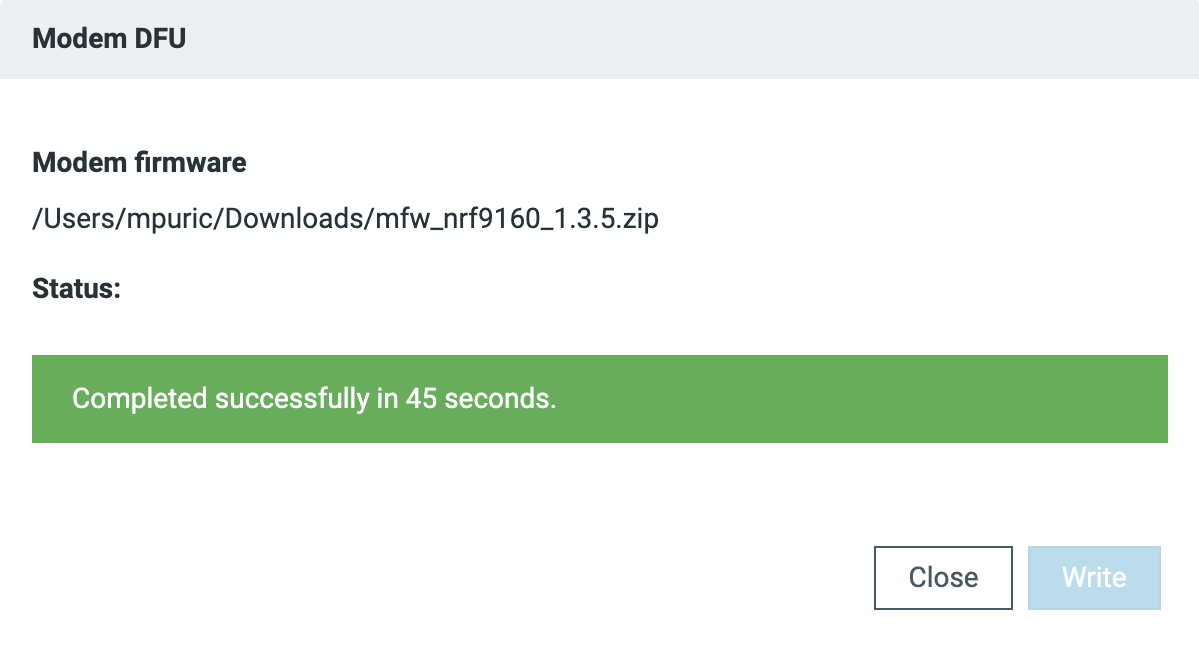
- Flash modem firmware with the
Writebutton
LTE Link Monitor
If updating the firmware didn’t work, it’s time to look at the status of the cellular connection. LTE Link Monitor is part of the nRF Connect for Desktop tool. I works alongside a modem client application that monitors the modem status and activity using AT commands.
For this demo, we’ll use Nordic’s at_client sample for the nRF9160 DK, which can be found at nrf/samples/nrf9160/at_client (Nordic changed folder names over the summer so this may be in samples/cellular/at_client for you).
The AT Client sample demonstrates the asynchronous serial communication taking place over UART to the nRF9160 modem, enabling you to use an external computer to send AT commands to the LTE-M/NB-IoT modem. This facilitates the reading of responses or analyzing of events related to the nRF9160 modem.
Note that not all commands are supported in all modem firmware versions; that is why the first step was to update the modem firmware to the latest version.
Switch to NB-IoT standard with AT commands
In our recent blog post, we showed how to switch the preferred cellular connection standard from LTE-M to NB-IoT with configuration files. Now, we are going to do the same thing with AT commands and later show how the two are connected with Zephyr’s Kconfig Configuration System.
To switch from the default LTE-M connection standard to NB-IoT, do the following:
- Flash the
at_clientexample built for the nRF9160 DK, - open the LTE Link Monitor Application and connect to the development board,
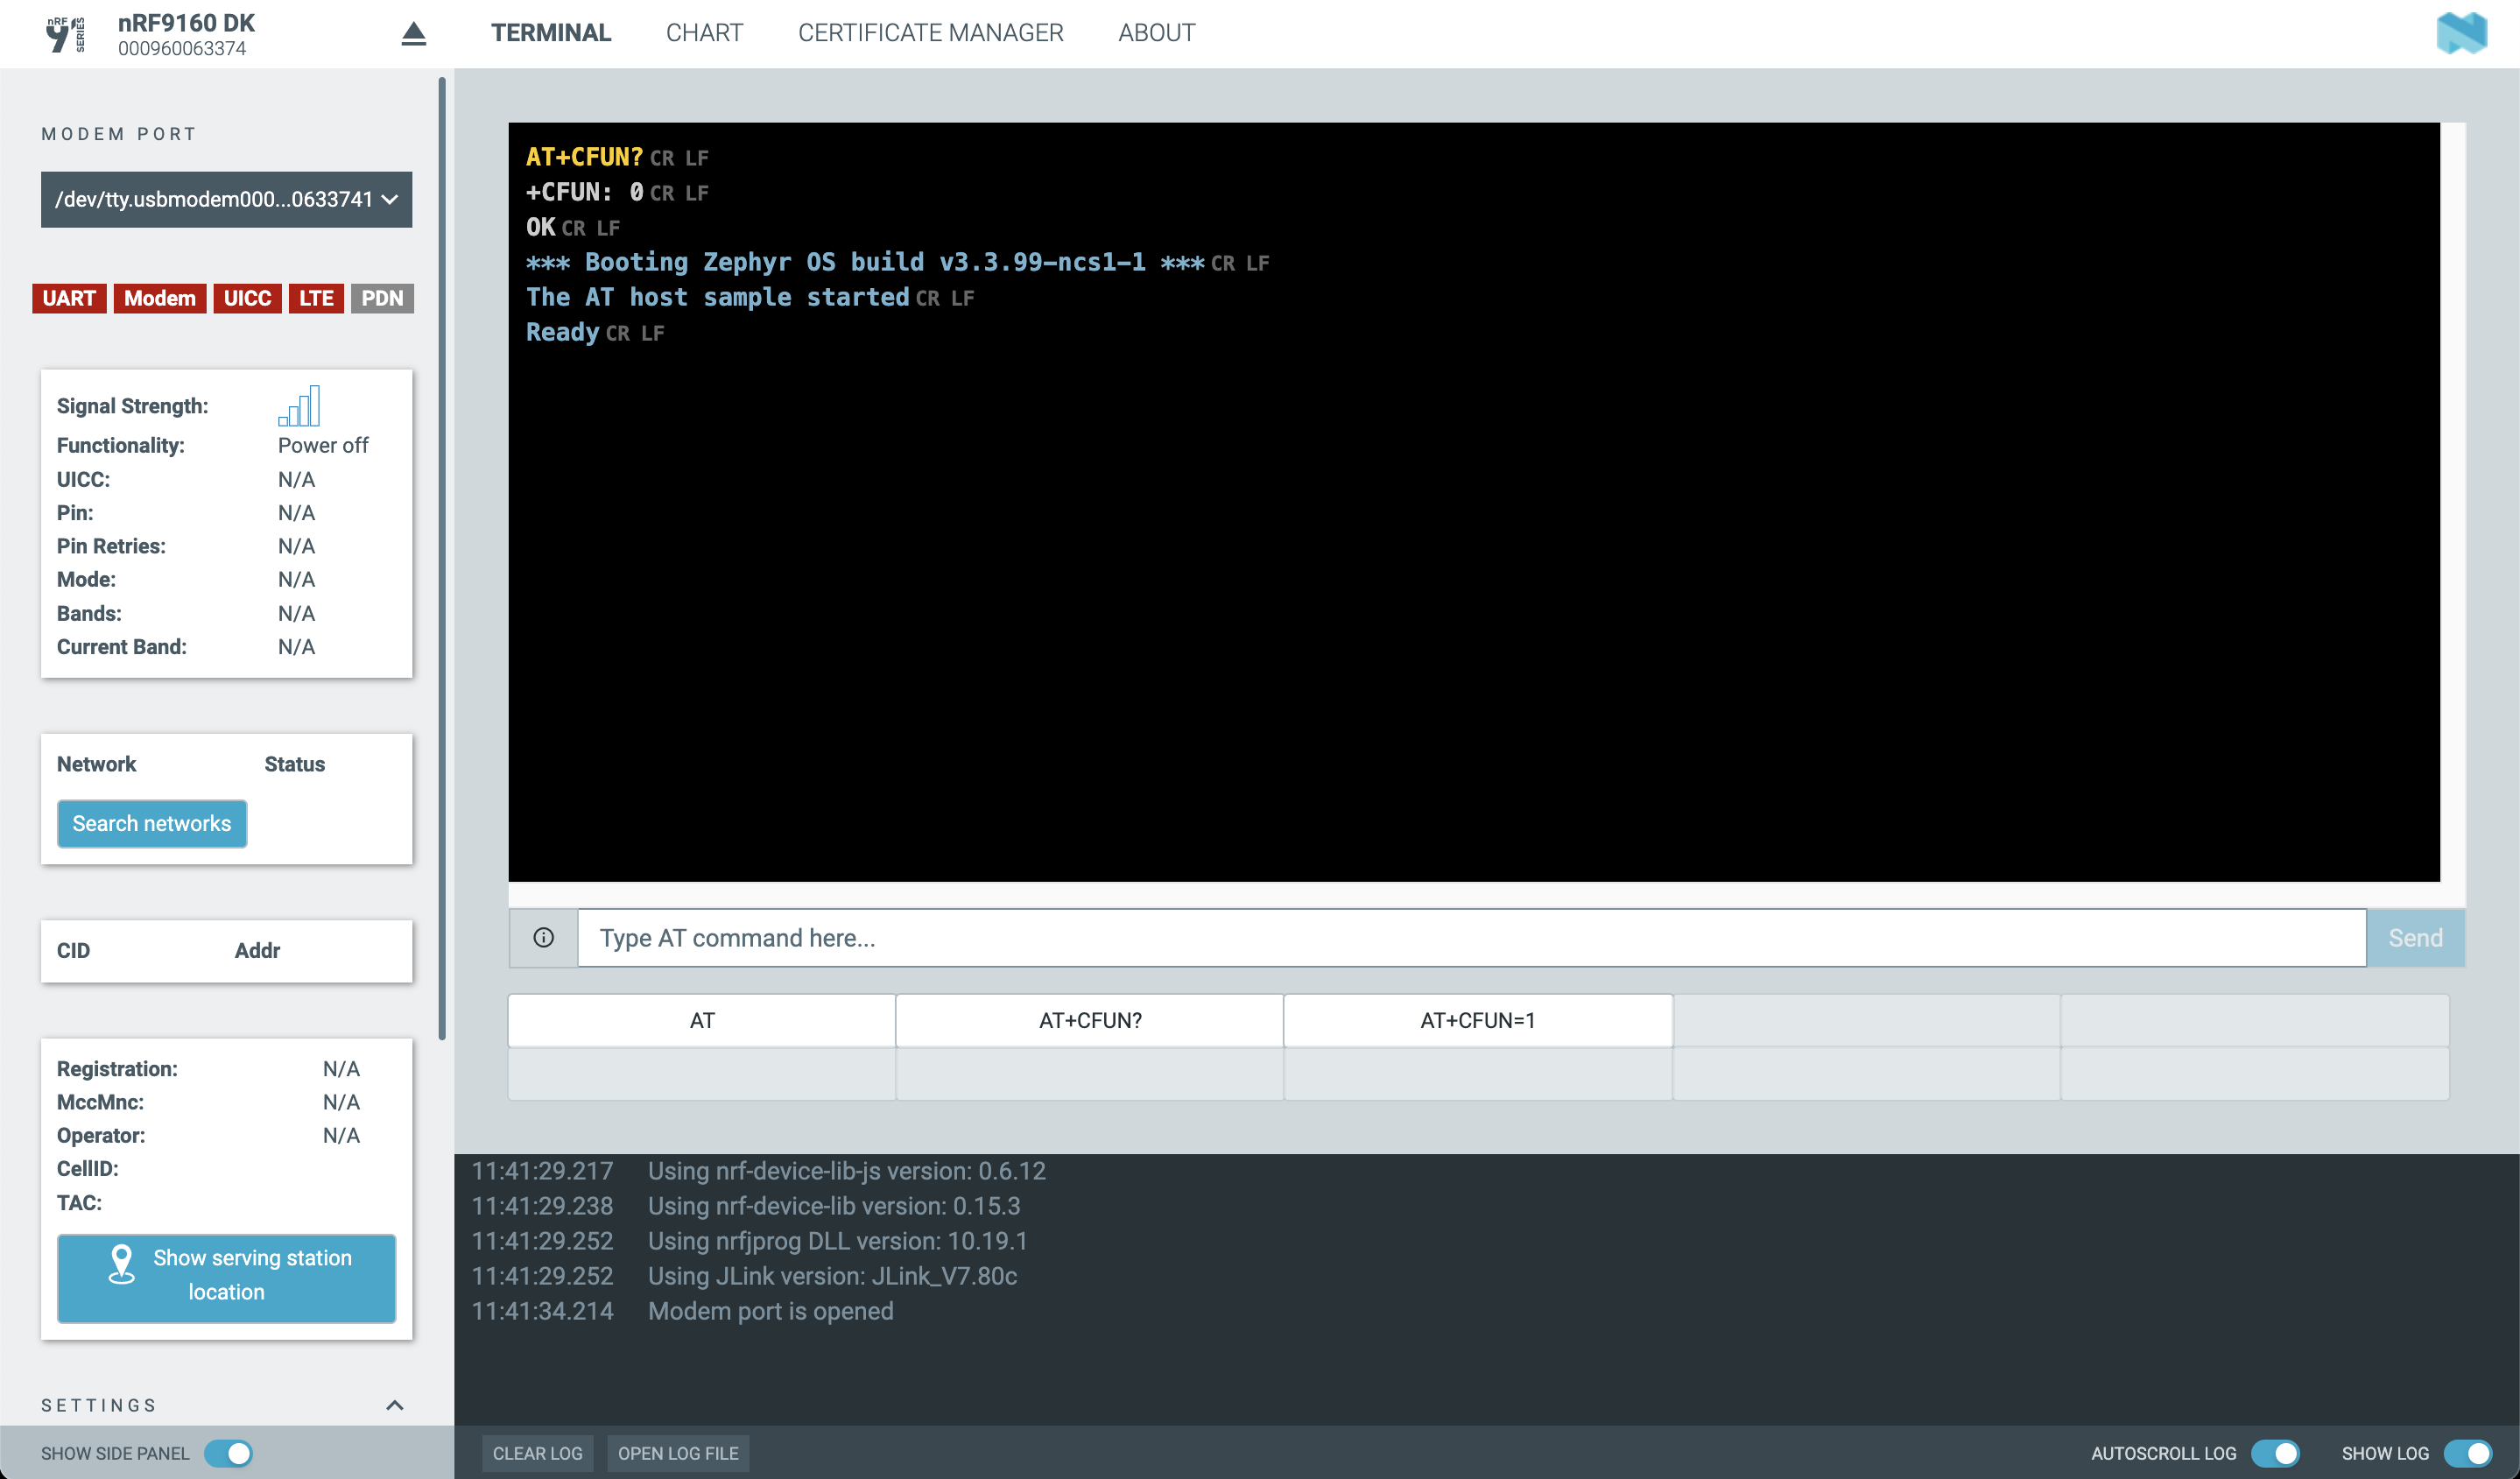
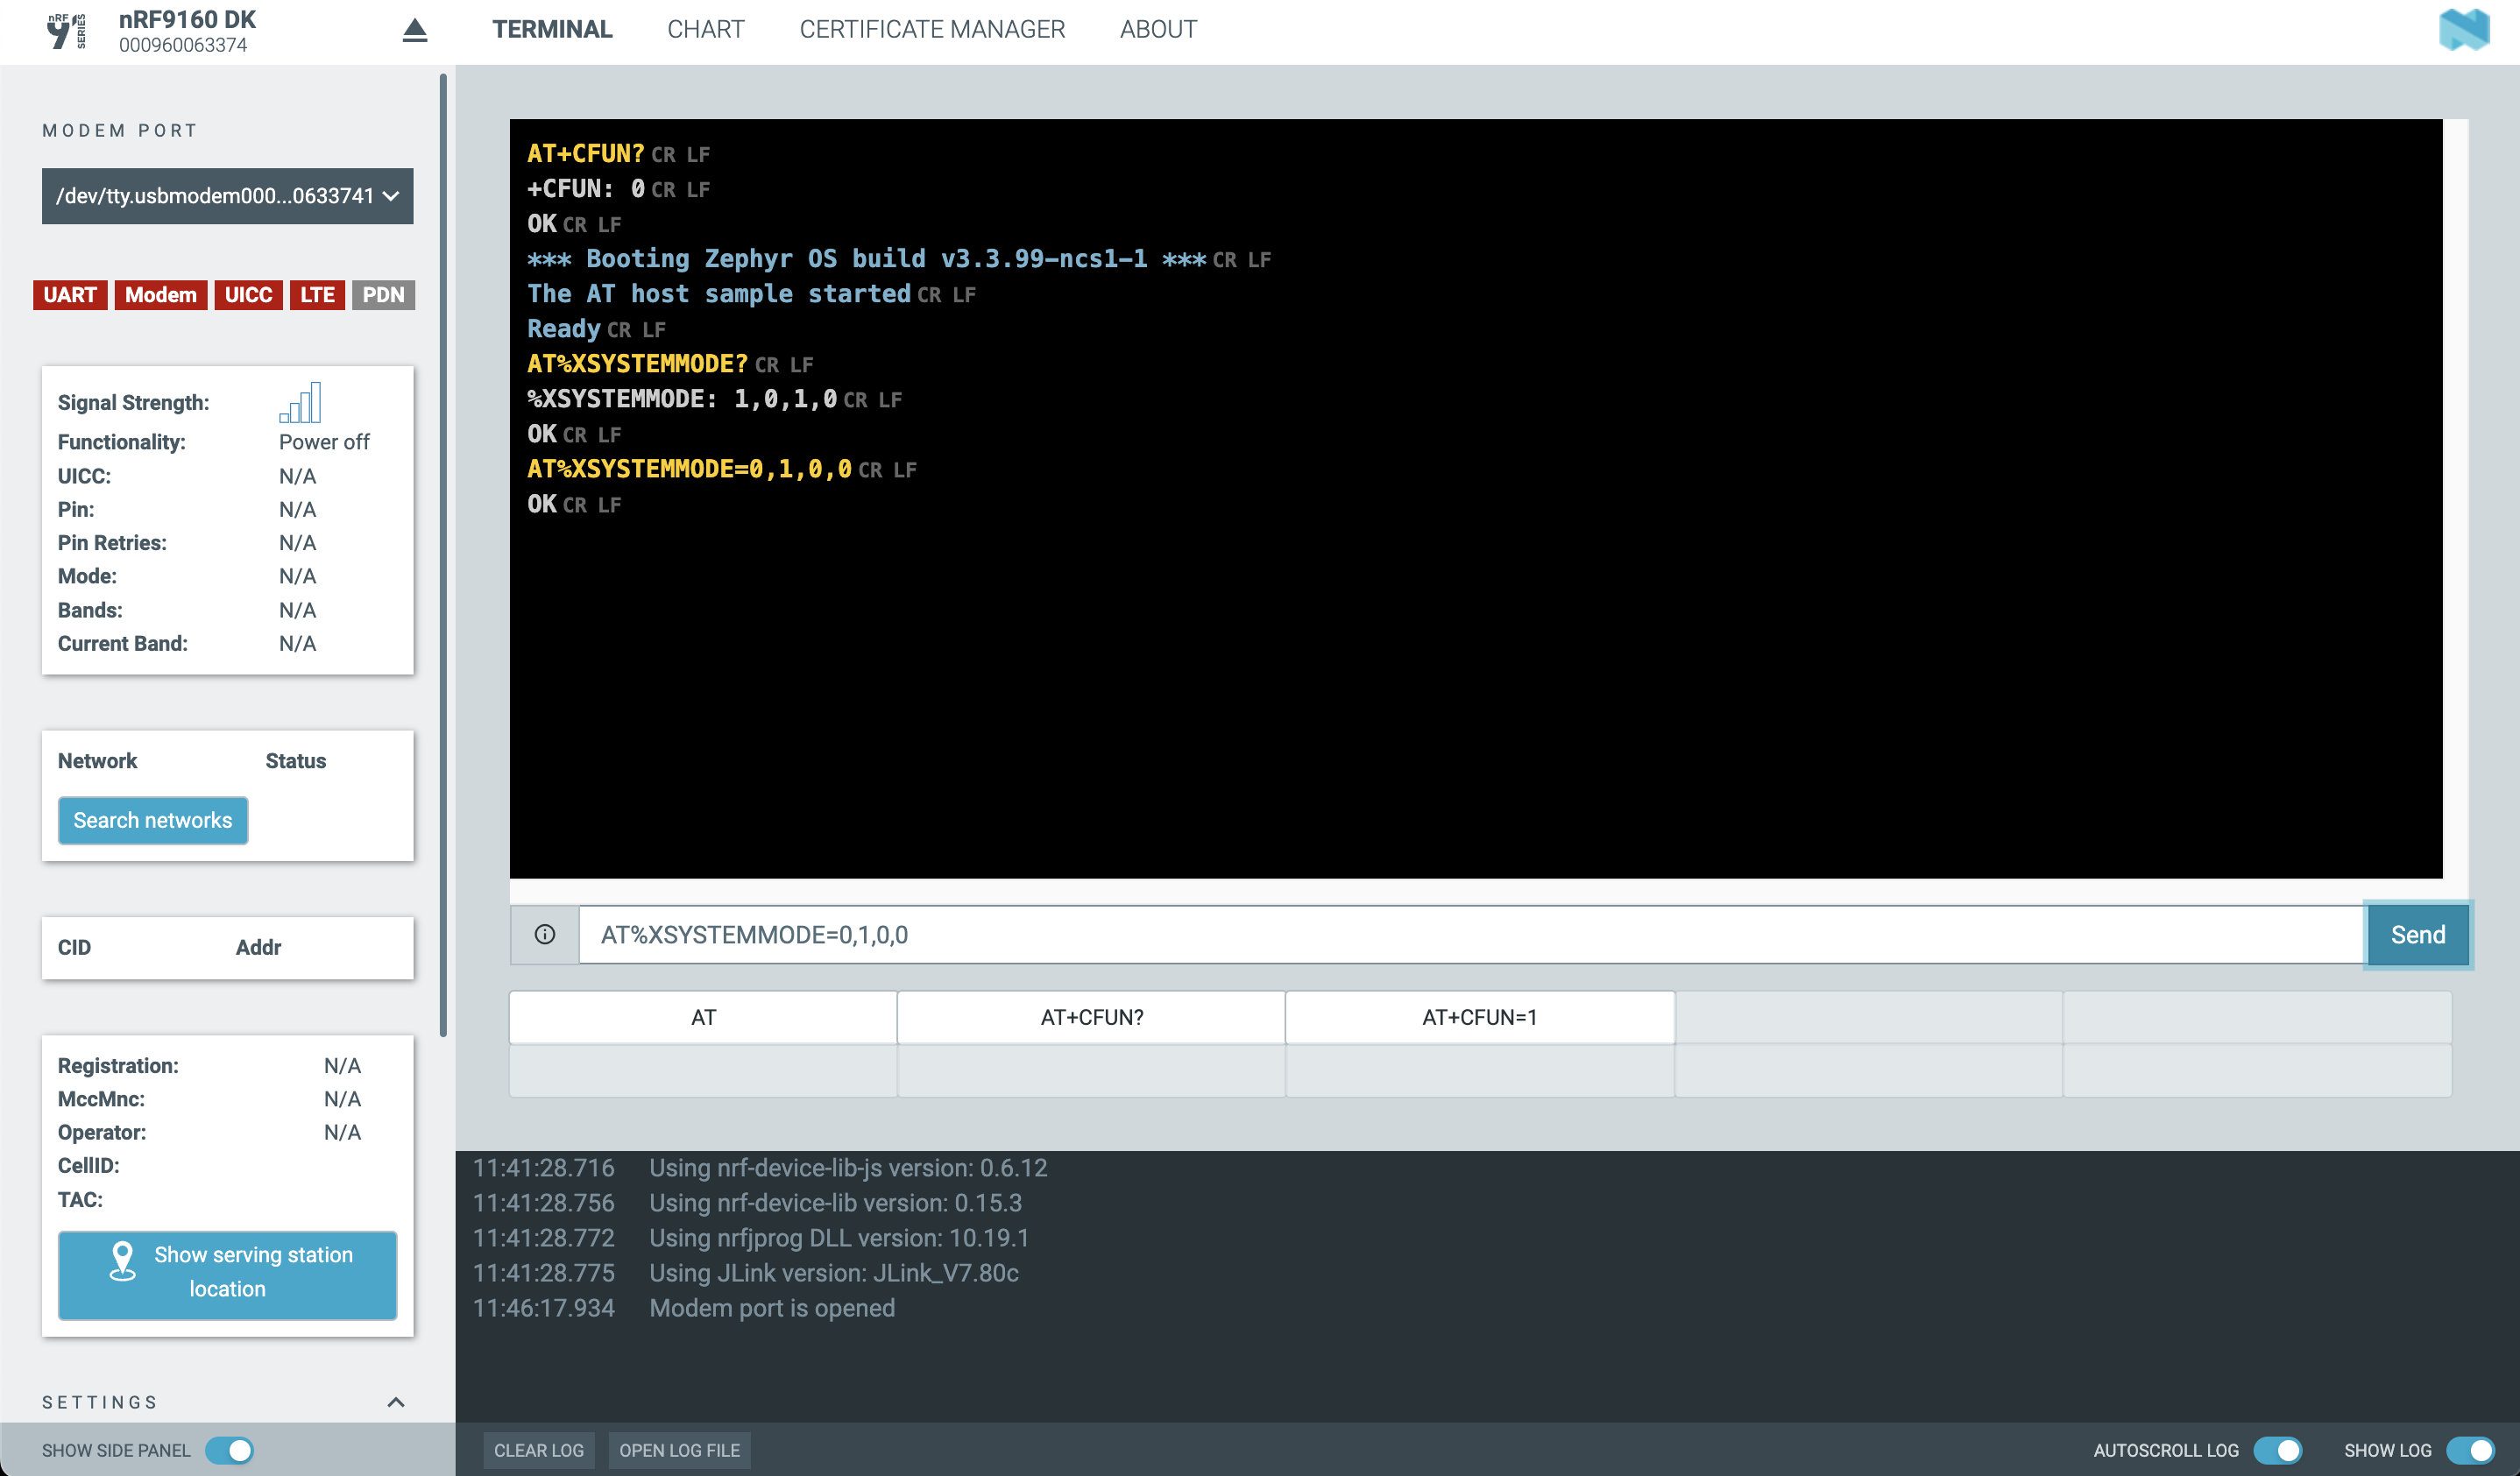
- check the modem system mode with
AT%XSYSTEMMODE?command.
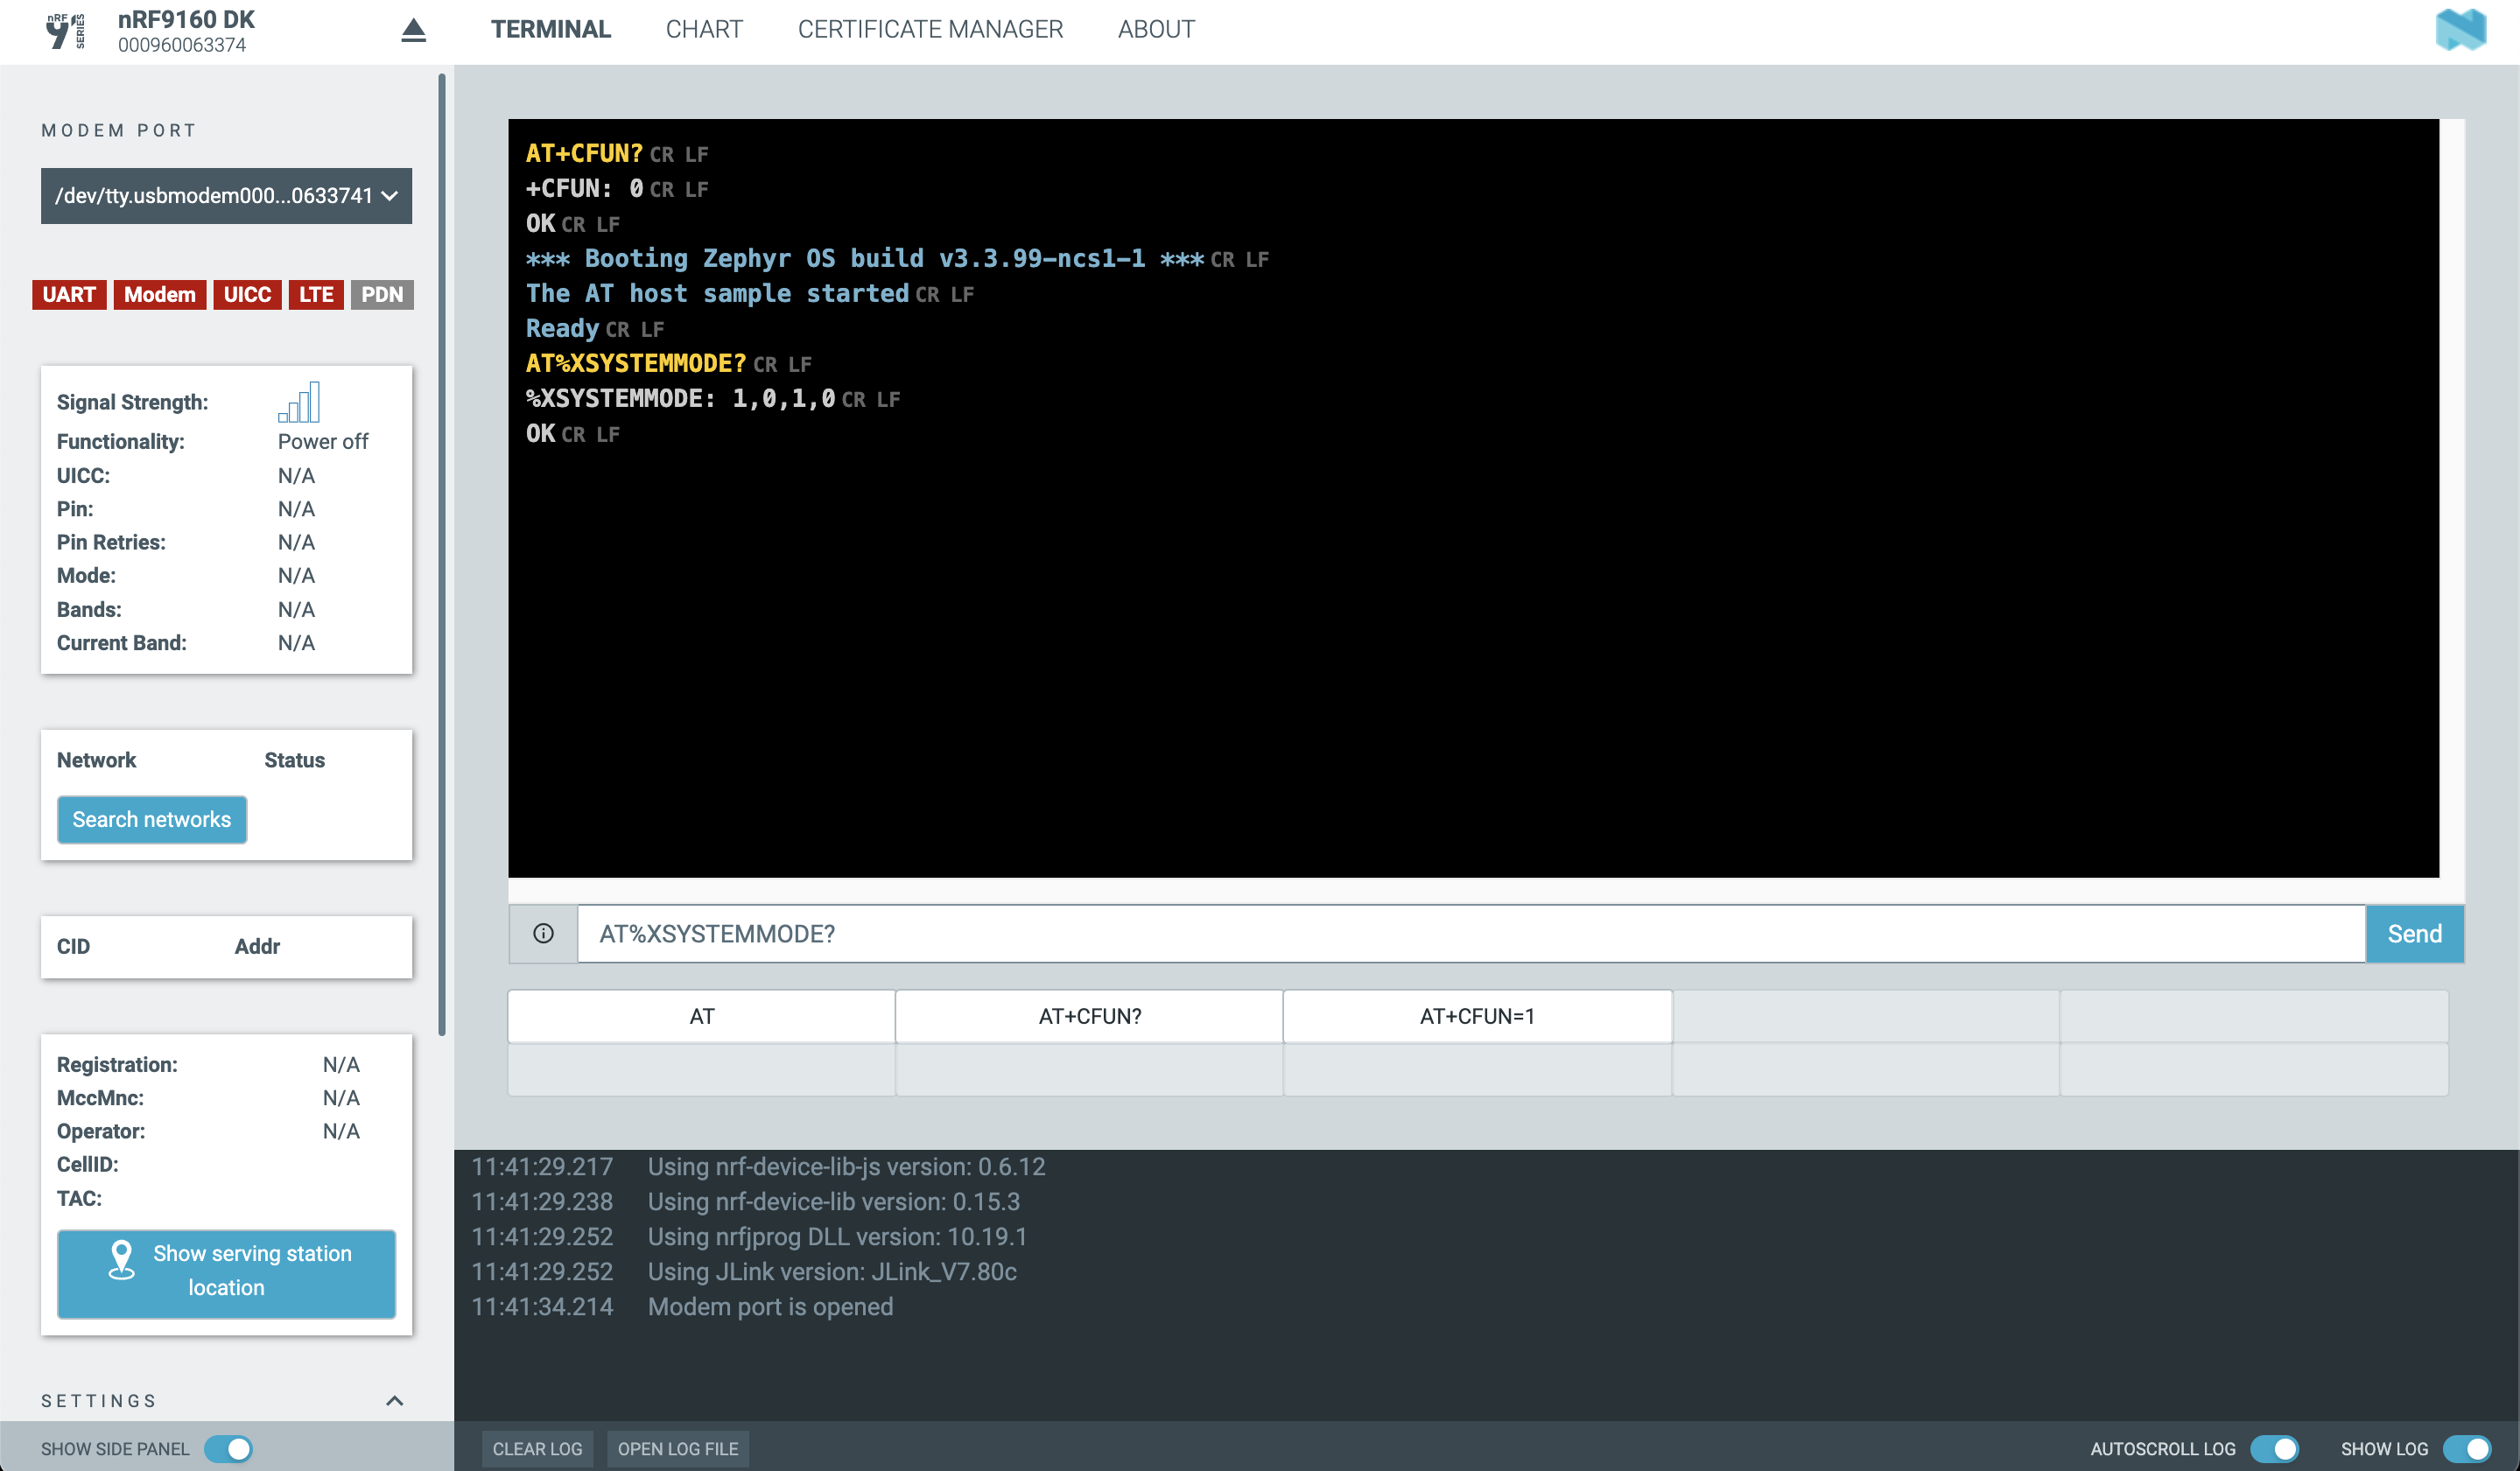
XSYSTEMMODE AT command is used for enabling system modes, and the command response syntax is:
%XSYSTEMMODE: <LTE_M_support>,<NB_IoT_support>,<GNSS_support>,<LTE_preference>.
The response we got was: 1,0,1,0, which means our device is set for LTE-M and GNSS support.
Now, let’s change it to NB-IoT.
- Send
AT%XSYSTEMMODE=0,1,0,0,
- Send
AT+CFUN=1to set the device to full functionality - Send
AT+CFUN?
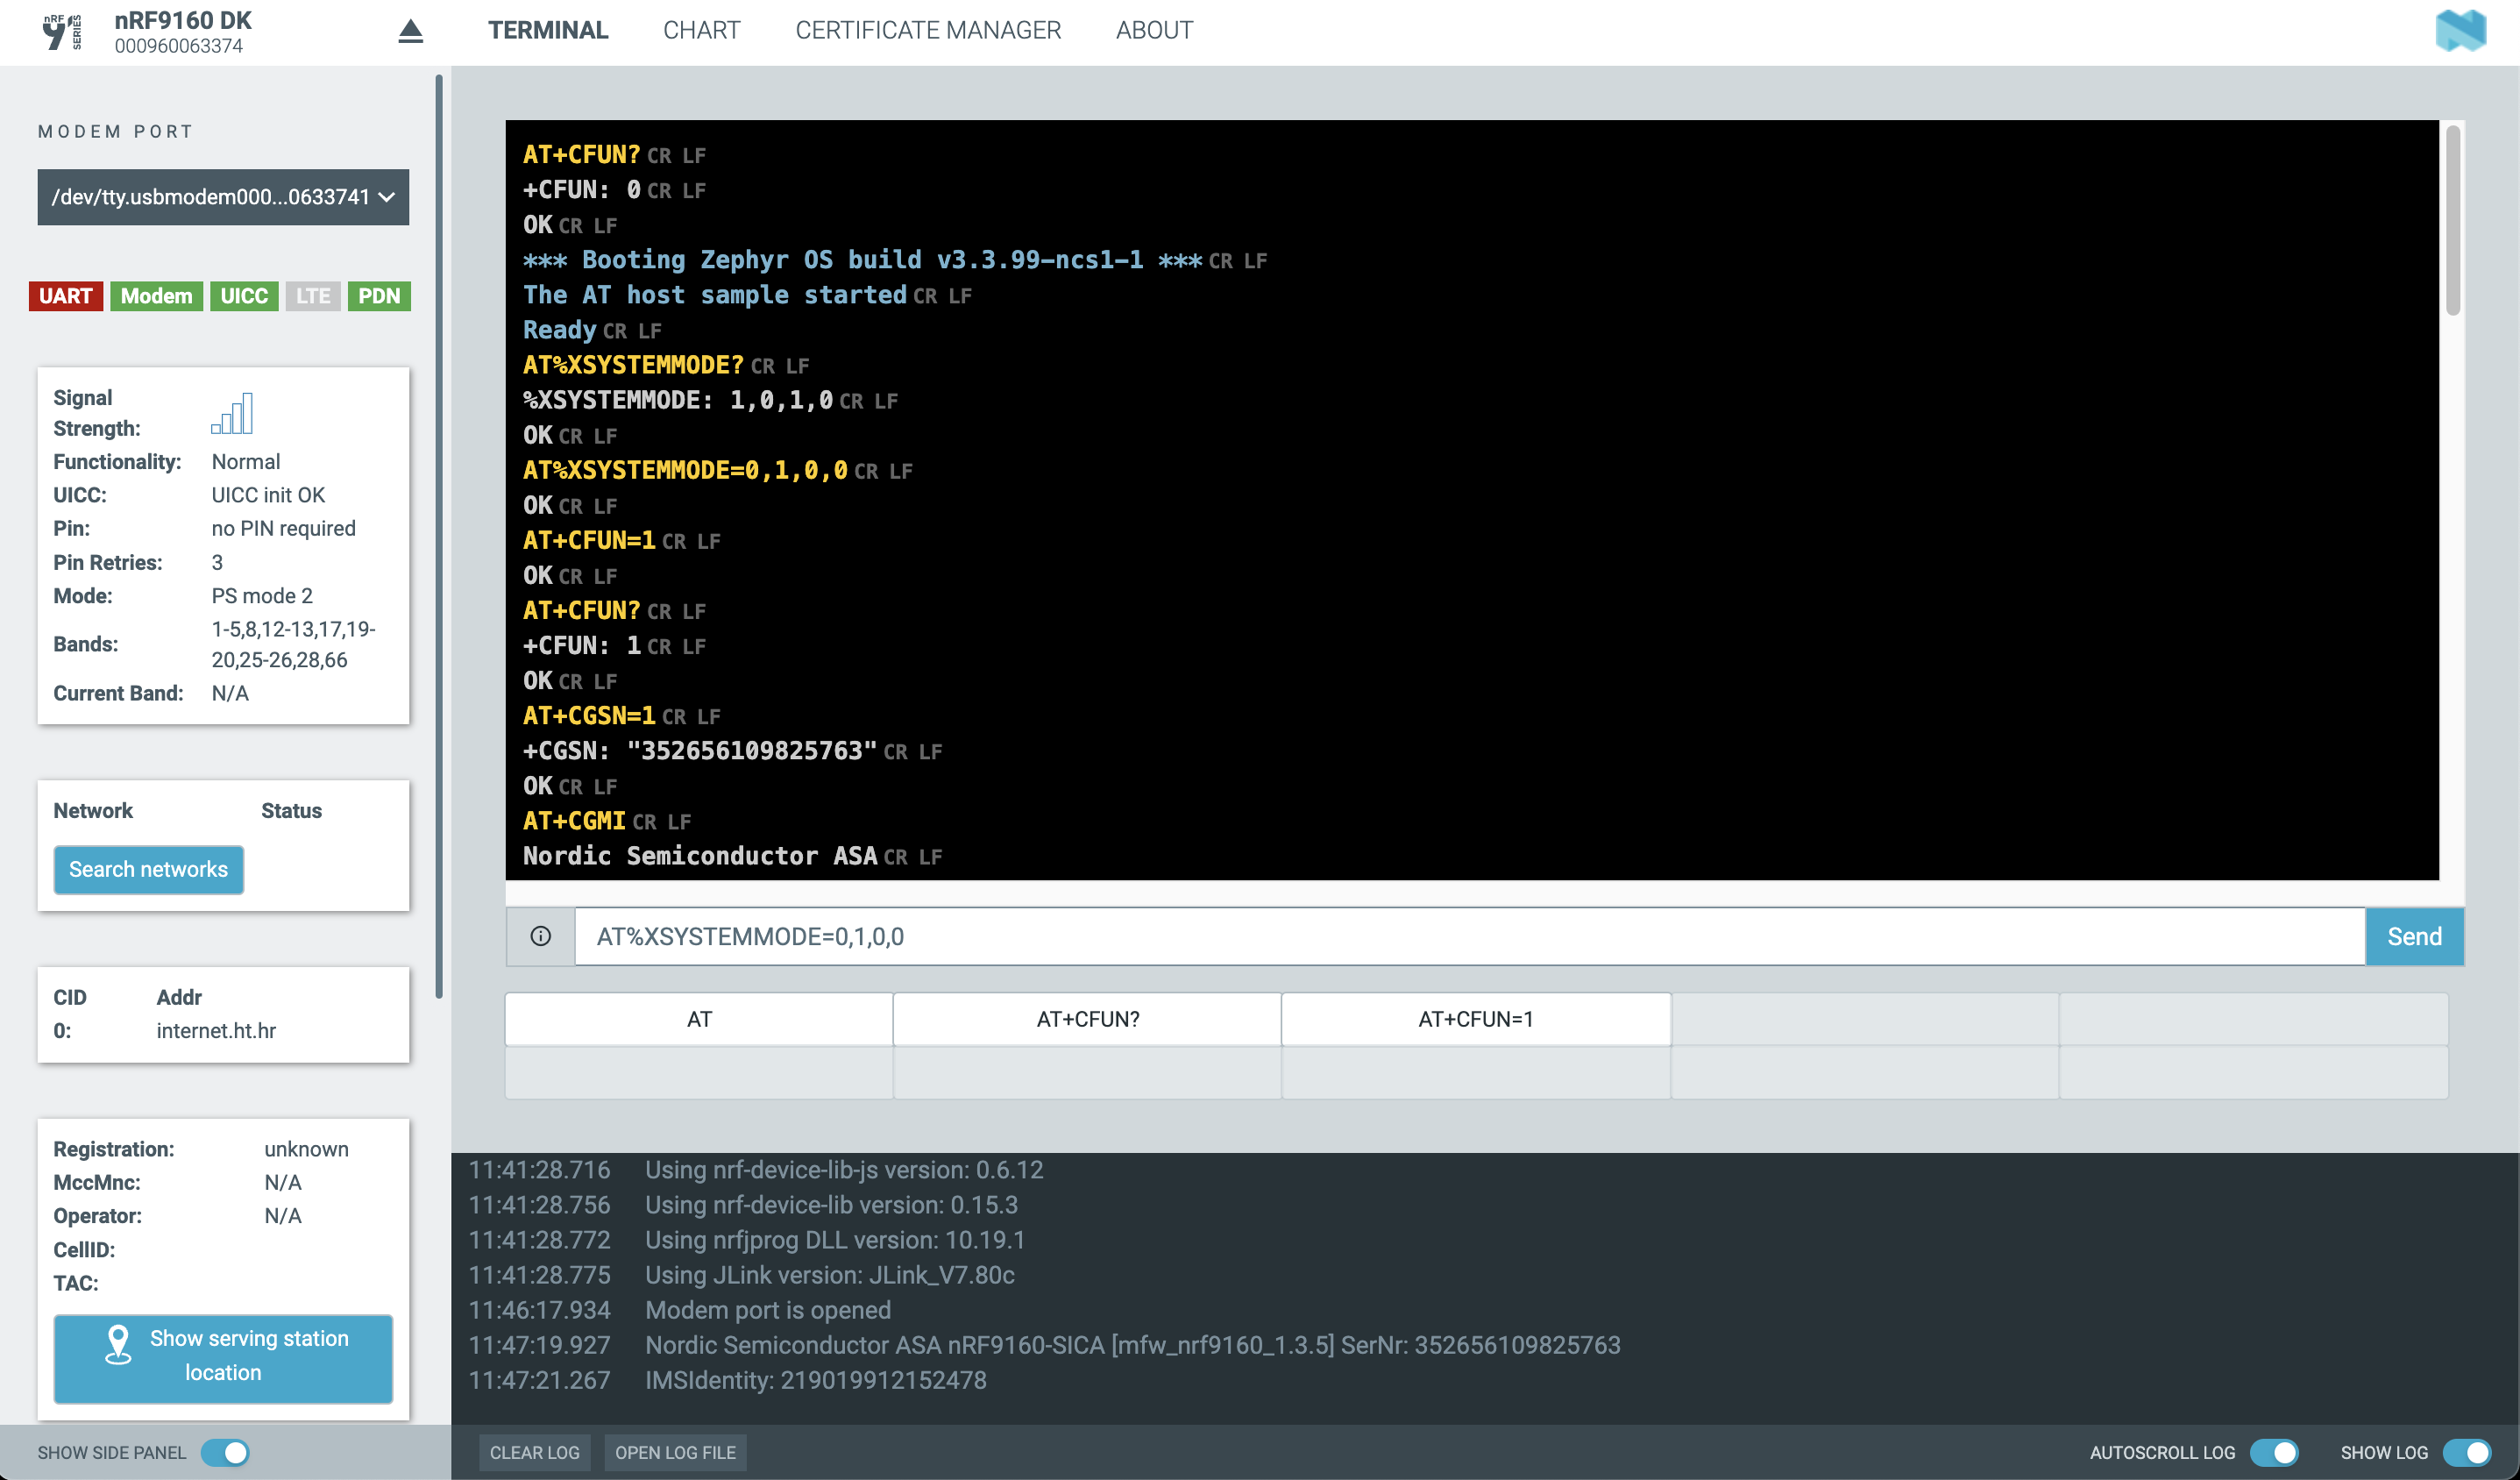
After sending the AT+CFUN? command, the nRF9160 DK has connected to the cellular network T-Hrvatski Telekom using the NB-IoT standard and has obtained an IP address 178.160.19.177.
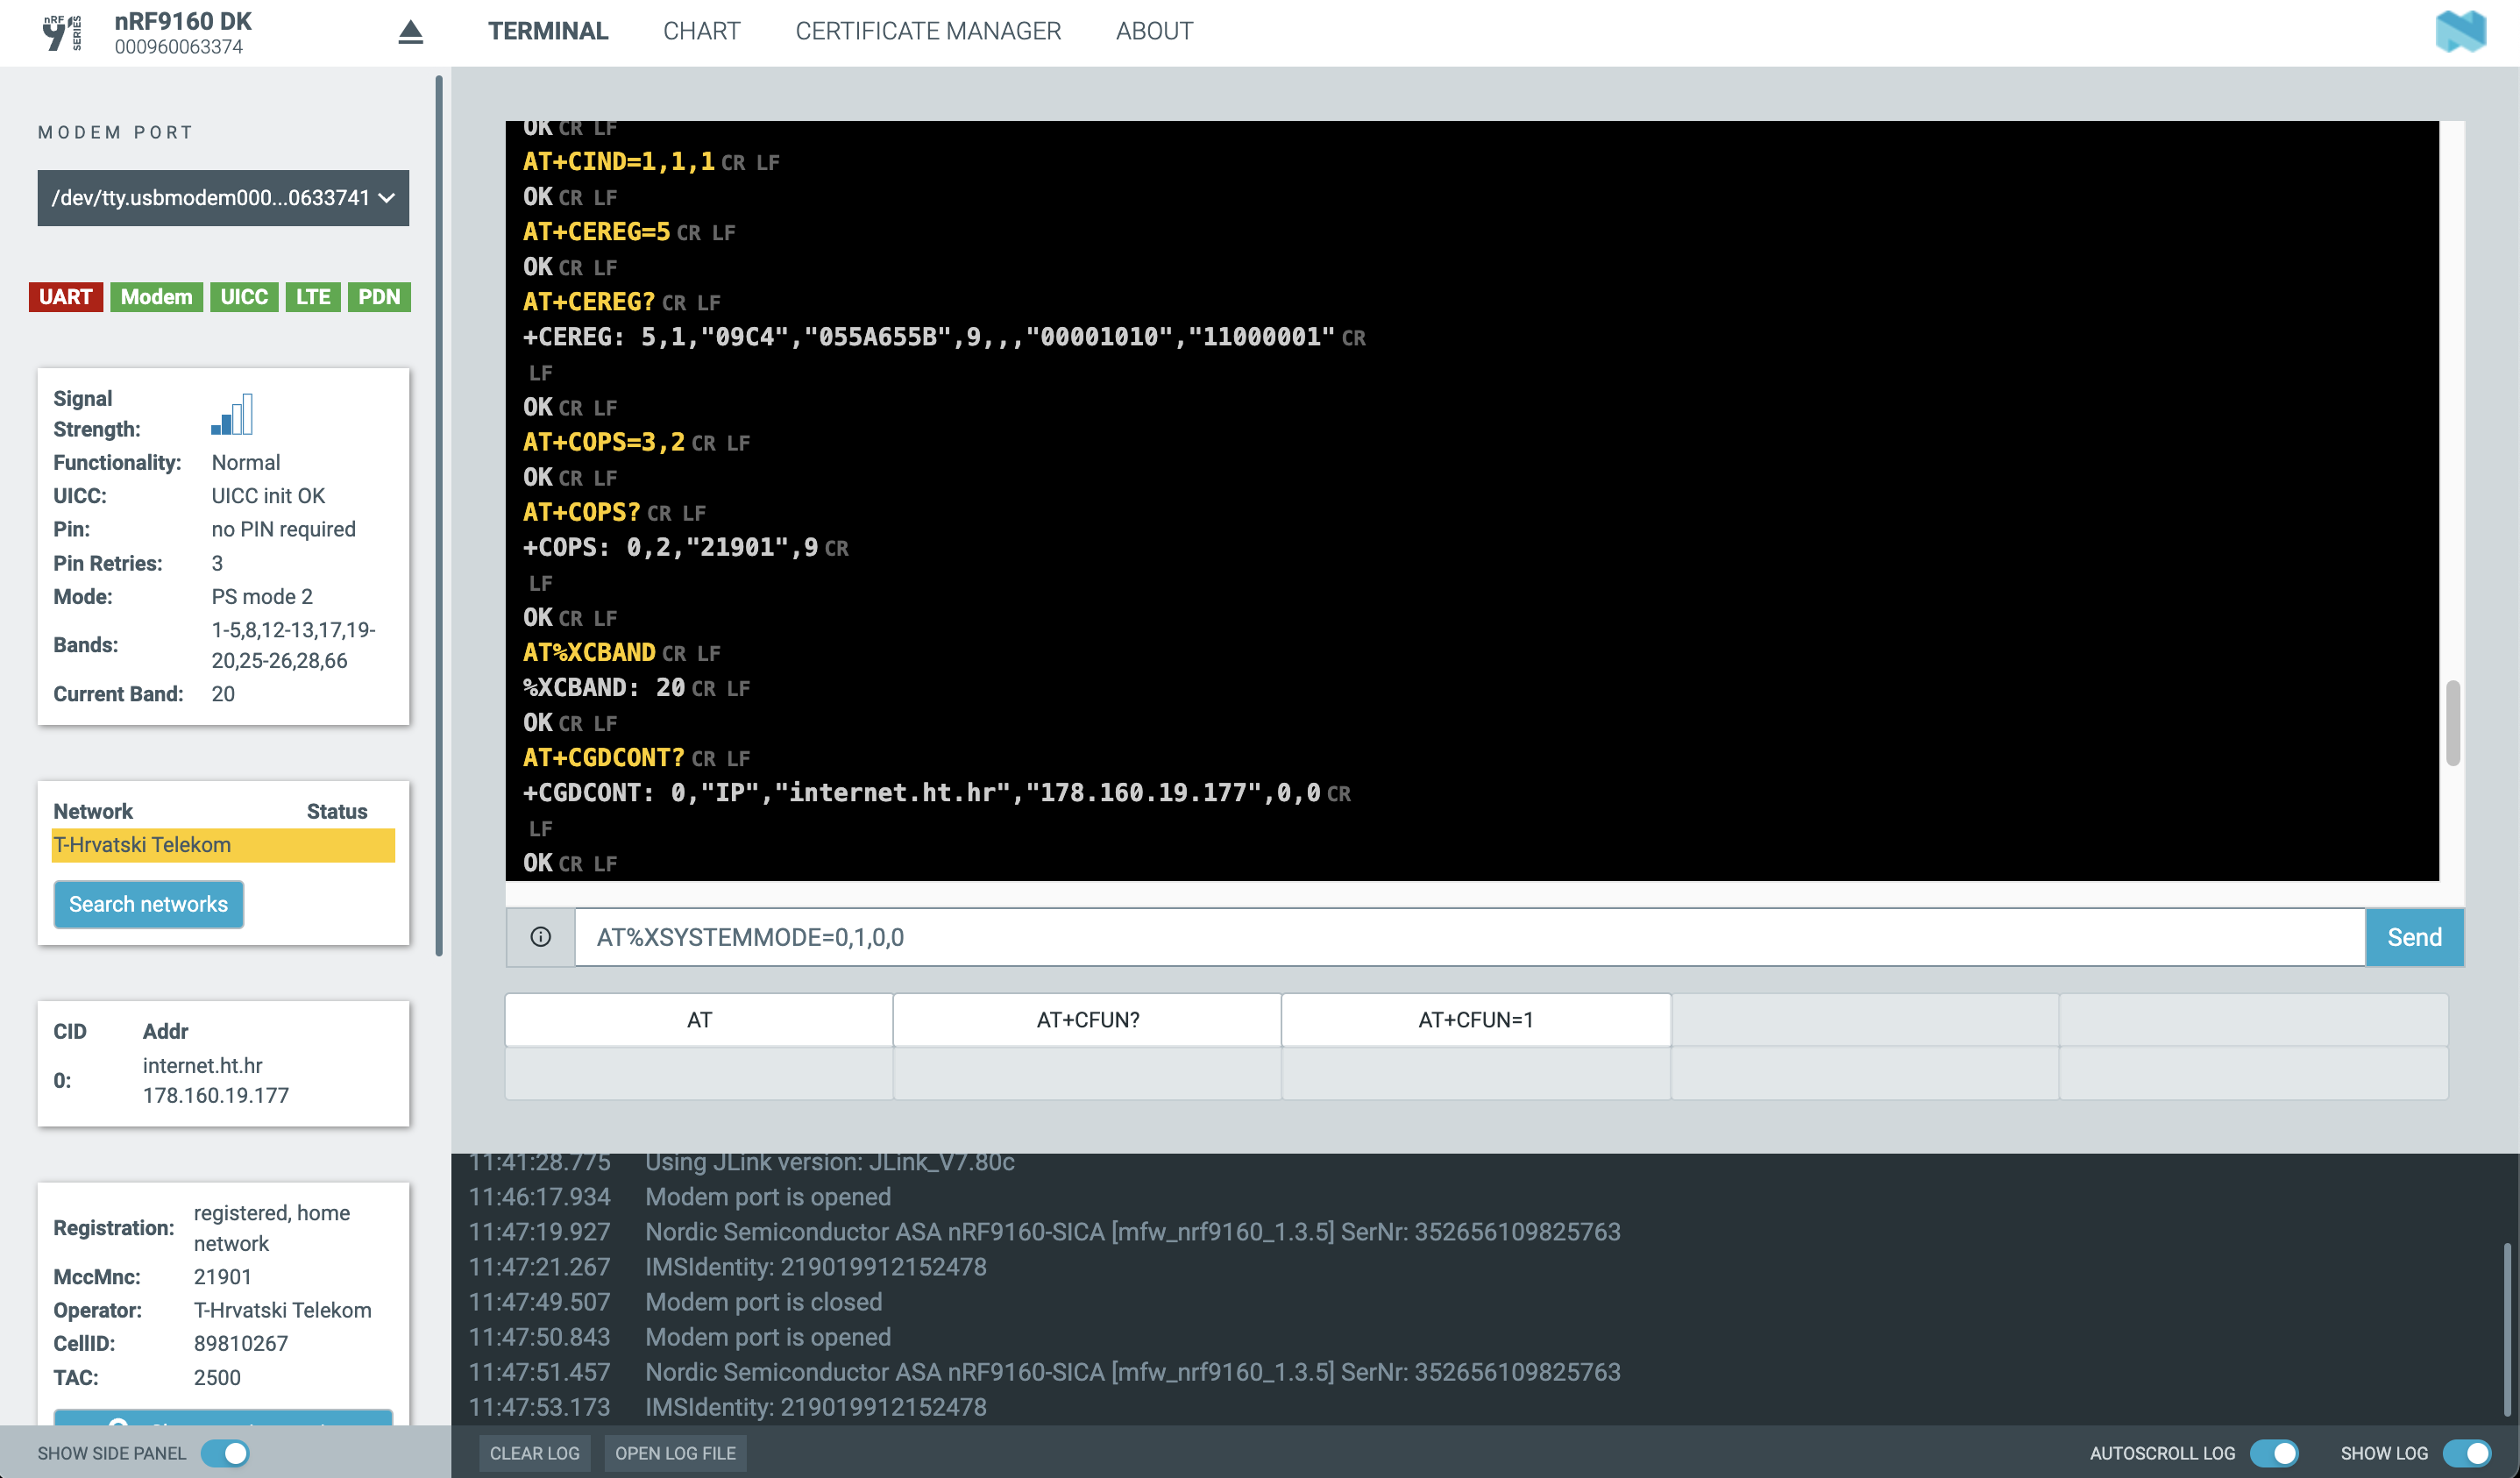
With the at_client sample, you can test and manually send all AT commands to the modem.
Cellular Monitor
Cellular Monitor is another nRF Connect for Desktop application used for capturing and analyzing modem traces to evaluate communication and view network parameters. Let’s use it with Golioth’s hello sample, which can be found at https://github.com/golioth/golioth-zephyr-sdk/tree/main/samples/hellogolioth/samples/hello.
But before we start, we need to add CONFIG_NRF_MODEM_LIB_TRACE=y to prj.conf file in the sample directory, PSK and PSK-ID as stated in the README file, build the sample, and flash the nRF9160 DK.
After that, open the Cellular Monitor Application, click the Start button in the upper left corner to capture a trace and reset the nRF9160 DK. When capturing a trace, the data is saved to the .mtrace binary file so you can view previously collected traces in the Cellular Monitor Application.
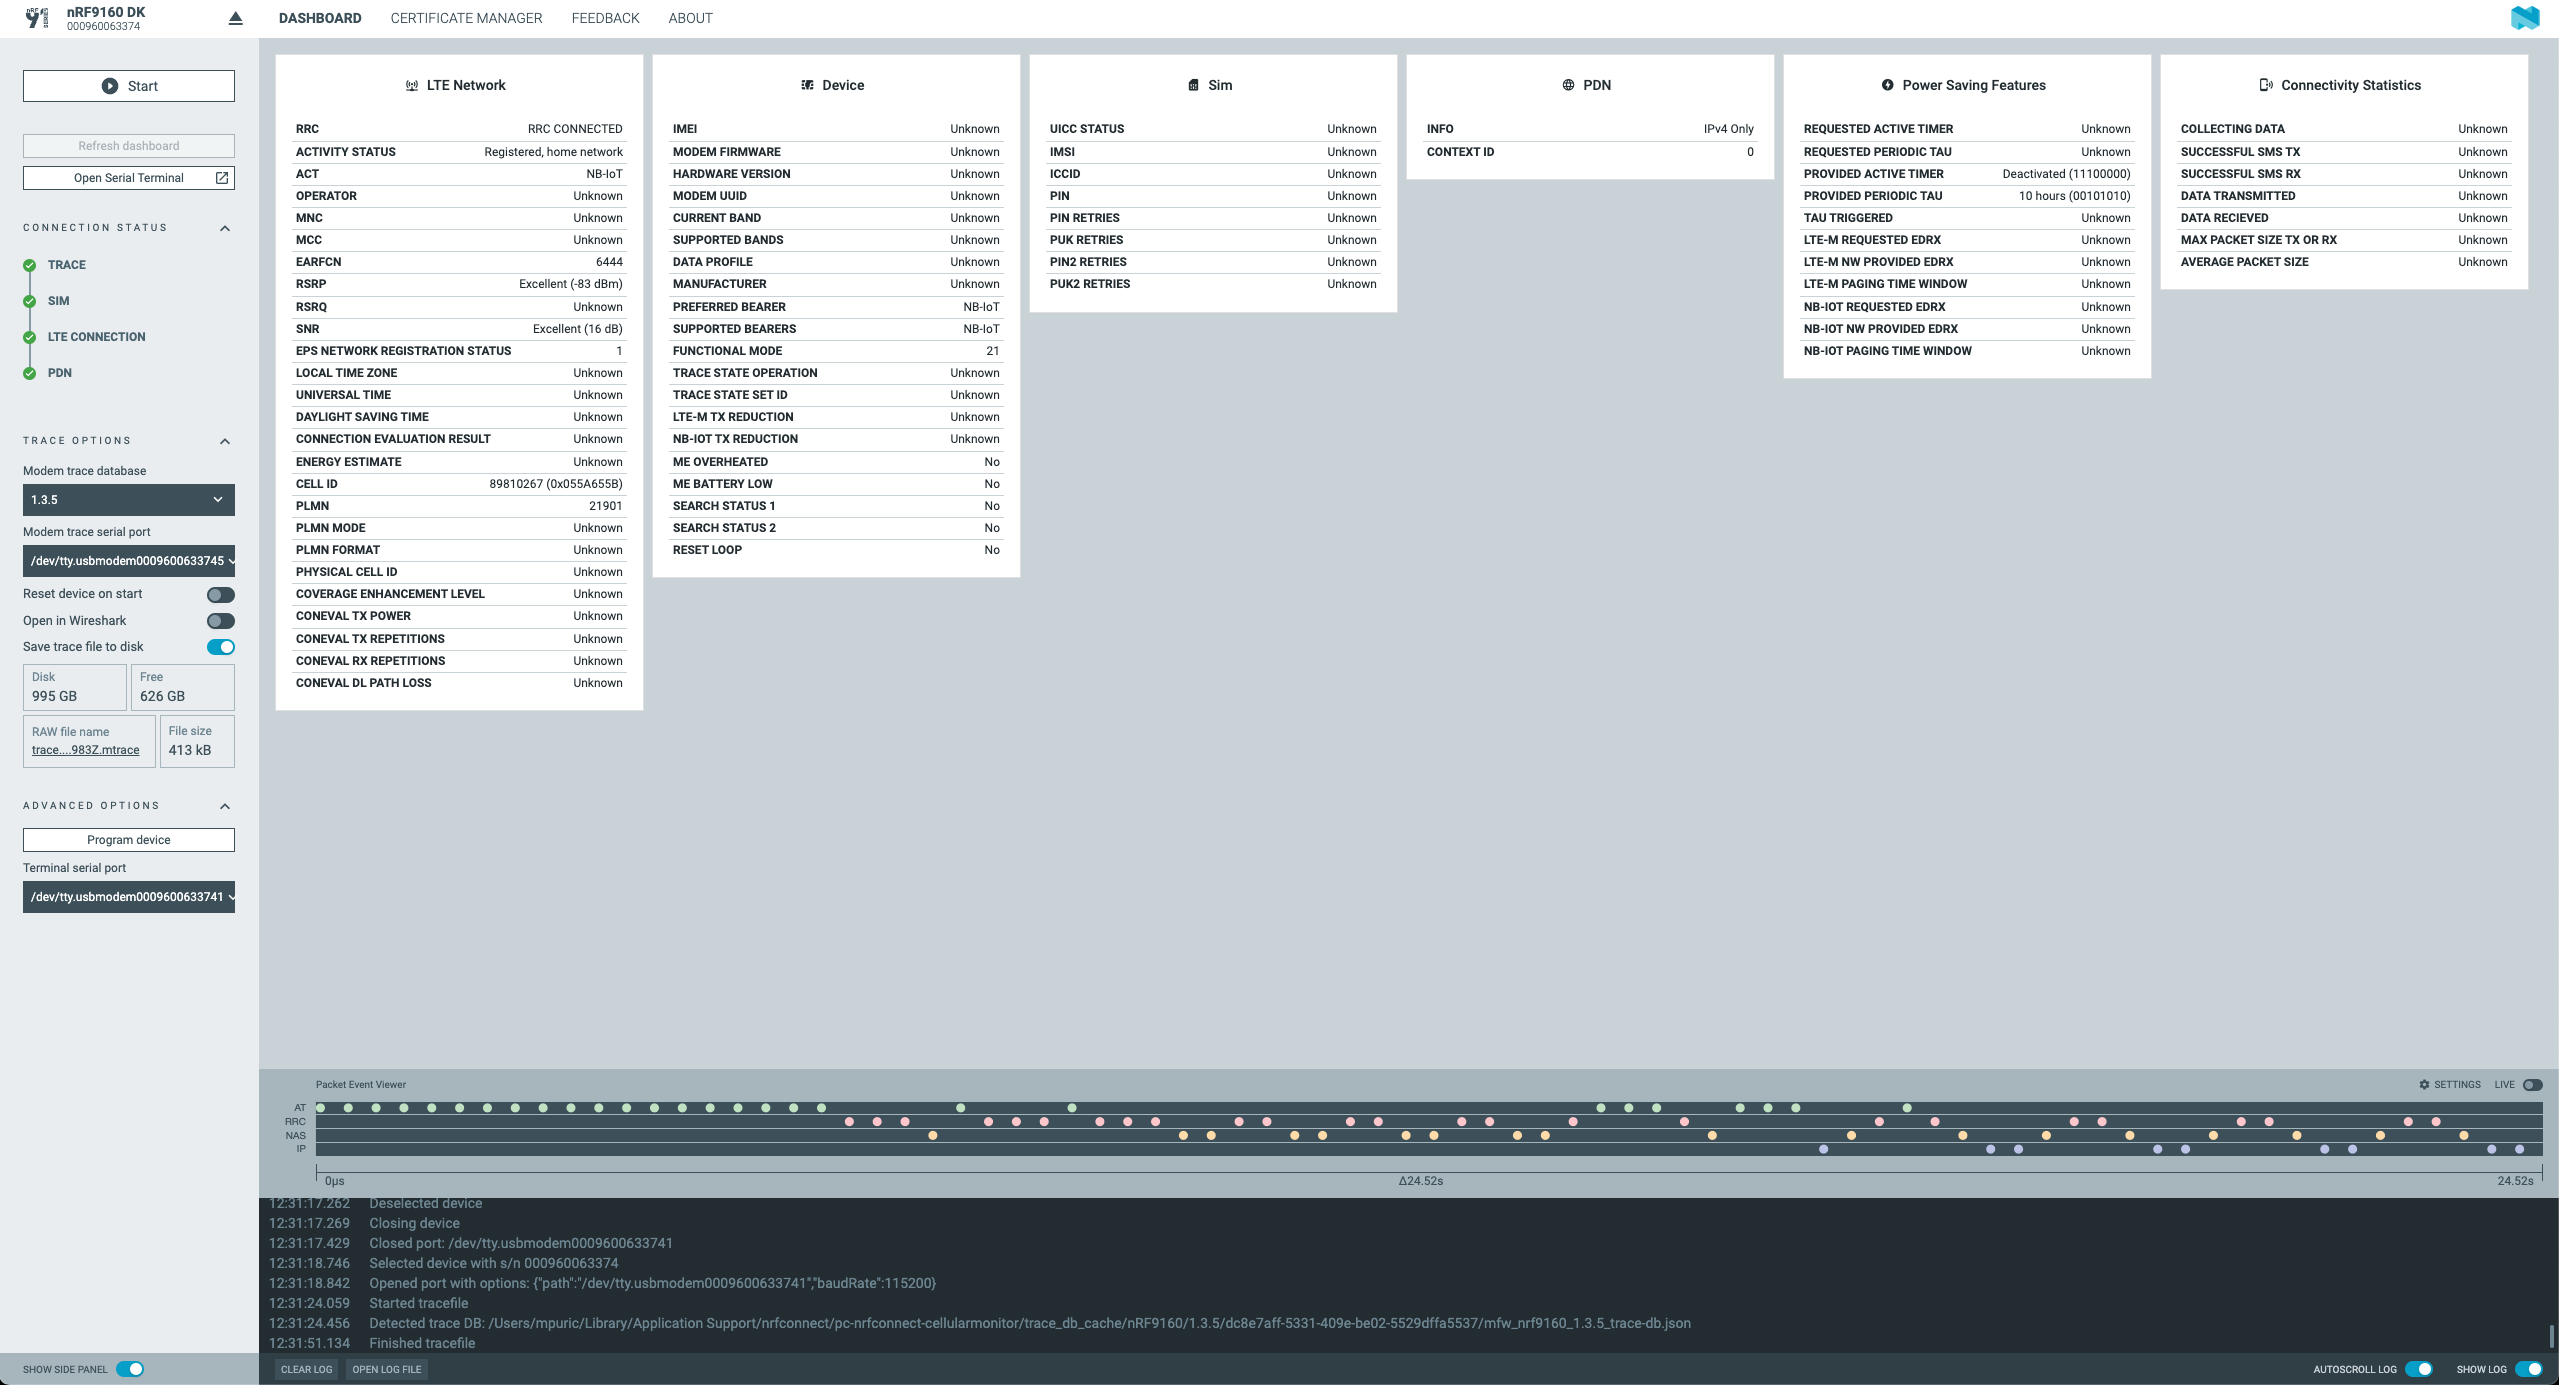
The trace data is categorized into the following 6 dashboard panels:
- LTE Network
- Device
- Power Saving Mode
- SIM
- Connectivity Statistics
- PDN (Packet Data Network)
The Packet Event Viewer visualizes communication at the AT command, Radio Resource Control (RRC), Non-access Stratum (NAS), and Internet Protocol (IP) levels.
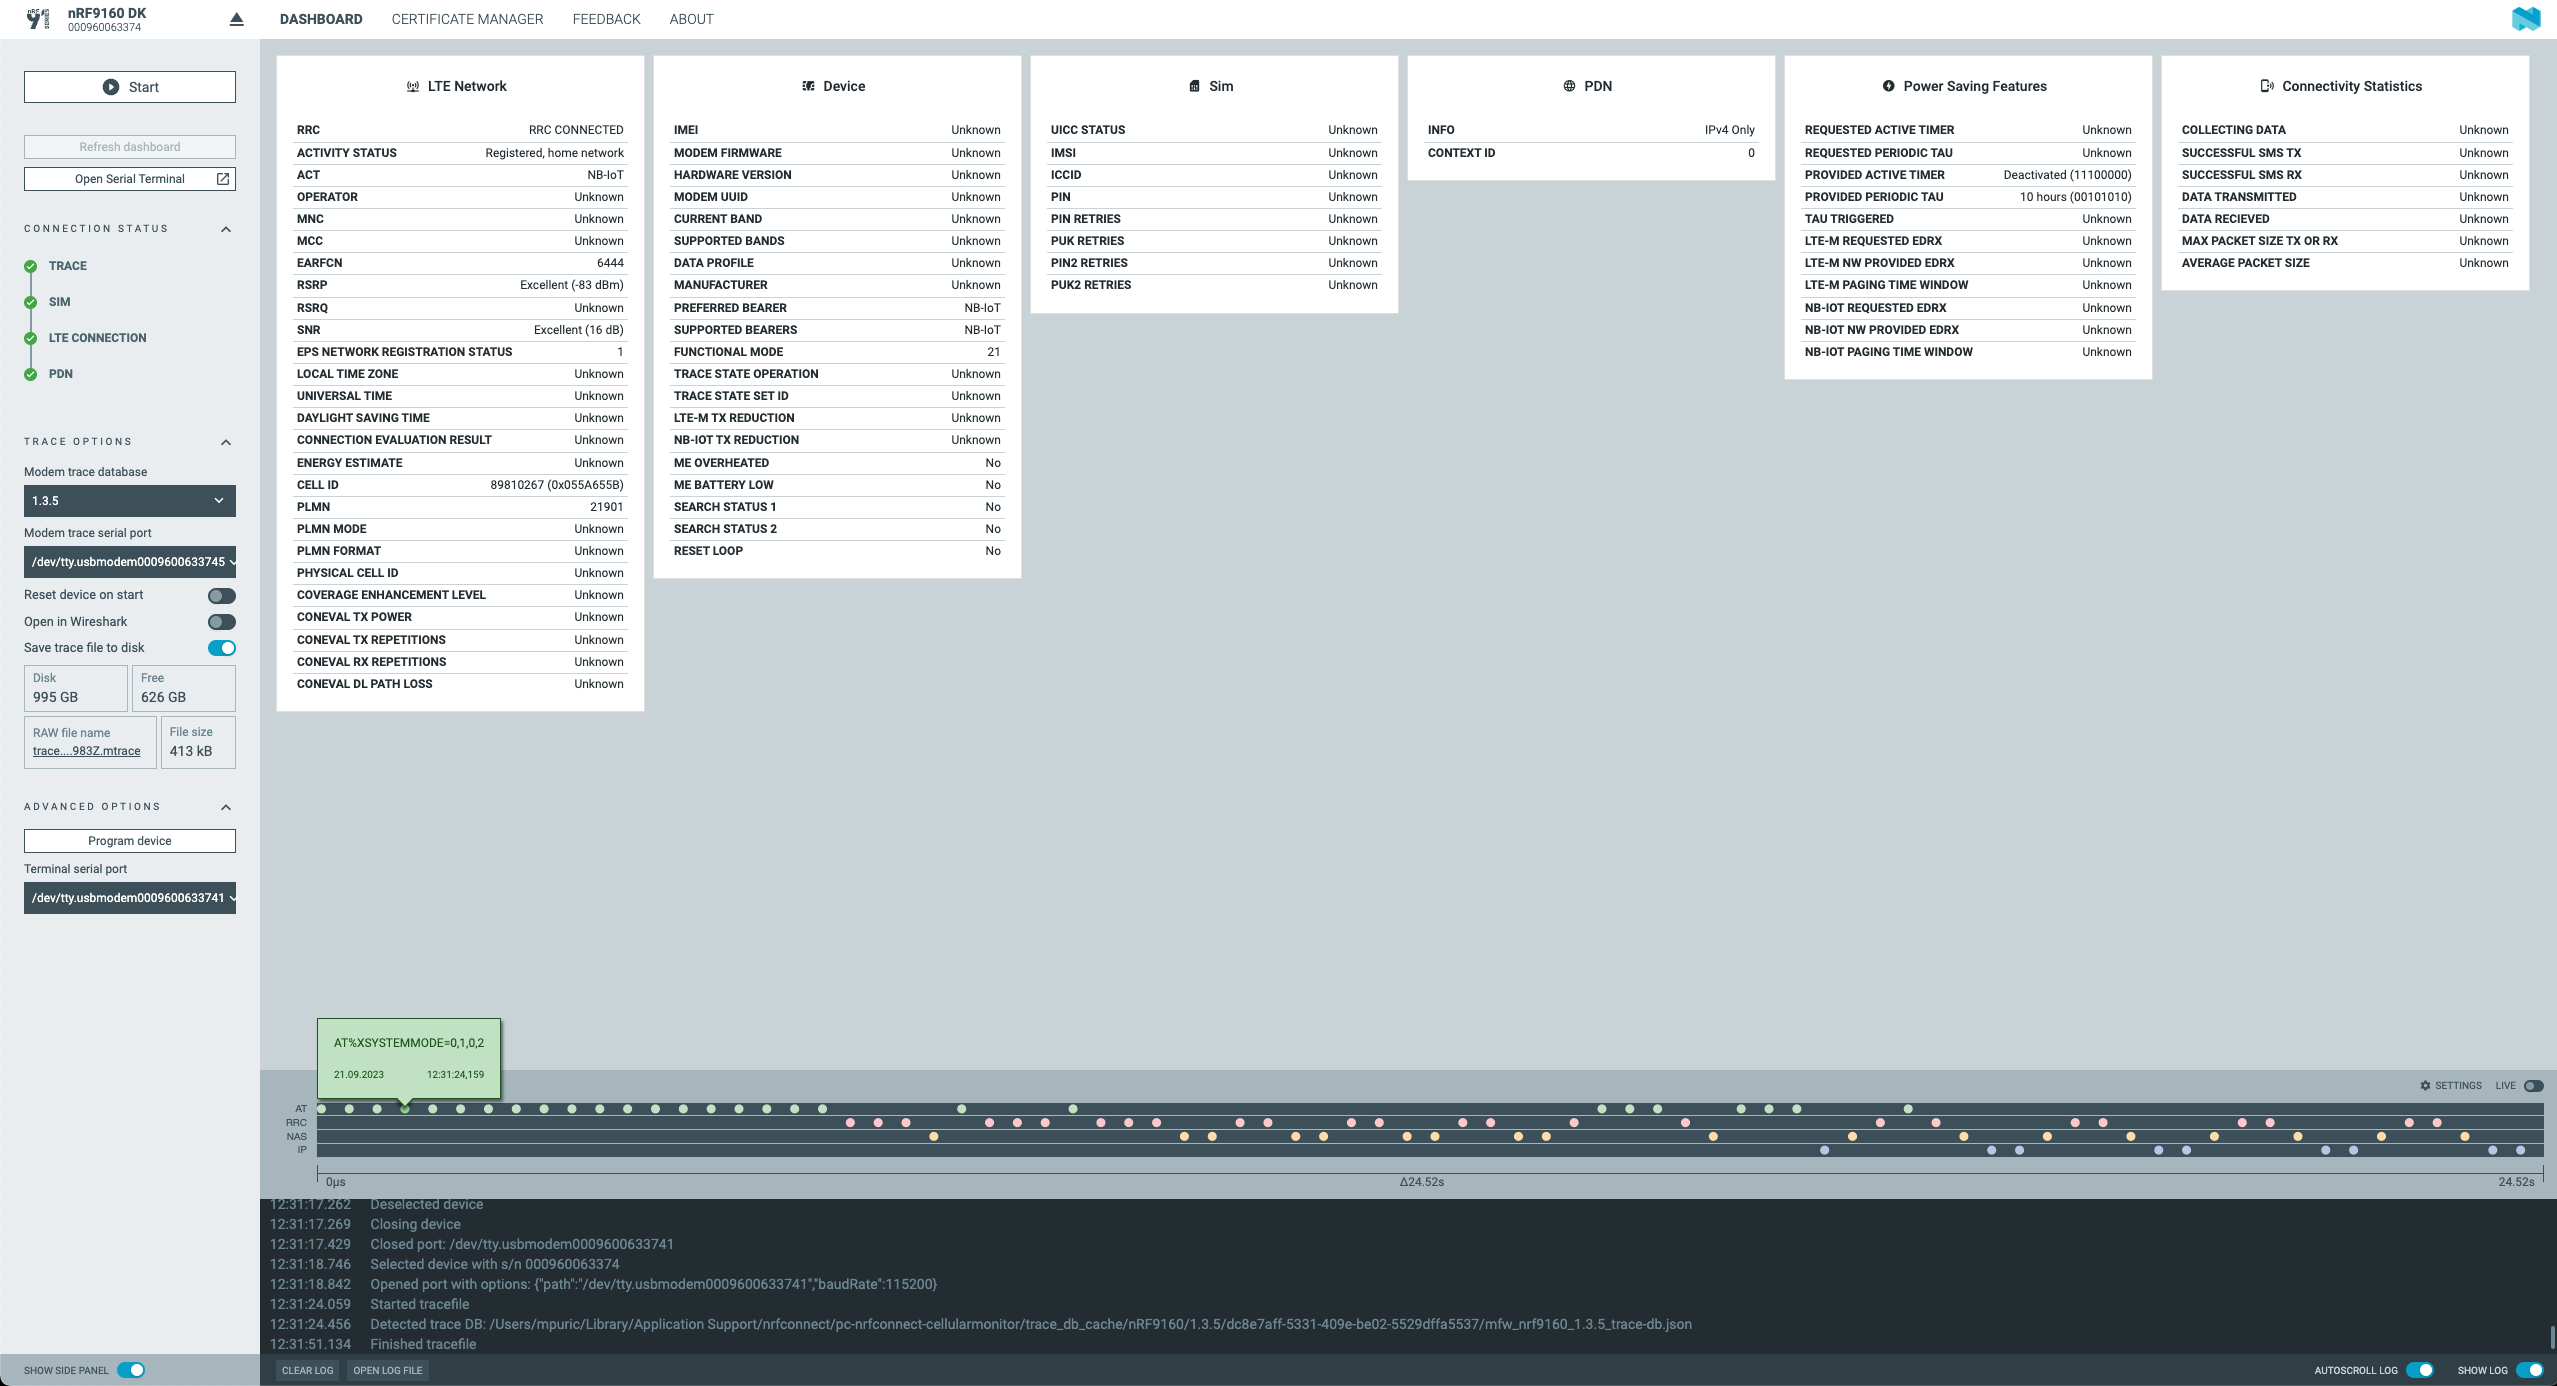
For this example, I have enabled the CONFIG_LTE_NETWORK_MODE_NBIOT symbol in the configuration file, and we can see in the Packet Event Viewer the XSYSTEMMODE AT command is sent to the modem automatically during the configuration.
Conclusion
In this demo, we have shown how to start troubleshooting Cellular Network problems with LTE Link Monitor, how to use the Cellular Monitor Application, and how the modem can be configured with Zephyr’s Kconfig Configuration System. You should consider using these tools to observe your modem configuration when it is correctly functioning. This provides much of the intuition you will need when you are called upon to troubleshoot a misbehaving cellular modem!
Want to see what happens when your device is sending and receiving data over the network? Give Golioth a try, our Zephyr SDK has a number of ready-to-use samples and your first 50 devices are free on our Dev Tier.
