Wireshark is a standard fixture for anyone who regularly works with network-based development. The open-source protocol analysis tool is pretty close to magic in its ability to not only observe data packets in transit, but to decode and decrypt the layers of information within. But how do you use Wireshark with cellular applications? Today we’ll cover the process of sniffing cellular packets with a Nordic nRF91 cellular modem.
To be clear, we’re not sniffing other people’s packets. These are our packets, from the device on our bench, streaming data over the cellular network to the Golioth servers. This is done at the device before the data goes up to the cellular tower. If you have access to rebuild your firmware with modem tracing enabled, Nordic has made a pretty smooth experience to pipe those packets out of a UART and into Wireshark. Grab your nRF9160dk and follow along!
Ladies and Gentlemen, Rebuild Your Firmware
Zephyr has a nice feature called “snippets” that groups together build system settings. Nordic has a snippet that turns on the modem trace and sends it out over UART1 (so you can still use UART0 for shell/logs/etc.).
Let’s build the Golioth Hello sample code with modem tracing enabled, then flash the new firmware to the nRF9160dk:
west build -p -b nrf9160dk/nrf9160/ns examples/zephyr/hello -S nrf91-modem-trace-uart
west flash
Want to see what this snippet does? You can peek behind the curtain in the nRF Connect SDK.
Installing software prerequisites
Our firmware is ready, but we need a bit of software in place to start sniffing those packets.
- Make sure you have Wireshark installed.
- Install Nordic’s nrfutil, then install the nrfutil trace component:
nrfutil install trace
Launch Wireshark Using nrfutil
You can use nrfutil to pipe the modem trace directly into Wireshark. Now it is possible to do this with nRF Connect for Desktop. But I live my life in the terminal so I’m happy to have the CLI option.
You need two pieces of information for this: the serial port where the modem trace is being streamed, and the location of your Wireshark binary. The nrf9160dk enumerates three serial ports, it is probably the third of those ports that you want to use, but you can always open up a serial terminal and find the port that is outputting what looks like gibberish. Here are the settings I’m using:
nrfutil trace lte --input-serialport /dev/ttyACM2 --output-wireshark /usr/bin/wireshark
Wireshark will launch and you will not see anything happening! What kind of a tutorial am I running here?!?
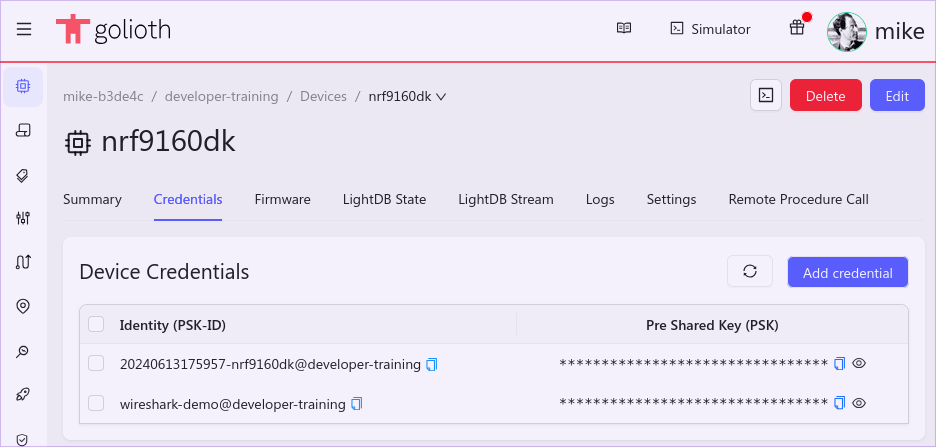
The problem is that for this particular Golioth sample, we need to provision the device before we will see any packets flowing between the device and the server. Head over to your Golioth project (free for individuals!) and get a PSK-ID and PSK to use with this device.
 Use your favorite serial terminal program to connect to the first com port of the nRF9160 (for me that’s
 minicom -D /dev/ttyACM0) and use the Zephyr console to save your credentials
settings set golioth/psk-id wireshark-demo@developer-training
settings set golioth/psk 4358d03c880c1cf6d87b455aa32ecfc1
You will be greeted with a success message in the terminal and you should now see packets streaming into Wireshark (you left it running, right?).
[00:06:24.161,773] <inf> golioth_coap_client_zephyr: Golioth CoAP client connected
[00:06:24.162,048] <inf> hello_zephyr: Sending hello! 0
[00:06:24.162,078] <inf> hello_zephyr: Golioth client connected
[00:06:24.162,109] <inf> golioth_coap_client_zephyr: Entering CoAP I/O loop
uart:~$
Sniffing Encrypted Packets, Oh My!
If you look at the packets in Wireshark, they will make almost no sense at all. That’s because Golioth is encrypted by default.
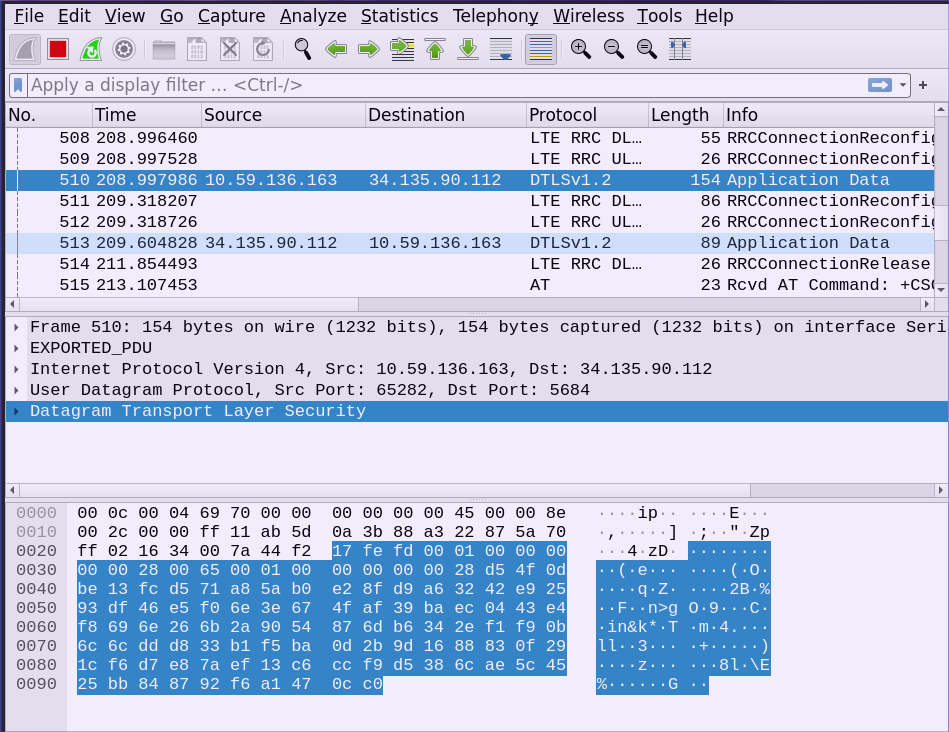 This isn’t even worth the effort you’ve put in so far… let’s go one step further and decrypt these packets. We already have the encryption key, it’s the PSK that you used in the last step to provision the device.
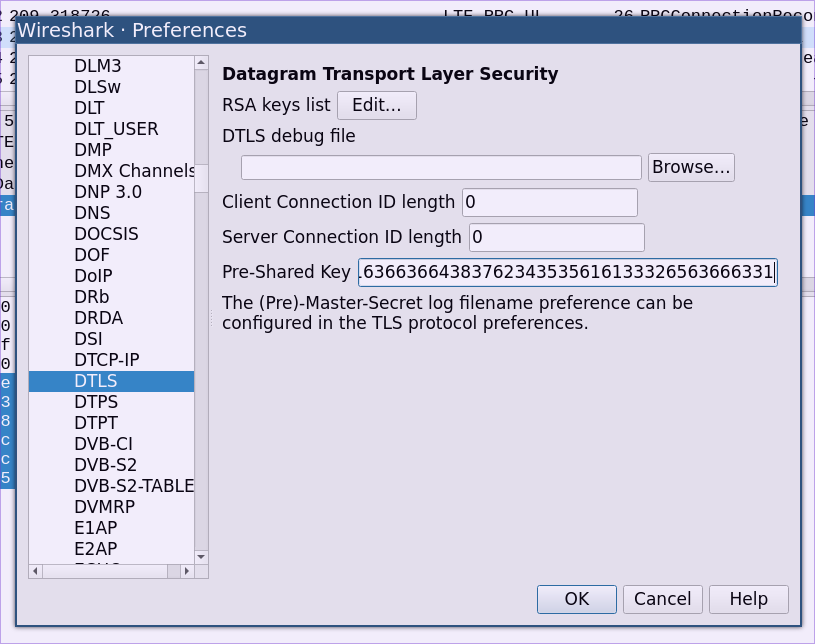
My PSK was: . Now that looks like a hex string but it’s actually just a string. We need to convert it to a hex string before giving it to Wireshark. You may want to use an online string to hex converter, but my tinfoil hat and I don’t like to paste my encryption keys into webpages so I’m going to use the command line:
$ echo "4358d03c880c1cf6d87b455aa32ecfc1" | tr -d '\n' | xxd -ps -c 200
3433353864303363383830633163663664383762343535616133326563666331
Copy the output and head over to Wireshark.
- Select
Edit→Preferences. - Click the arrow to the left of
Protocolsto unfold that menu. - Scroll waaaaaay down to
DTLSand click on it. - Paste your converted PSK into the
Pre-Shared Keyfield. - Click
OKto close the dialog
 We immediately see a change in the packet we were already viewing. Now that the DTLS packets can be decoded, Wireshark has recognized a CoAP packet and decoded relevant details like message ID, token, and options.
(Note: if you don’t see your packets getting decoded, Wireshark might have missed the original handshake with the server. Try rebooting your device in the serial console with kernel reboot.)
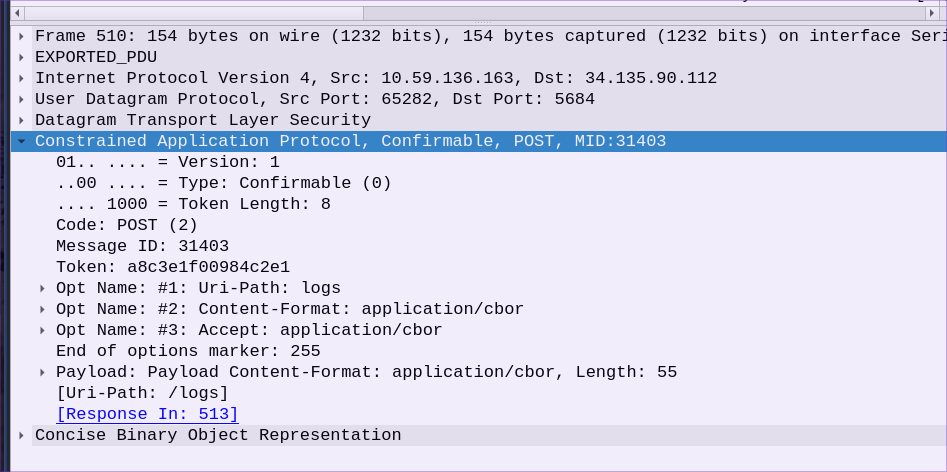 You can see that the Content-Format is listed as
 application/cbor. This is not human-readable (unless you’re Dan from Golioth who has an uncanny ability to decode protocols in his head). But luckily Wireshark also knows how to decode CBOR, so if we unfold the bottom line we can get at the original data sent by the device.
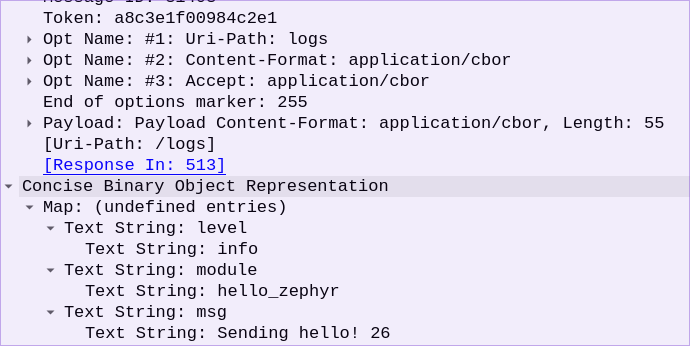 Now we can tell what this packet was doing! From the
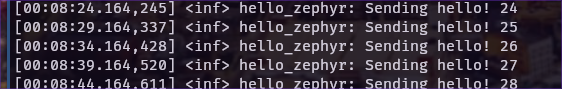
 Uri-Path in the CoAP packet we see its was being sent to /logs. Inside the CBOR packet we see the log level, the module that sent the log, and the logging message itself. If you look back in your terminal output you’ll see the log message that caused this packet to be automatically sent to Golioth!
Beyond the tower
We are looking at the data coming out of the device using the modem trace. But what happens after that? As we have written about before, it can be very difficult to understand what’s happening to your packet once it gets to the tower. Some carriers, like our partner Onomondo, offer similar capabilities on their data backend. In the case of Onomondo, they have a Traffic Monitor and Network Logs that similarly allows you to see data flowing through their system.
We Sniff a Lot of Packets so You (Usually) Don’t Have To
Golioth spends a lot of time making sure IoT devices can connect to the cloud with the greatest of ease. We are very comfortable with Wireshark because we are continually testing and improving the performance of communications between hardware in the field and the cloud servers they attach to.
While it’s good to know you can sniff your own cellular packets. It’s even better to know you that when you build with Golioth, you won’t have to.

No comments yet! Start the discussion at forum.golioth.io