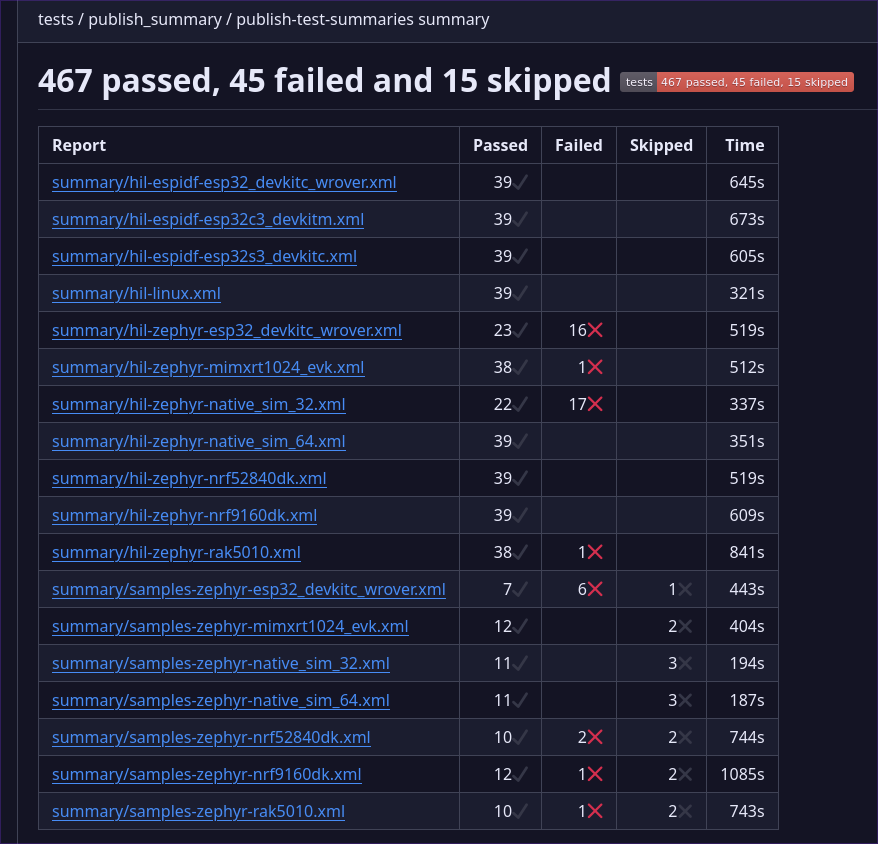
Automated testing is core to maintaining a stable codebase. But running the tests isn’t enough. You also need to get useful information from the outcome. The Golioth Firmware SDK is now running 530 tests for each PR/merge, and recently we added a summary to the GitHub action that helps to quickly review and discover the cause of failures. This uses a combination of pytest (with or without Zephyr’s twister test runner), some Linux command line magic, and an off-the-shelf GitHub summary Action.
Why summaries are helpful

From this summary you can pretty quickly figure out if failures are grouped around a particular type of hardware, or across the board. Clicking the name of a dev board jumps to another table summarizing the outcomes.

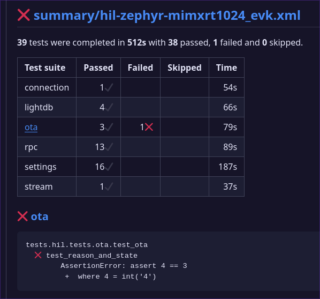
Reviewing the summary for the mimxrt1024_evk board, we can see that six test suites were run, with one test in the “ota” suite failing. Clicking that test suite name jumps to the block under the table that shows the error. In this case, we test all possible OTA reason and state codes the device can send to the server. This test failed because there is a latency issue between the device sending the code and the test reading it from the server.
While this doesn’t show everything you might want to know, it’s enough to decide if you need to dig further or if this is just a fleeting issue.
It’s worth noting that we also use Allure Reports (here is the latest for our main branch) to track our automated tests. This provides quite a bit more information, like historic pass/fail reporting. I’ll write a future post to cover how we added those reports to our CI.
Generating test summaries
Today we’re discussing test summaries using JUnit XML reports. Pytest already includes report generation for JUnit XML which makes it a snap to add to your existing tests. Browsing through pytest --help we see a simple flag will generate the report.
--junit-xml=path      Create junit-xml style report file at given path
--junit-prefix=str    Prepend prefix to classnames in junit-xml output
For our testing, we simply added a name for the summary file. Here’s an example using pytest directly:
pytest --rootdir . tests/hil/tests/$test      \
  --some-other-flags-here                     \
  --junitxml=summary/hil-linux-${test}.xml
If you use Zephyr, running twister with pytest already automatically produces JUnit XML formatted test reports at twister-out/twister_suite_report.xml.
Gathering and post-processing reports
Gathering up Twister-generated reports is pretty easy since Twister already batches reports into suites that are uniquely named by test. Since we’re running matrix tests, we give the files a unique name and store them in a summary/ folder in order to use the artifact-upload action later.
- name: Prepare CI report summary
  if: always()
  run: |
    rm -rf summary
    mkdir summary
    cp twister-out/twister_suite_report.xml summary/samples-zephyr-${{ inputs.hil_board }}.xml
On the other hand, the integration tests we run using pytest directly require a bit more post-processing. Since those generate individual suites, a bit of xml hacking is necessary to group them by the board used in the test run.
- name: Prepare summary
  if: always()
  shell: bash
  run: |
    sudo apt install -y xml-twig-tools
    xml_grep \
      --pretty_print indented \
      --wrap testsuites \
      --descr '' \
      --cond "testsuite" \
      summary/*.xml \
      > combined.xml
    mv combined.xml summary/hil-zephyr-${{ inputs.hil_board }}.xml
This step installs the xml-twig-tools package so that we have access to xml_grep. This magical Linux tool is able to match xml summary output filename patterns, unwrapping the testsuites item in each and rewrapping them all into one testsuites entry in a new file. This way we get a summary entry for each board instead of individual entries for every suite that a board runs.
As noted before, we use the upload-artifact action to upload all of these XML files for summarization at the end of the CI run.
Publish the comprehensive summary
The final step is to download all the XML files we’ve collected and publish a summary. I found the test-reporting action is excellent for this. We use a trigger at the end of our test run to handle the summary.
publish_summary:
  needs:
    - hil_sample_esp-idf
    - hil_sample_zephyr
    - hil_sample_zephyr_nsim_summary
    - hil_test_esp-idf
    - hil_test_linux
    - hil_test_zephyr
    - hil_test_zephyr_nsim_summary
  if: always()
  uses: ./.github/workflows/reports-summary-publish.yml
Note that this uses the needs property to ensure all of the tests running in parallel finish before trying to generate the summary.
name: Publish Summary of all test to Checks section

on:
  workflow_call:

jobs:
  publish-test-summaries:
    runs-on: ubuntu-latest
    steps:
    - name: Checkout repository
      uses: actions/checkout@v4

    - name: Gather summaries
      uses: actions/download-artifact@v4
      with:
        path: summary
        pattern: ci-summary-*
        merge-multiple: true

    - name: Test Report
      uses: phoenix-actions/test-reporting@v15
      if: success() || failure()
      with:
        name: Firmware Test Summary
        path: summary/*.xml
        reporter: java-junit
        output-to: step-summary
Finally, the job responsible for publishing the test summary runs. Each different pytest job uploaded its JUnit XML summary files with the ci-summary- prefix, which is used now to download and merge all files into a summary directory. The test-reporting action is then called with a path pattern to locate those files. The summary is automatically added to the bottom of the GitHub actions summary page.
One note on visibility with this GitHub action: we added the output-to: step-summary after first implementing this system. Ideally, these summaries should be available as their own line item on the “checks” tab of a GitHub pull request. But in practice we found they got lumped in as a step on a random job often unrelated to the HIL tests. Outputting to the step-summary ensures we always know how to find them. Go to the HIL Action page and scrolling down past the job/step graph.
Making continuous integration more useful
There’s a lot that can go wrong in these types of integration tests. We rely on the build, the programmer, the device, the network connection (cellular, WiFi, and Ethernet), the device-to-cloud connection, and the test-runner to cloud API to all work flawlessly for these tests to pass. When they don’t, we need to know where to look for trouble and how to analyze the root cause.
Adding this summary has made it much easier to glean useful knowledge from hundreds of tests. The next installment of our hardware testing series will cover using Allure Reports to add more context to why and how often tests are failing. Until then, check our our guide on using pytest for hardware testing and our series on setting up your own Hardware-in-the-Loop (HIL) tests.


No comments yet! Start the discussion at forum.golioth.io