Golioth collects data from your entire IoT sensor fleet and makes it easy to access from the cloud. Data visualization is a common use case and we love using Grafana to make dashboards for our fleets. It can start to get tricky if your devices are sending back mountains of different data. We’ll demonstrate how you can use Golioth REST API Queries to capture specific data endpoints from devices. By doing so, you can focus on the most important data points and utilize them to create powerful visual dashboards in Grafana.
Don’t Mix Your Endpoints
By far the easiest way to query streaming sensor data is just to ask for all of the events. But this presents an interesting challenge in Grafana. If your query response includes records that don’t have your desired endpoint, Grafana will see that as null and most often this will break your graph:
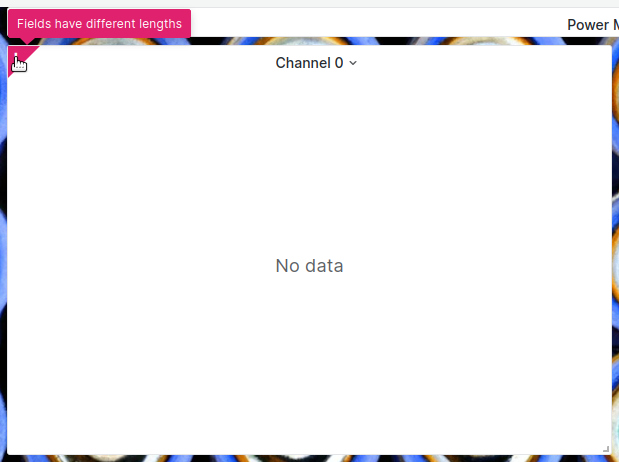
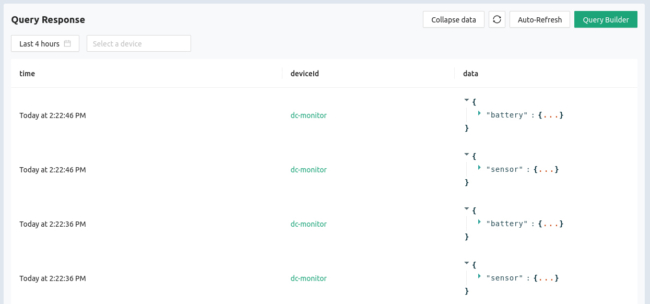
This is because the graph is targetting the sensor endpoint, but if we look at Golioth we can see that the device is sending data to the battery endpoint in between sensor readings. The sensor endpoint doesn’t exist for those readings.
Let’s diagnose, and fix this issue using the Query Builder button in the upper right of the LightDB Stream page of the Golioth Console.
Using Query Builder to Filter Data
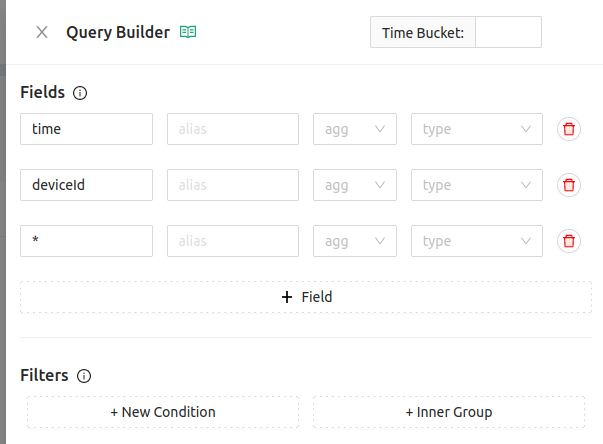
As it stands now, the query is asking for all data from all events by using the * wildcard operator:
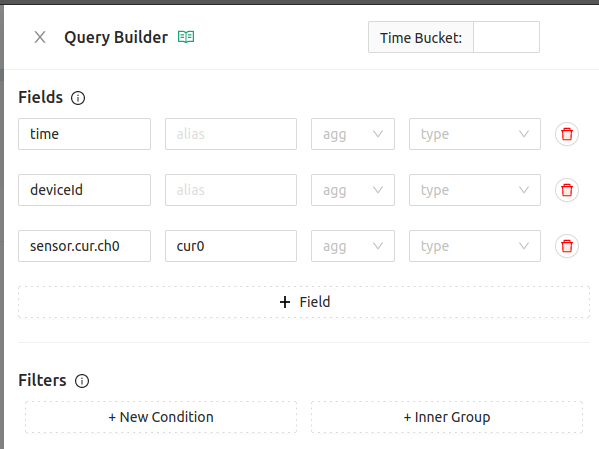
What we really want is just one endpoint that we can graph (along with the time and deviceId). So let’s change the query builder to target the current measurement on channel 0 of the incoming sensor data. I’ll also use an alias to make it easy to access the returned value.
This is a good start. But if you look at the data, we still haven’t solved the problem:
The dashes are the null values returned when trying to query our sensor data when it was a battery endpoint that was received. The final part of the puzzle is to add a filter that checks that our desired endpoint is not null.
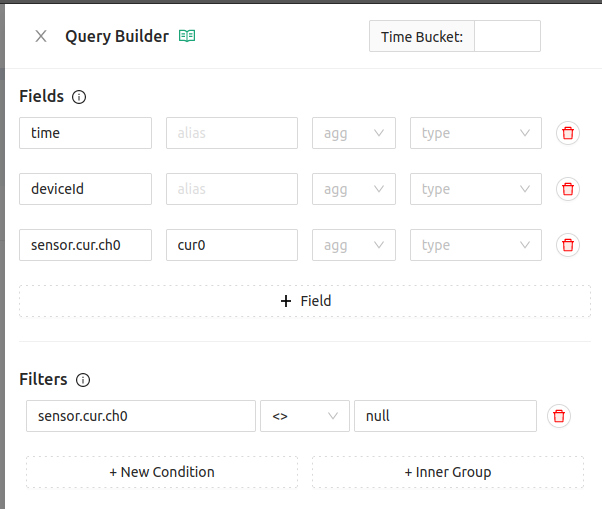 Now Golioth will only send data that includes the value we want to graph:
Now that we are receiving exactly the data we need, we can copy the query from the Query Builder by clicking the JSON button and then the Copy button.
Using the Query in Grafana
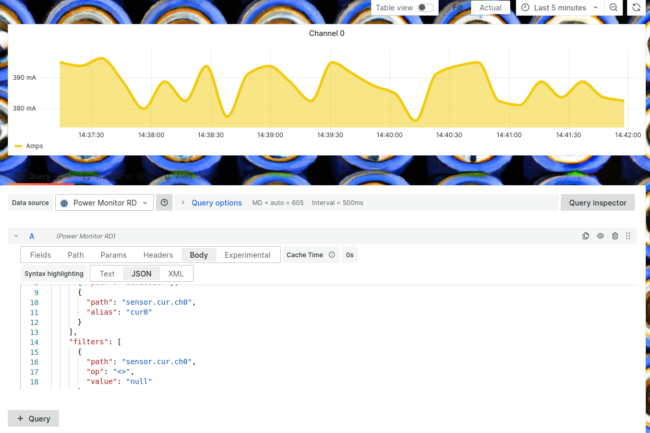
We previously set up a REST API data source for Golioth in our Grafana Dashboard. Use the Body tab to enter your query using the new values we created with the Query Builder.
In the Fields tab we’re using the alias that we specified. You could use the full endpoint but as your panels become more intricate you’ll thank yourself for using aliases!
For completeness, we’ll leave you with the verbose body object from this Grafana panel. You can see the parts we crafted in the Query Builder make up the query field.
{
  "start": "${__from:date}",
  "end": "${__to:date}",
  "perPage": 99999,
  "query": {
    "fields": [
      {
        "path": "time"
      },
      {
        "path": "deviceId"
      },
      {
        "path": "sensor.cur.ch0",
        "alias": "cur0"
      }
    ],
    "filters": [
      {
        "path": "sensor.cur.ch0",
        "op": "<>",
        "value": "null"
      }
    ]
  }
}
Give Golioth a Try Today!
The proof of concept for your IoT fleet can be up and running in days, not weeks if you use Golioth as your instant IoT cloud. Combined with visualization tools like Grafana, you’ll have no problem getting to “yes” with your customers (or your boss). Your first 50 devices are free with our Dev Tier, so give Golioth a try today!




No comments yet! Start the discussion at forum.golioth.io