At Golioth, we believe that the ability to perform Over-The-Air (OTA) updates is a crucial part of any IoT product, as it not only lets manufacturers upgrade their products in the field, but also provides an extra safety net that lets them recover from any unforeseen software issues. Because OTA updates are the safety net, the importance of control and overview is even higher in the update mechanism than any other aspect of the product.
A few months ago, we introduced Cohorts as a new way of managing OTA updates for devices connected to Golioth. Cohorts provided a safer user experience for OTA by explicitly grouping devices that were receiving the same OTA updates into cohorts and presenting the update history for each cohort separately.
Introducing the OTA Event Log
Since the release of Cohorts, we have been working on improving your ability to observe the OTA update process, and we’re excited to reveal our first OTA observability improvement: The OTA Event Log.
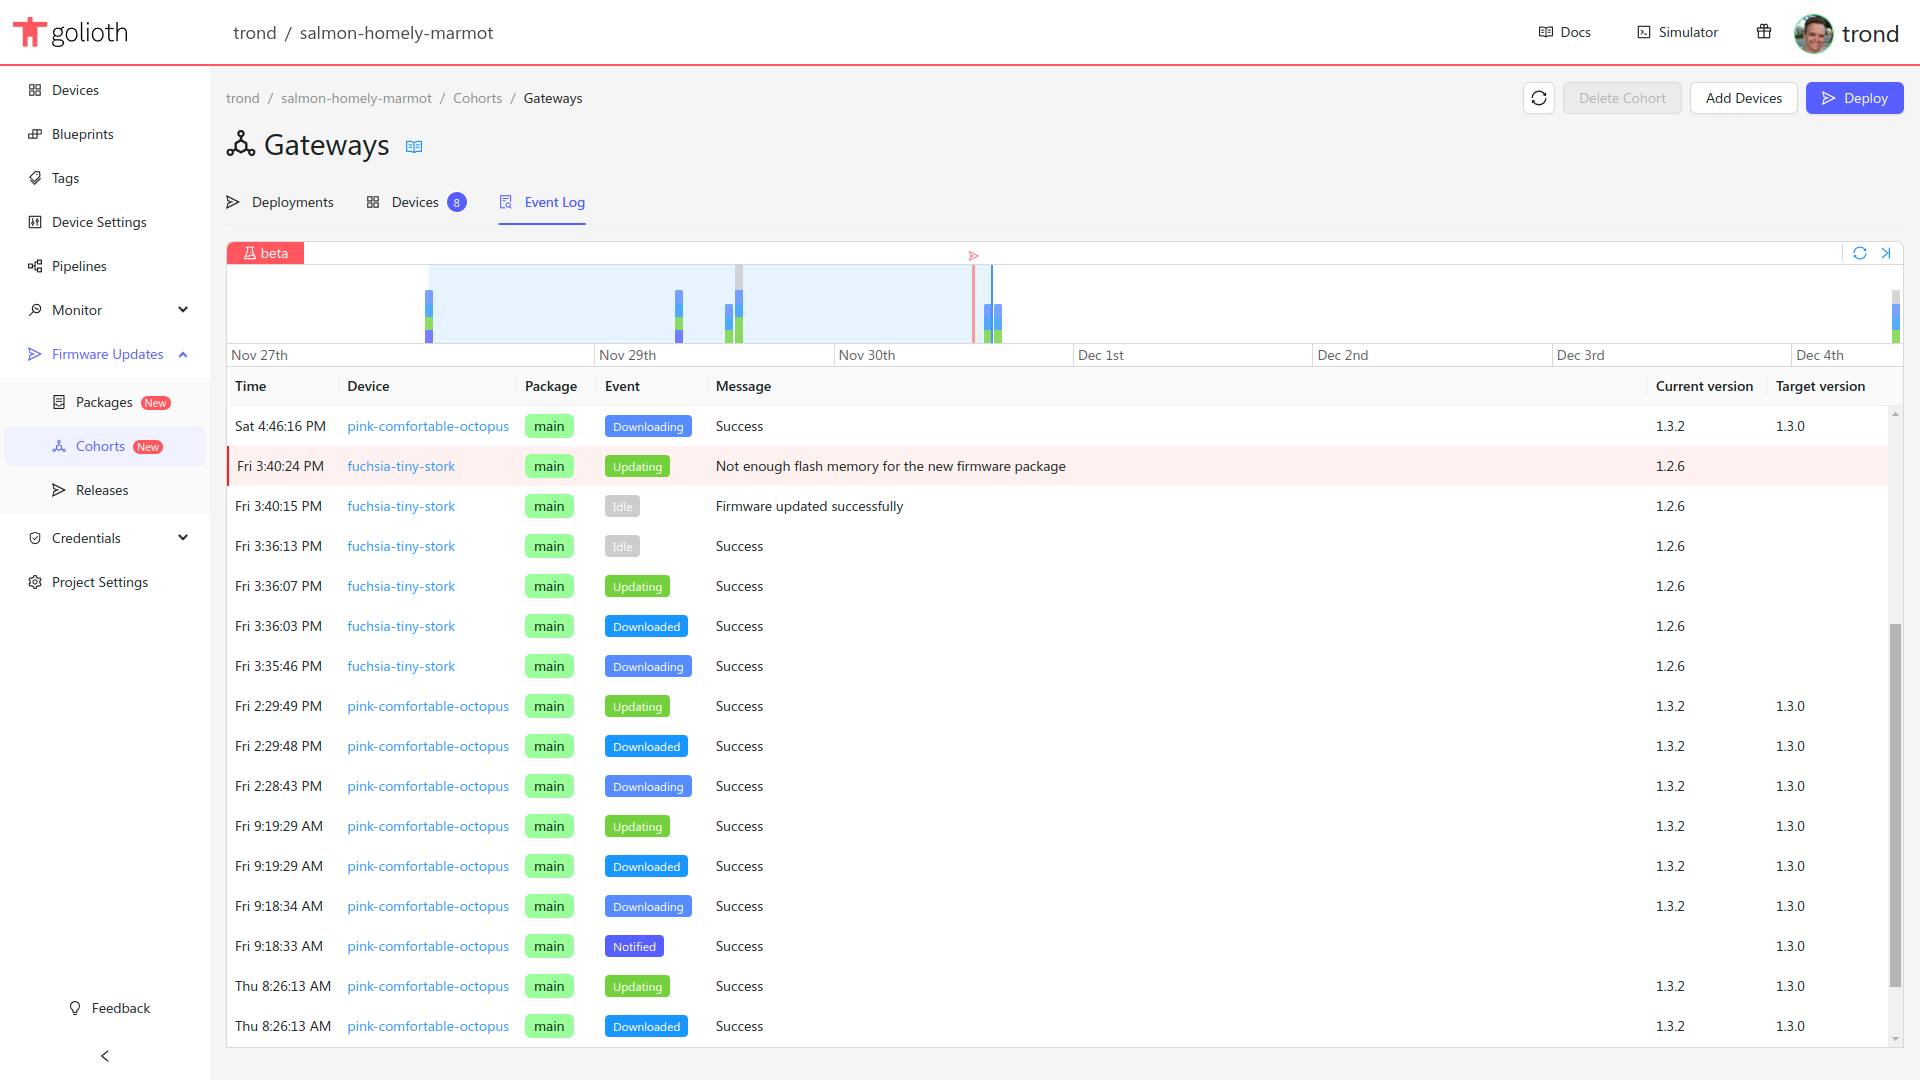
The OTA Event Log is a timeline of events recorded in a cohort. The event log is a available in a new tab in the cohort management page, and is presented as an interactive timeline with an accompanying log of events.
The timeline view contains an hourly summary of the reported events in the last week, as well as markers for any deployments to the cohort.
The OTA Events are based on the OTA state reports that are reported by the device as it moves through the update process. These are the same reports that power the firmware status tab of the device management page, but with the new timeline view, you’ll be able to review the device’s progress through each OTA deployment after the fact, and catch any reported errors or unexpected delays in the upgrade process for each device in the cohort.
The OTA Event Log is available for each cohort, as well as for each device, and can be found in the Event Log tab of the Cohort management page and the Firmware tab of the Device management page in the Golioth Console.
Event logs data retention
For developers on the Free Tier, OTA Event Logs will be available for the past 7 days. Developers on the Teams Tier will be able to access logs from the last 30 days, and developers on the Enterprise Tier will be able to define custom retention policies.
Note that we started recording events on December 5th 2024, and earlier events are unavailable.
What’s next?
The OTA Event Log is just the first step towards expanding the observability of OTA deployments. The new event collection mechanism powering the OTA Event Log enables us to build more complex heuristics and statistics for OTA updates, so stay tuned for incoming improvements to the Cohort pages, which are about to become a lot more powerful.

No comments yet! Start the discussion at forum.golioth.io