Recently I was working on upgrading a Zephyr-based project and encountered the worst of debug situations: the device was completely unresponsive after flashing the firmware. Opening a debug session didn’t yield any help, program flow never reached main, and I wasn’t even able to break on the Zephyr kernel initialization functions. What is there to do in this case? If your problems all start before user code, it’s time to check on what the bootloader is doing. Today we’ll take a look at how to debug MCUboot when all else has failed.
Debugging User Code
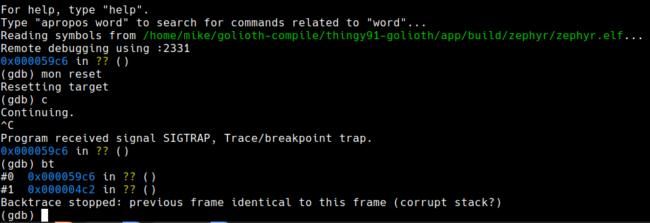
Debuggers usually help zero-in on bugs pretty quickly. For this project I was targeting a Thingy91 (based on the Nordic nRF9160) using a J-Link programmer, so west attach is all it takes to start the debugger. However, I was unable to get much useful output when starting a debugging session.
As you can see, the debugger doesn’t recognize any symbols at the current memory addresses. This matches up with the device being unresponsive, the app hasn’t started running yet. Let’s go deeper and look at the bootloader.
Loading Bootloader Symbols Into the Debugger
The Zephyr build system already built MCUboot as part of the normal compilation process. To debug the bootloader, simply use the file command to load the .elf file from the MCUboot directory.
When building a project for the nRF9160 under NCS, the build/mcuboot/zephyr folder contains the bootloader files. By loading the symbols from the .elf file, we have changed from debugging the user app to debugging the bootloader.
Getting a Useful Backtrace
Resetting and running program flow doesn’t lead to a crash, but we can halt after a second and check the backtrace.
From this output it’s much easier to tell why our device is unresponive: mcuboot is in a panic state. That’s helpful but we really need to know why. The next step is to set a breakpoint and walk through the code.
Stepping through MCUboot with GDB
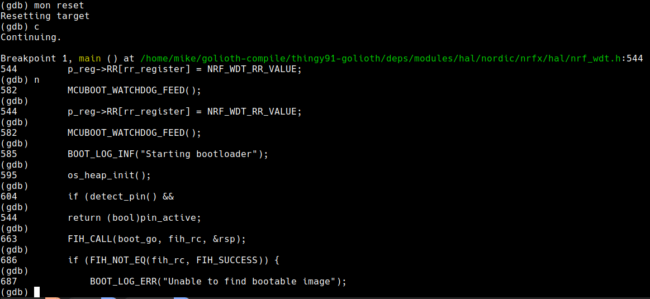
The backtrace shows that the panic happened in main. Let’s debug by setting a breakpoint there and stepping through to find more info.
After setting the breakpoint the device is reset and the continue command starts program flow. The next command is then used to run each successive call and it doesn’t take long to get to a very useful log message.
687 BOOT_LOG_ERR("Unable to find bootable image");
MCUboot needs to validate the images it is about to run, so this message indicates the image in the slot is invalid. Upon closer inspection (not shown here), some bug in the build system has allowed the image to be built too large when it should have caused the build to fail. MCUboot is aware of the partition table, and validates the signature cutting off at the hard stop of that partition size. This of course makes the signature check fail.
On some boards, this error message would have been printed out. However, it seems that the default configuration for the Thingy91 doesn’t enable terminal output for MCUboot, so instead of seeing the message we see nothing. With a little know-how, the debugger revealed the reason why.
View the Debugging Process
Sometimes a text overview is a bit hard to follow. You can see the full debugging process in the terminal capture below.


No comments yet! Start the discussion at forum.golioth.io