Yesterday I was upgrading a Golioth Reference Design to the newest version of the Golioth Firmware SDK and I encountered a network error I had never seen before. I was able to track it down fairly quickly using the debugging tools built into Zephyr. This process is quite handy, so today I’ll walk through how to debug a network error in Zephyr using GDB to help others hone their embedded debugging skills.
Encountering an Error
There are two errors shown below. The first is expected: the cell modem is not yet connected to the network so sending data will fail. But soon after the connection is established there is a second error highlighted below.
*** Booting nRF Connect SDK v2.5.2 ***
[00:00:00.465,942] <inf> fs_nvs: 2 Sectors of 4096 bytes
[00:00:00.465,942] <inf> fs_nvs: alloc wra: 0, fb8
[00:00:00.465,972] <inf> fs_nvs: data wra: 0, 68
[00:00:00.466,308] <dbg> golioth_powermonitor: main: Start Power Monitor Reference Design
[00:00:00.466,339] <inf> golioth_powermonitor: Firmware version: 1.2.0
[00:00:00.472,991] <inf> golioth_powermonitor: Modem firmware version: mfw_nrf9160_1.3.1
[00:00:00.474,456] <inf> golioth_powermonitor: Connecting to LTE, this may take some time...
[00:00:00.531,127] <inf> app_sensors: Device: ina260@40, 4.980000 V, 0.335000 A, 1.659999 W
[00:00:00.531,219] <inf> app_sensors: Device: ina260@41, 5.117499 V, 0.000000 A, 0.000000 W
[00:00:00.531,250] <dbg> app_sensors: app_sensors_read_and_stream: Ontime:      (ch0): 1        (ch1): 0
[00:00:00.531,463] <err> app_sensors: Failed to send sensor data to Golioth: 5
[00:00:02.397,918] <inf> lte_monitor: Network: Searching
[00:00:03.772,033] <inf> lte_monitor: Network: Registered (roaming)
[00:00:03.772,521] <inf> golioth_mbox: Mbox created, bufsize: 1232, num_items: 10, item_size: 112
[00:00:03.773,223] <inf> golioth_fw_update: Current firmware version: main - 1.2.0
[00:00:06.010,528] <inf> golioth_coap_client_zephyr: Golioth CoAP client connected
[00:00:06.010,803] <inf> golioth_powermonitor: Golioth client connected
[00:00:06.010,833] <inf> golioth_coap_client_zephyr: Entering CoAP I/O loop
[00:00:06.421,752] <dbg> app_state: async_handler: State successfully set
[00:00:06.443,542] <err> net_coap: 16 is > sizeof(coap_option->value)(12)!
[00:00:06.443,572] <dbg> app_state: app_state_desired_handler: desired
                                    66 61 6c 73 65                                   |false
[00:00:06.533,081] <inf> app_sensors: Device: ina260@40, 4.982499 V, 0.331250 A, 1.649999 W
[00:00:06.533,203] <inf> app_sensors: Device: ina260@41, 5.115000 V, 0.001250 A, 0.000000 W
[00:00:06.533,233] <dbg> app_sensors: app_sensors_read_and_stream: Ontime:      (ch0): 6003     (ch1): 1
[00:00:06.536,865] <inf> app_settings: Set loop delay to 10 seconds
[00:00:06.538,330] <inf> app_sensors: Device: ina260@40, 4.980000 V, 0.335000 A, 1.679999 W
[00:00:06.538,482] <inf> app_sensors: Device: ina260@41, 5.113749 V, 0.001250 A, 0.000000 W
[00:00:06.538,513] <dbg> app_sensors: app_sensors_read_and_stream: Ontime:      (ch0): 6008     (ch1): 6
[00:00:06.942,932] <dbg> app_settings: on_loop_delay_setting: Received LOOP_DELAY_S already matches local value.
[00:00:06.946,136] <dbg> app_settings: on_loop_delay_setting: Received LOOP_DELAY_S already matches local value.
[00:00:06.949,096] <dbg> app_settings: on_loop_delay_setting: Received LOOP_DELAY_S already matches local value.
[00:00:06.992,187] <inf> golioth_rpc: RPC observation established
[00:00:06.993,041] <inf> golioth_fw_update: Waiting to receive OTA manifest
[00:00:07.365,142] <dbg> app_sensors: get_cumulative_handler: Decoded: ch0: 1579017, ch1: 790405
[00:00:07.365,722] <dbg> app_state: async_handler: State successfully set
[00:00:07.367,553] <dbg> app_sensors: get_cumulative_handler: Decoded: ch0: 1579017, ch1: 790405
[00:00:07.368,133] <dbg> app_state: async_handler: State successfully set
[00:00:07.765,747] <inf> golioth_fw_update: Received OTA manifest
[00:00:07.765,777] <inf> golioth_fw_update: Manifest does not contain different firmware version. Nothing to do.
[00:00:07.765,808] <inf> golioth_fw_update: Waiting to receive OTA manifest
Hmmm, I wonder where this error came from?
<err> net_coap: 16 is > sizeof(coap_option->value)(12)!
I’ve never seen an error of this type before. Zephyr logging puts a logging tag at the beginning of each message and net_coap isn’t one that comes to mind. I started troubleshooting by “grepping”, or searching all files in a directory tree, for this message.
➜ rg net_coap
zephyr/subsys/net/lib/coap/coap.c
8:LOG_MODULE_REGISTER(net_coap, CONFIG_COAP_LOG_LEVEL);
1903:void net_coap_init(void)
Seven different files were returned by rg (that’s ripgrep, which is just a different flavor of grep), but the first one is obviously what we want. You can see the exact net_coap name registered as the logging module tag.
Looking inside that file, I searched for the error message. I only searched for the > sizeof part of the error message since the rest is likely being added to the log using string substitution.
if (option) {
    /*
     * Make sure the option data will fit into the value field of
     * coap_option.
     * NOTE: To expand the size of the value field set:
     * CONFIG_COAP_EXTENDED_OPTIONS_LEN=y
     * CONFIG_COAP_EXTENDED_OPTIONS_LEN_VALUE=<size>
     */
    if (len > sizeof(option->value)) {
        NET_ERR("%u is > sizeof(coap_option->value)(%zu)!",
            len, sizeof(option->value));
        return -EINVAL;
    }
Now we’re getting somewhere. The Zephyr contributor who worked on this code was even kind enough to leave comments on how to fix the error. However, I want to know what is causing the issue in the first place since I’m unfamiliar with this failure. Let’s use the debugger!
Using GDB to Debug Zephyr
Many boards that work with Zephyr have debugging support built right into the ecosystem. From the same directory where the build was run, I can run west attach to start GBD.
In GDB, first type mon reset to prepare the device to start from the beginning of the program. I know from the excerpt above that the error message is printed out from line 590 in the coap.c file. We can use the command b coap.c:590 to set a breakpoint, and start running using c for continue.
For help, type "help".
Type "apropos word" to search for commands related to "word"...
Reading symbols from /home/mike/golioth-compile/reference-design-dc-power-monitor/app/build/zephyr/zephyr.elf...
Remote debugging using :2331
arch_cpu_idle () at /home/mike/golioth-compile/reference-design-dc-power-monitor/deps/zephyr/arch/arm/core/aarch32/cpu_idle.S:143
143             cpsie   i
(gdb) mon reset
Resetting target
(gdb) b coap.c:590
Breakpoint 1 at 0x2139e: file /home/mike/golioth-compile/reference-design-dc-power-monitor/deps/zephyr/subsys/net/lib/coap/coap.c, line 590.
(gdb) c
Continuing.

Breakpoint 1, parse_option (data=0x20013bd1 <rx_buffer> "hE\212\361\206)\035渠.>a\002R.d\adesired\r\003reset_cumulative\377false", offset=<optimized out>, pos=pos@entry=0x2001a54c <golioth_thread_stacks+5708>, max_len=<optimized out>, opt_delta=opt_delta@entry=0x2001a54e <golioth_thread_stacks+5710>, opt_len=opt_len@entry=0x2001a54a <golioth_thread_stacks+5706>, option=option@entry=0x2001a578 <golioth_thread_stacks+5752>) at /home/mike/golioth-compile/reference-design-dc-power-monitor/deps/zephyr/subsys/net/lib/coap/coap.c:590
590                             NET_ERR("%u is > sizeof(coap_option->value)(%zu)!",
(gdb)
Great, we stopped where the error message is printed. At this point I want to know what my program was doing leading up to this moment. For this we can view the backtrace by typing bt.
(gdb) bt
#0  parse_option (data=0x20013bd1 <rx_buffer> "hE\212\361\206)\035渠.>a\002R.d\adesired\r\003reset_cumulative\377false", offset=<optimized out>,
    pos=pos@entry=0x2001a54c <golioth_thread_stacks+5708>, max_len=<optimized out>, opt_delta=opt_delta@entry=0x2001a54e <golioth_thread_stacks+5710>,
    opt_len=opt_len@entry=0x2001a54a <golioth_thread_stacks+5706>, option=option@entry=0x2001a578 <golioth_thread_stacks+5752>)
    at /home/mike/golioth-compile/reference-design-dc-power-monitor/deps/zephyr/subsys/net/lib/coap/coap.c:590
#1  0x0004f8bc in coap_find_options (cpkt=cpkt@entry=0x20020950, code=code@entry=23, options=options@entry=0x2001a578 <golioth_thread_stacks+5752>, veclen=veclen@entry=1)
    at /home/mike/golioth-compile/reference-design-dc-power-monitor/deps/zephyr/subsys/net/lib/coap/coap.c:907
#2  0x0004fa30 in coap_get_option_int (cpkt=cpkt@entry=0x20020950, code=code@entry=23)
    at /home/mike/golioth-compile/reference-design-dc-power-monitor/deps/zephyr/subsys/net/lib/coap/coap.c:1282
#3  0x00031308 in golioth_coap_req_reply_handler (req=req@entry=0x20021558, response=response@entry=0x20020950)
    at /home/mike/golioth-compile/reference-design-dc-power-monitor/deps/modules/lib/golioth-firmware-sdk/src/zephyr_coap_req.c:180
#4  0x00055e38 in golioth_coap_req_process_rx (client=client@entry=0x20020518, rx=rx@entry=0x20020950)
    at /home/mike/golioth-compile/reference-design-dc-power-monitor/deps/modules/lib/golioth-firmware-sdk/src/zephyr_coap_req.c:362
#5  0x000326be in golioth_process_rx_data (len=<optimized out>, data=<optimized out>, client=0x20020518)
    at /home/mike/golioth-compile/reference-design-dc-power-monitor/deps/modules/lib/golioth-firmware-sdk/src/coap_client_zephyr.c:866
#6  golioth_process_rx (client=0x20020518) at /home/mike/golioth-compile/reference-design-dc-power-monitor/deps/modules/lib/golioth-firmware-sdk/src/coap_client_zephyr.c:949
#7  golioth_coap_client_thread (arg=0x20020518) at /home/mike/golioth-compile/reference-design-dc-power-monitor/deps/modules/lib/golioth-firmware-sdk/src/coap_client_zephyr.c:1092
#8  0x0004d8a8 in z_thread_entry (entry=0x566ad <golioth_thread_main>, p1=<optimized out>, p2=<optimized out>, p3=<optimized out>)
    at /home/mike/golioth-compile/reference-design-dc-power-monitor/deps/zephyr/lib/os/thread_entry.c:48
#9  0xaaaaaaaa in ?? ()
Backtrace stopped: previous frame identical to this frame (corrupt stack?)
(gdb)
The backtrack places the most recent function call at the top in position #0. Looking down the list I can see that starting on line #3 the Golioth SDK is calling a Zephyr CoAP function. Walking back through those function calls I established that we received a CoAP packet and are trying to decode the options stored in that packet.
I don’t really need to know how all of that packet handling is done… what is more important to me is to see the packet itself to help illuminate why there’s an option in it that is too big for the configured space. Luckily, GDB lets us look at what’s stored in memory.
Using GDB to Inspect Data in Memory
If we look at the coap.c sourcecode, we find the breakpoint we set is inside the of the parse_option function.
static int parse_option(uint8_t *data, uint16_t offset, uint16_t *pos,
            uint16_t max_len, uint16_t *opt_delta, uint16_t *opt_len,
            struct coap_option *option)
This has a data array as a parameter that likely has our coap packet in it. We can print this out to see the data. It’s as simple as p data, with data being the name of the variable.
(gdb) p data
$1 = (uint8_t *) 0x20013bd1 <rx_buffer> "hE\212\361\206)\035渠.>a\002R.d\adesired\r\003reset_cumulative\377false"
(Note: yes, That 渠 is what GDB actually outputs. Binary data sometimes has weird consequences, especially when there are unicode characters for symbols that match)
We’re getting somewhere, but this is not all that useful since it was printed as ASCII values instead of showing the actual hexadecimal data. Let’s print that out.
(gdb) p/x data@max_len
value has been optimized out
The p/x data@max_len command tells GDB to print hexidecimal data from an array called data and to use the max_len variable to determine how many bytes to print. But it looks like we’re stymied by the optimization of the program.
The max_len of the data array has already been optimized out and is unavailable to us. The next thing to do is to print out an arbitrary number of bytes by guessing at the length of the data array. Since we were already able to print it I’m guess it’s about 64 bytes and then using the ASCII values of the final parts of that string to figure out where the data actually ends:
(gdb) x/64xb data
0x20013bd1 <rx_buffer>: 0x68    0x45    0x8a    0xf1    0x86    0x29    0x1d    0xe6
0x20013bd9 <rx_buffer+8>:       0xb8    0xa0    0x2e    0x3e    0x61    0x02    0x52    0x2e
0x20013be1 <rx_buffer+16>:      0x64    0x07    0x64    0x65    0x73    0x69    0x72    0x65
0x20013be9 <rx_buffer+24>:      0x64    0x0d    0x03    0x72    0x65    0x73    0x65    0x74
0x20013bf1 <rx_buffer+32>:      0x5f    0x63    0x75    0x6d    0x75    0x6c    0x61    0x74
0x20013bf9 <rx_buffer+40>:      0x69    0x76    0x65    0xff    0x66    0x61    0x6c    0x73
0x20013c01 <rx_buffer+48>:      0x65    0x00    0x00    0x00    0x00    0x00    0x00    0x00
0x20013c09 <rx_buffer+56>:      0x00    0x00    0x00    0x00    0x00    0x00    0x00    0x00
The x/64xb data command prints out exactly what we’re after. In GDB the x command prints out memory contents (I always remember this as “examine”). The slash (/) adds the additional commands to print 64 hexidecimal (x) bytes (b) starting from the pointer address named data.
Decoding the CoAP Packet
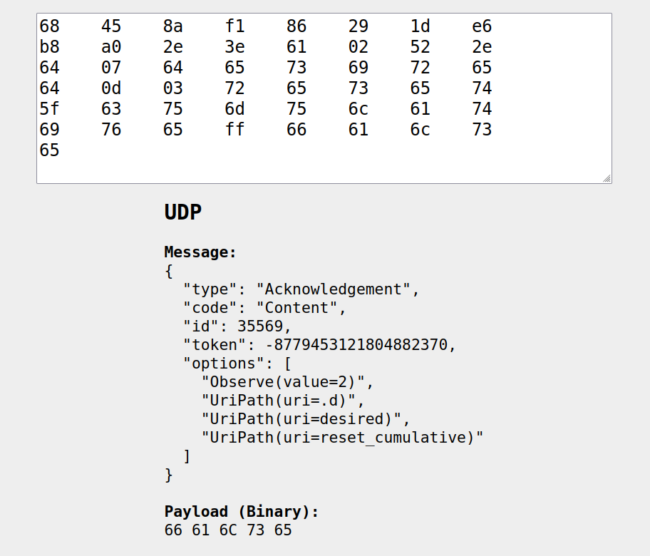
After just a bit of cleanup, I have the data I’m after but it’s certainly not human readable. I like to use a site called Koap Online CoAP Decoder to take care of this for me:
When we go back to the original error message, the option that is too long is 16 characters. From the decoding above we see that the third option is a path called reset_cumulative that is 16 characters long. This is too long for the 12 character buffer we have configured in the Zephyr CoAP library!
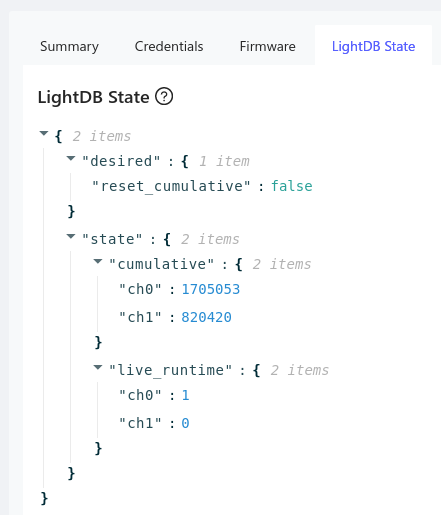
I did this to myself! The application I’m working on is observing a Golioth LightDB State path and I chose a long name:
 I followed the advice from the code comments in the Zephyr file and that fixed things right up.
# Adjust coap setting for a long (16-char) LightDB State sub-path
CONFIG_COAP_EXTENDED_OPTIONS_LEN=y
CONFIG_COAP_EXTENDED_OPTIONS_LEN_VALUE=16
Make the Debugger Your Go-To
The worst part about using a debugger is usually setting things up. But in many cases, that work has already been done for you in the Zephyr ecosystem. Try out these skills the next time an unfamiliar error pops up in your embedded development work!


No comments yet! Start the discussion at forum.golioth.io