One of the first challenges any embedded software developer faces is installing and configuring their development environment and toolchain. Toolchain version, silicon vendor libraries, Windows versus Linux, debug configuration, IDE settings, and environment variables are just a few components of the modern embedded developers workspace. The result of all this complexity is a fragile, hard to reproduce workspace for software often used in critical systems. We consider this developer experience equivalent to torture, and believe it is trapping value from reaching the market.
We know there is a better way. If the development environment can be entirely packaged and abstracted away from the developer they will be able to more quickly begin application development. A remotely managed toolchain also facilitates more efficient teamwork. It eliminates the cryptic mantra: “Works On My Machine” accompanied by an obligatory shrug.
The Established Way
The traditional approach to eliminating toolchain headaches has typically been through the use of Integrated Development Environments (IDEs). However, these packages are generally locked to a particular silicon vendor or compiler, may have paywalls to expose premium features, and can be constrained in feature availability. Our ‘gold standard’ for years has been the following:
- Ubuntu Virtual Machine
- Eclipse
- GNU MCU Eclipse Tools
- USB Passthrough from VM for debugging boards
Modern Web Options
Technologies like, VS Code, containerization, Microsoft’s Debug Protocol, and Language Server protocol have come together to enable a transformational developer experience. Most of the current approaches to bringing these technologies together in the market are built on top of some variation of VS Code. Each solution is vying to take advantage of VS Code’s capacity to run in the browser as seamlessly as it runs on a local machine.
One option is Github Codespaces. Which option requires the user to be on a paid plan, is not focused on embedded development, and uses a closed source server that is closed source. Another option is Keil Studio. Keil Studio is optimized for embedded development with ARM based microcontrollers. Pricing and roadmap are not yet established. It provides no terminal access and offers a limited number of embedded targets to work with.
Why We Chose Gitpod
We chose Gitpod in part for our mutually valued stance on open source, sustained active community engagement, and obsession with developer experience. Of note is Gitpod’s full-feature free tier. They provides 50 hours of running workspace per month; No payment details required. As a result, the psychological barrier of getting up to get one’s credit card is avoided. Fifty hours is enough time to introduce oneself to the Zephyr and Golioth ecosystems. Finally, Gitpod being open source enables us and our developers to optimize their workspaces to their needs.
Our Current Gitpod Workflow
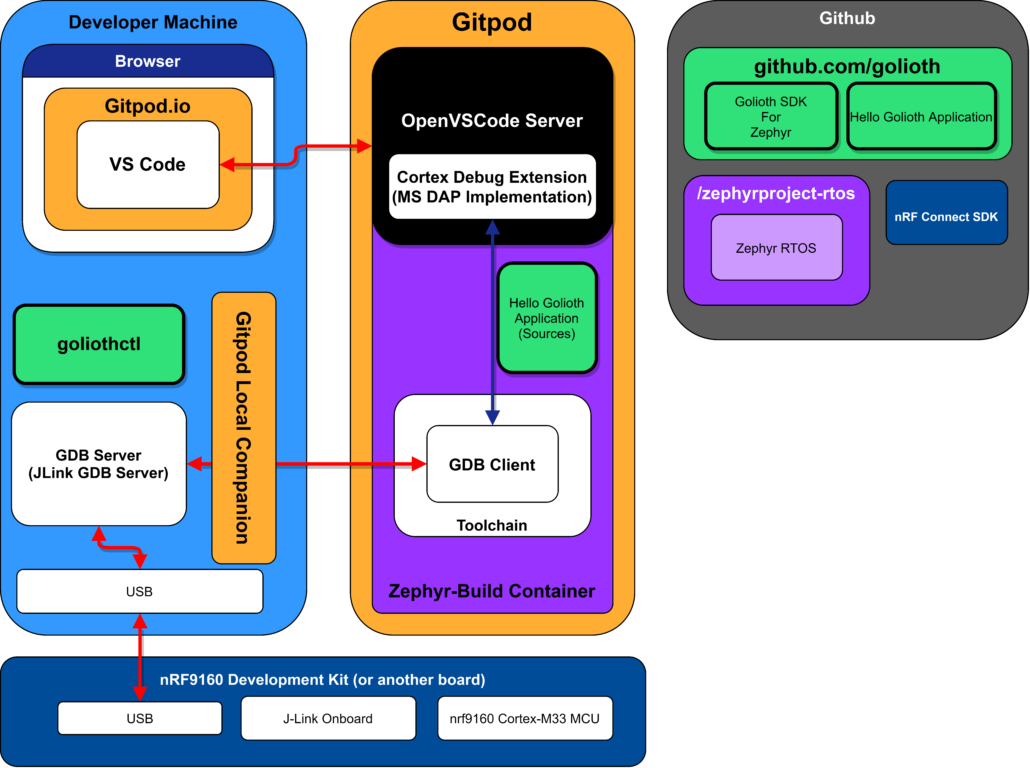
Setting up the application begins with cloning the Example Application from Zephyr GitHub. Next, the Golioth SDK is added as a dependency. Changes are then added to the .gitpod.yml and .gitpod.Dockerfile. After running ‘west update’ with the configurations in place, the hello application is copied from the Golioth SDK directory to the project root directory in place of or at the same level as the ‘app’ folder. Here is a link to the end result.
Also, some background info on Gitpod.
Our target embedded cloud developer experience would be one in which the developer instantiates the cloud development environment and has zero local tool dependencies. They can then plug their debug hardware into any machine from anywhere with internet access and develop. Our current implementation requires three local tools to facilitate debugging functionality with the current state of the Gitpod software and VS Code. Gitpod provides a Gitpod Local Companion which allows localhost access to any TCP port in a remote workspace. The second piece of software required locally is SSH. SSH is necessary to establish an ssh tunnel between the Gitpod instance and local machine. The final software that is run on the local machine is JLinkGDBServerCL.
State of the Art
The technology to facilitate cloud-based development has arrived and it will enable remarkable gains in productivity and developer experience. Unfortunately, we still have local dependencies and in the current state things are not optimized for use over the internet. Step debugging was accomplished, but some work remains for embedded cloud development to compete with a local development environment. With this in mind, a future blog post will show we actually can be effective developers when using this solution with a virtualized QEMU target.
To do this proper we’d serve an MS DAP compatible debug server such as Probe.rs to the developers browser, and hook it up to the target board using webUSB. A challenge that exists, is the lack of open source microcontroller debuggers written in JavaScript or WebAssembly. The translation from C code to WebAssembly is not straightforward and can be error-prone. However, valid translators of Rust to WebAssembly do exist, and Probe.rs is an open-source debugger written in Rust. We also need to convince Microsoft to push this PR forward.
Stay tuned for a future post about how to build, run, and debug Golioth examples with QEMU in less than 10 clicks.


