We co-hosted a webinar with InfluxDB demonstrating how Golioth Pipelines make it simple to stream data from a microcontroller with environmental sensors directly into a production InfluxDB database. Using the example of a greenhouse monitor, we showed how to collect temperature and humidity data from sensors, stream it into InfluxDB, and then visualize and set up alerts in Grafana. With Golioth’s Pipelines, what used to be a complex, multi-month project can now be implemented with just a few lines of YAML configuration. Learn more about Pipelines in our docs or check out the Thingy:91 prebuilt binary we used in the webinar to get started immediately.
Streaming Data from Golioth to InfluxDB
Golioth Pipelines make it straightforward to send data from your IoT devices to InfluxDB. To get started, you can use this pipeline example for InfluxDB with CBOR.
filter:
  path: "*"
  content_type: application/cbor
steps:
  - name: step-0
    transformer:
      type: cbor-to-json
      version: v1
    destination:
      type: influxdb
      version: v1
      parameters:
        url: https://us-east-1-1.aws.cloud2.influxdata.com
        token: $INFLUXDB_TOKEN
        bucket: device_data
        measurement: sensor
You’ll need to enter your InfluxDB URL, along with the url of your InfluxDB instance and API key in the YAML configuration.
This setup allows you to instantly stream your device data securely and efficiently into InfluxDB.
Visualizing IoT Data in Grafana
After streaming data into InfluxDB, the next step is to visualize and act on it. Here’s how we set it up in the webinar:
- Connect Grafana to InfluxDB:
- Open Grafana and navigate to Configuration > Data Sources.
- Add a new data source and select InfluxDB.
- Choose “Flux” as your query language.
- Enter your InfluxDB instance URL, organization, bucket, and authentication token details.
- Save and test your new data source
- Create Charts with Flux:
- Add a new panel in Grafana and use Flux to fetch your data. For example:
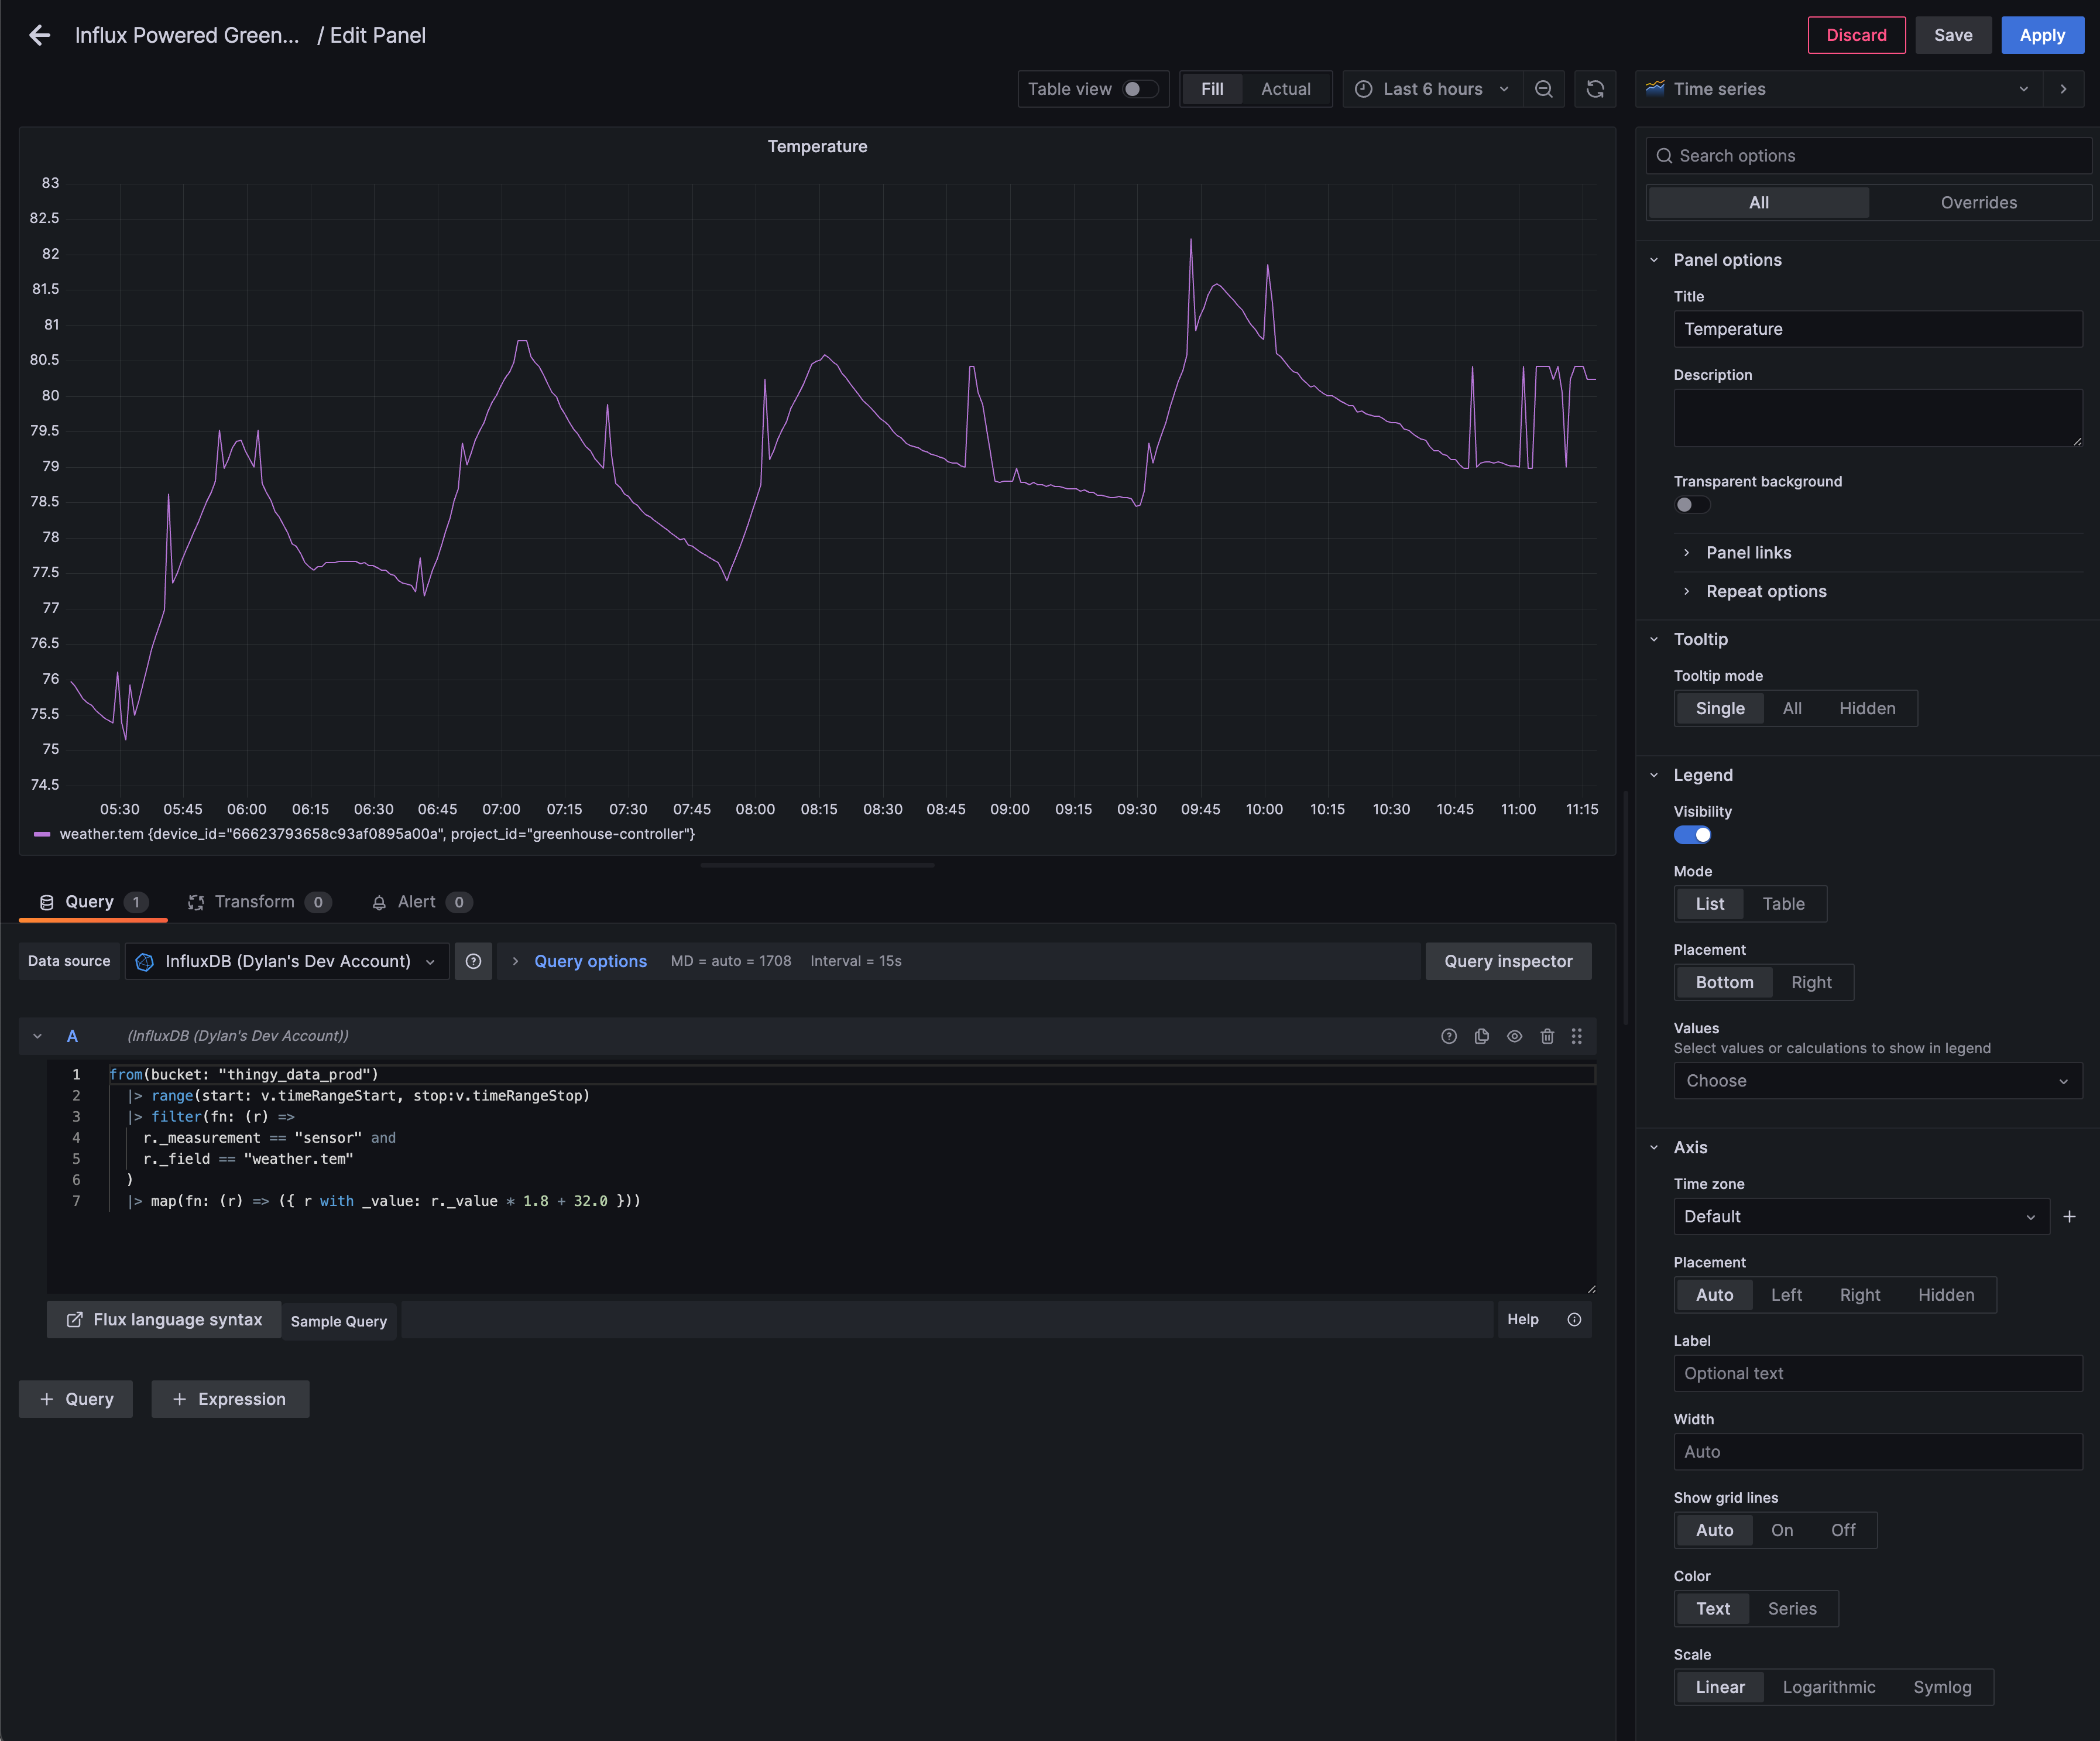
- Temperature:
from(bucket: "thingy_data_prod") |> range(start: v.timeRangeStart, stop:v.timeRangeStop) |> filter(fn: (r) => r._measurement == "sensor" and r._field == "weather.tem" ) - Humidity:
from(bucket: "thingy_data_prod")
  |> range(start: v.timeRangeStart, stop:v.timeRangeStop)
  |> filter(fn: (r) =>
    r._measurement == "sensor" and
    r._field == "weather.hum"
  )
- Temperature:
- Customize the visualization (e.g., line graphs) to monitor trends in real time.
- Add a new panel in Grafana and use Flux to fetch your data. For example:
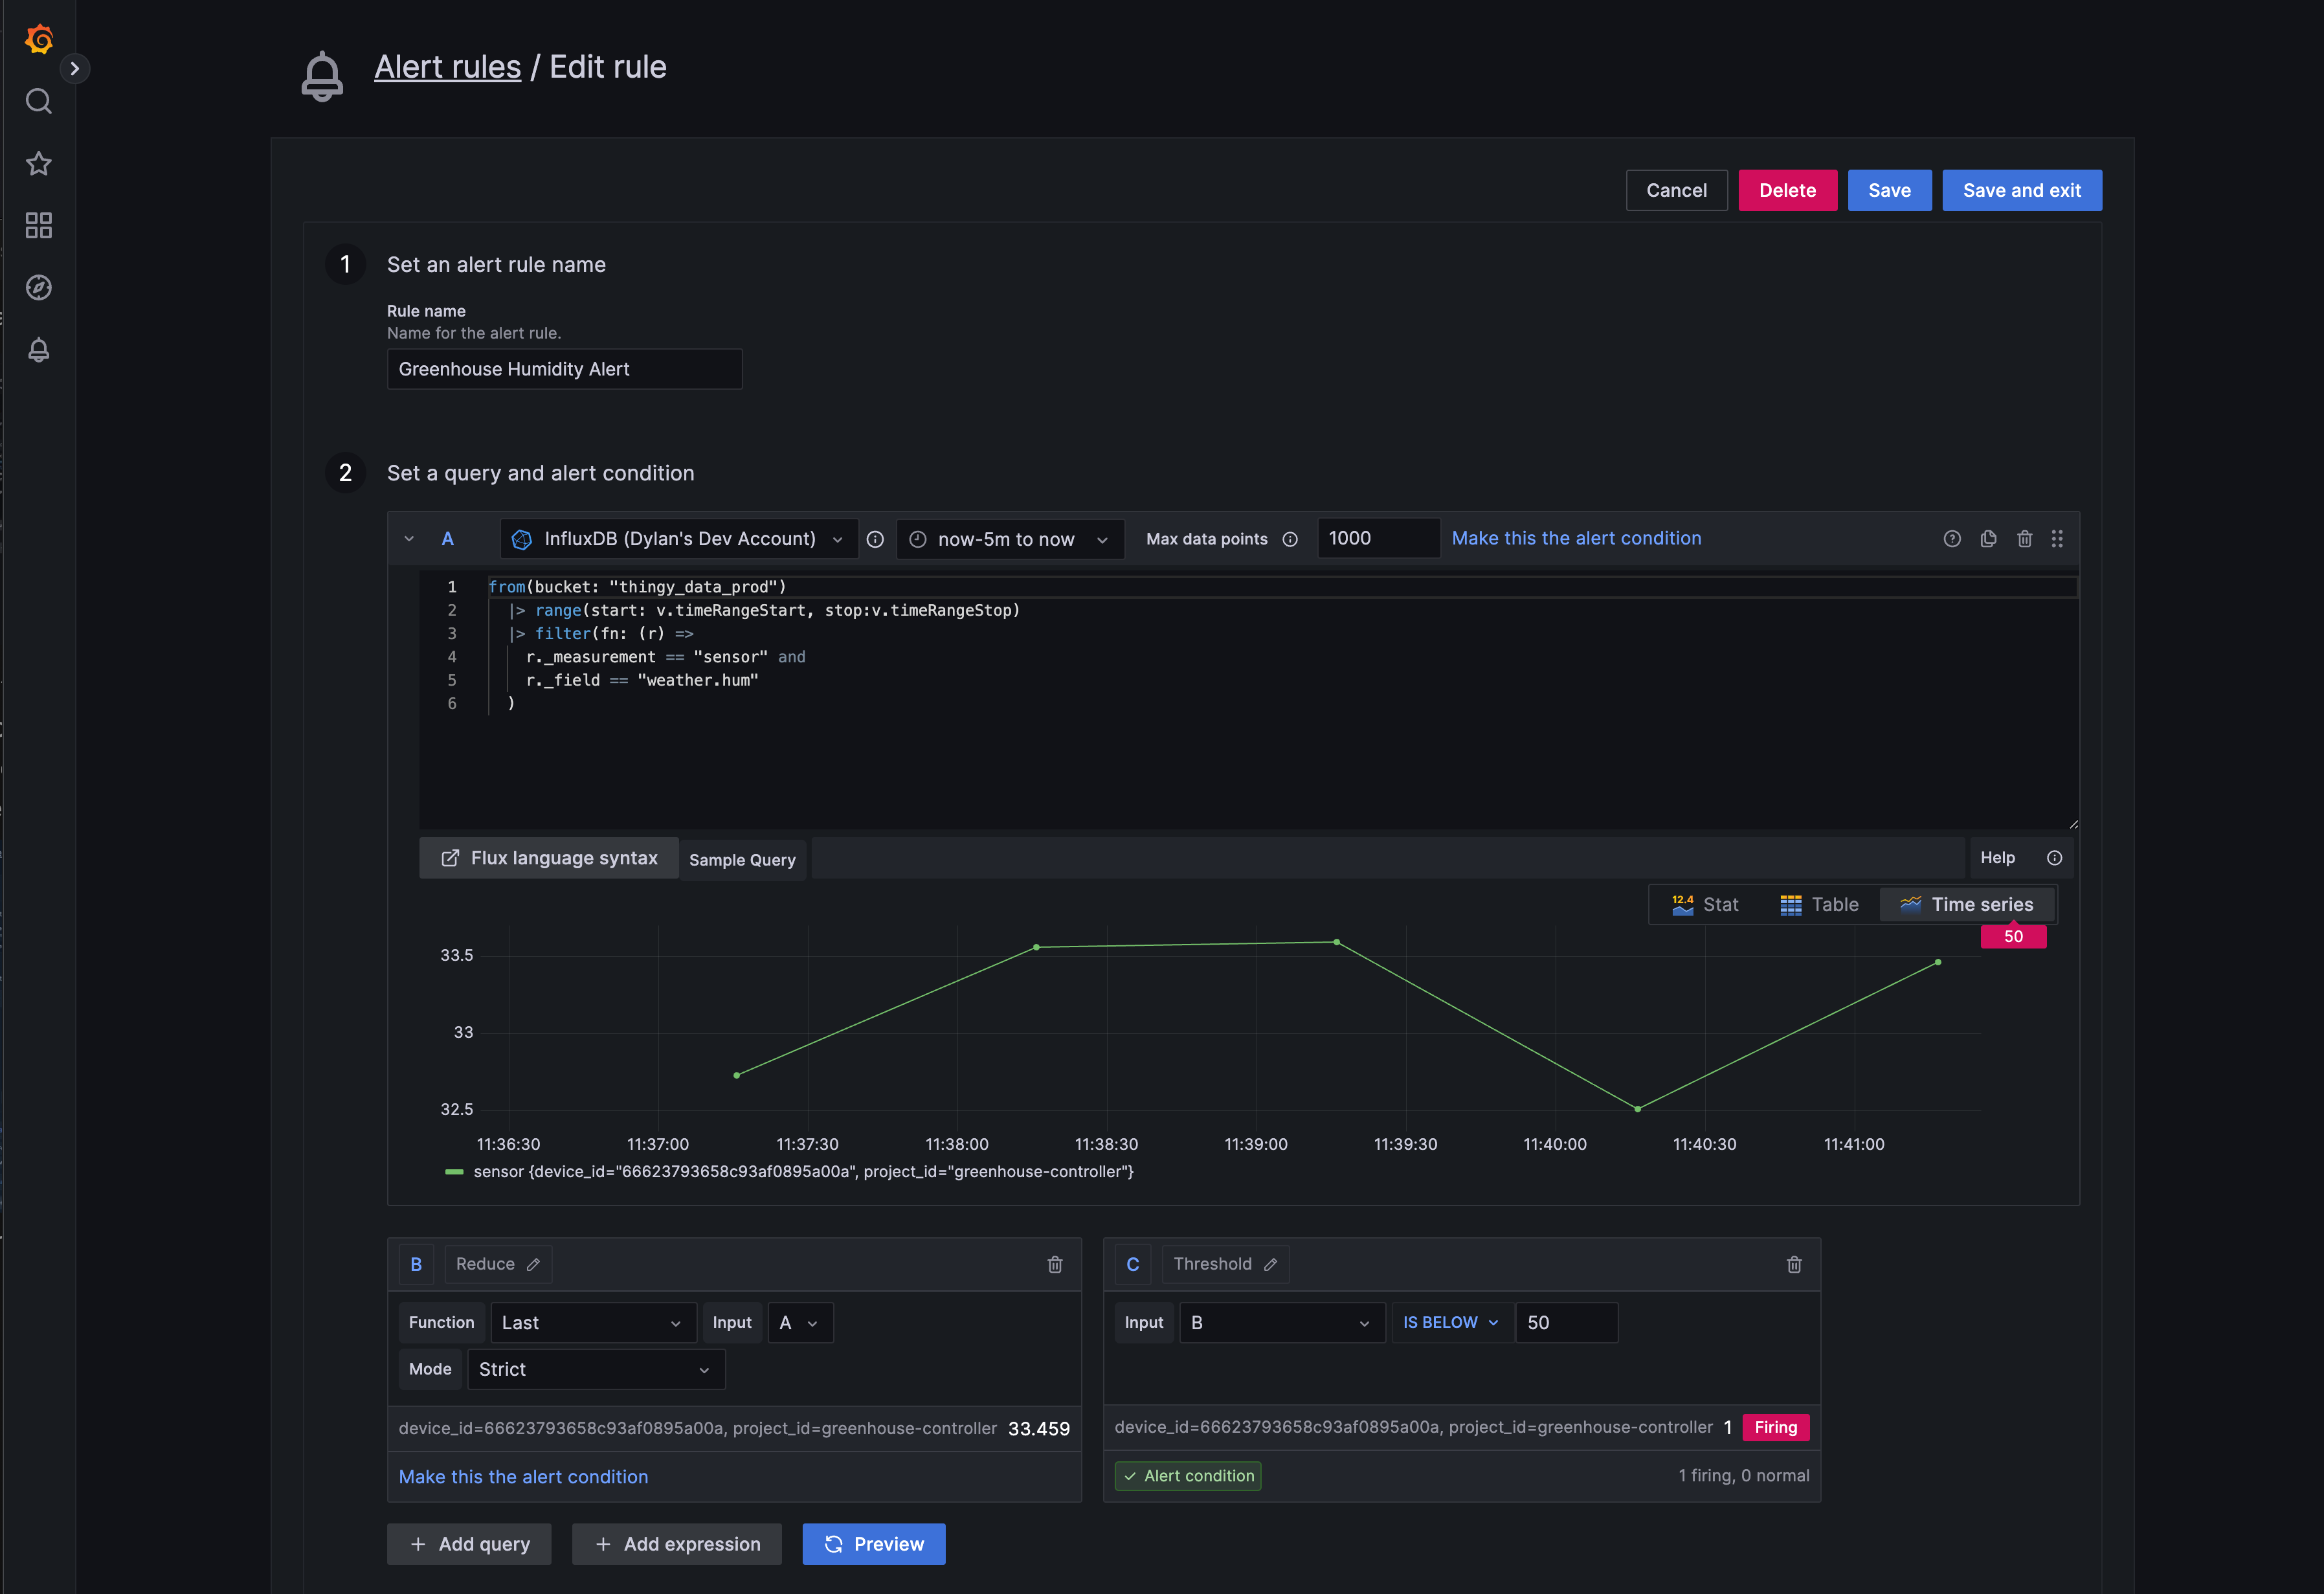
- Set Up Alerts for Humidity:

- To configure an alert, go to Alerting on the left-hand sidebar in Grafana and select Alert Rules. Then click on Create Alert Rule.
- In the alert rule setup:
- Select the same InfluxDB datasource we’d configured before.
- Define a Flux query (we can use the same one from our chart) that fetches humidity data. For example, use the query shown earlier for humidity.
- Set a condition to fire the alert when humidity drops below 50%. For example, configure the condition to check if the value of
_valuein the query output is less than50. - Use the Preview/Test Alert Condition feature to ensure your query and condition behave as expected before saving.
- After defining the alert rule, configure a contact point in the Contact points tab
- Finally, create in the Notification policy tab create or use the default notification policy to manage how and when alerts are sent based on severity and timing.
With these steps, not only be able to visualize data but also receive real-time notifications when humidity drops below the desired threshold, ensuring you can respond quickly to critical changes.
Get Started Today
Golioth and InfluxDB make it effortless to manage, visualize, and act on IoT data. With prebuilt binaries like for the Thingy:91 and Grafana’s visualization and alerting tools, you can turn sensor data into actionable insights in no time.
Explore our documentation on Pipelines, or visit our GitHub for prebuilt binaries and open-source reference designs.
You can watch the full webinar at IoT Insights with InfluxDB & Golioth: Real-Time Monitoring Made Simple.

No comments yet! Start the discussion at forum.golioth.io