One small step for debug
If you are getting started in Zephyr, you can get a lot done using the serial/terminal output. I normally refer to this as “printf debugging”. With Zephyr it would be “printk debugging” because of the difference in commands to print to the serial output (or to a remote logging service like Golioth). Honestly, this method works great for example code, including many of our tutorials.
In addition to Zephyr’s ad hoc nature as a package management platform for embedded software, it is also a Real Time Operating System (RTOS). We use Zephyr’s package management as a starting point: we want users to be able to bootstrap a solution by downloading toolchains and vendor libraries. We don’t dig into the operating system very often on this blog or in our tutorials. Much like printk debugging, the details aren’t really needed when getting started with Zephyr and Golioth. But when you begin to dig deeper, you will be kicking off your own threads and workers, and utilizing other features of the RTOS like semaphores and queues. Once you’re doing that, I can all but guarantee you’ll want more visibility into what’s happening in your system.
This article showcases SEGGER Ozone and SystemView tools, which will help you peek inside. It also adds a few pieces to getting started with these platforms that I found lacking when searching for answers on the broader internet.
Saving battery budgets
My motivator to dig deeper on these systems is getting ready for the upcoming conference season. We will be at the Zephyr Developer Summit and Embedded World representing Golioth. We want to showcase our technology, including our capabilities as a Device Management solution for Thread-based device networks. Our demo of Zephyr, OpenThread, and Golioth runs on a battery-based device, which isn’t something we normally do. Most of our demos expect you’ll be powering your platform using a USB cable. When you start to care about power draw, you start to care about where your program is spending its time. Understanding whether a device is in sleep mode and how long it spends processing a piece of data is critical to optimizing for battery life. Since I don’t want to lug along an entire suitcase of batteries with me to the conference, I started wondering where we’re hanging out in the various threads of Zephyr. This is where a debugger and a real-time process recorder come in.
Tooling up for debugging
So I know I need a debugger.
My experience as a hardware engineer is that silicon vendors normally have a dedicated path for their code examples, Real Time Operating Systems (RTOSes), and Integrated Development Environments (IDEs). If I’m being honest, that was the path I took in the past: it was a low friction way to get something blinking or talking back to the network. Going outside of that path to use Zephyr means the tooling is more DIY. Even some vendors that provide support for Zephyr as their primary or secondary solution don’t have a “one way” of doing things. The fact that Zephyr is flexible is both a blessing and a curse. I can implement anything I’d like! But I need to go figure it out.
SEGGER Ozone
SEGGER are the makers of the popular J-Link programmer, in addition to a wide suite of software tools for embedded developers. I was interested in Ozone because of the open nature of their debugger, completely decoupled from any IDE or vendor toolchain.
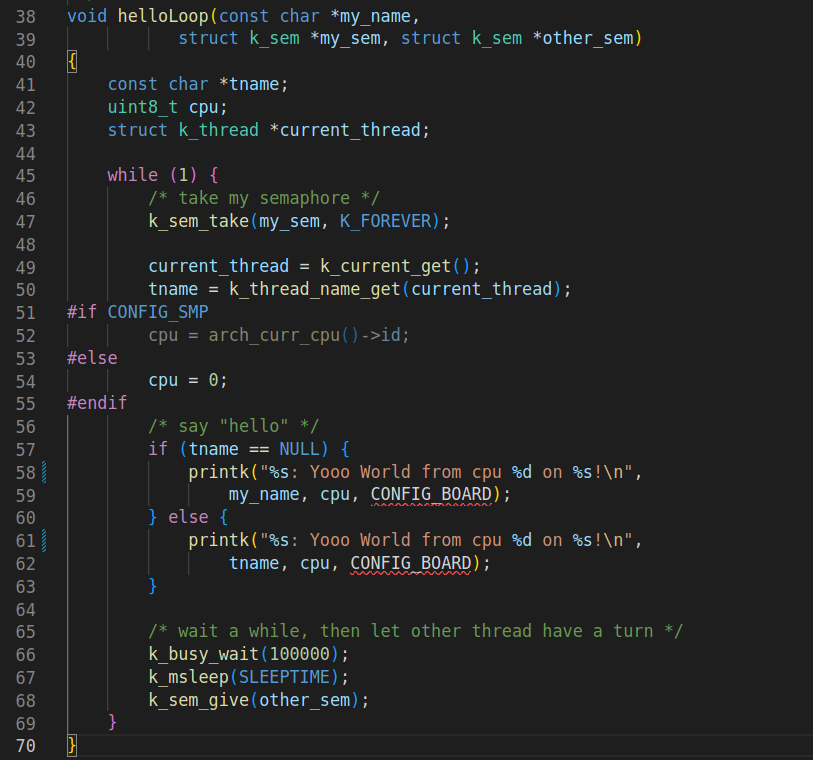
I was excited to see a webinar from our friends at NXP talking about using SEGGER Ozone with Zephyr (registration required). The webinar showcases using a Zephyr sample called “Synchronize”, which is available at <zephyr_install_directory>/zephyr/samples/synchronize.
The basic idea of the sample is you are sharing a semaphore between two threads. It’s like passing a ball back and forth. Once the loop for one thread runs, it release the semaphore and the other thread can pick it up and use it. Each thread is effectively running the same code, it just only does so when the thread and semaphore line up properly.
The net result is that you can see the threads ping-pong-ing back and forth on a debugger. See the NXP link above for a video example of this in action.
Using Ozone with Zephyr
One thing that wasn’t clear to me from the NXP webinar is getting everything set up. This was the genesis of this article. I wanted to put the required steps in one place.
Requirements:
- J-Link programmer
- Development board with SWD or JTAG access
- Compatible chipset/board in the Zephyr ecosysttem (we will be showing the
mimxrt1060_evkbbelow) - SEGGER Ozone installed on your machine. You can download and install the program from this page.
Step 1: Compile the program
The first step is to compile the project at <zephyr_install_directory>/zephyr/samples/synchronize with some added settings in the prj.conf file.
You will need to have the Zephyr toolchains installed. For our example, I will compiling for the NXP RT1060 EVKB board, which means I need to include the NXP Hardware Abstraction Layer (HAL). If you’re a regular Golioth user, this is not installed by default (but will be soon). Instead, I recommend you install Zephyr directly from the tip of main or start from a “vanilla” Zephyr install already on your machine. Start a virtual environment if you have one (or prefer one) and then run the following:
[sourcecode]
mkdir ~/RTOS_test
cd ~/RTOS_test
west init
west update
[/sourcecode]
This will be an entire Zephyr default install and will take a bit to download/install. We’re showing this for the RT1060 board but this should work on almost any board in the main Zephyr tree, including virtual devices.
[sourcecode]
cd ~/RTOS_test/zephyr/
nano samples/synchronize/prj.conf
[/sourcecode]
Add the following to the sample code, if it’s not already there. This will allow Ozone to understand some of the threads in the program.
[sourcecode title=”prj.conf”]
# enable to use thread names
CONFIG_THREAD_NAME=y
CONFIG_SCHED_CPU_MASK=y
CONFIG_THREAD_ANALYZER=y
[/sourcecode]
Finally, build the code:
[sourcecode]
west build -b mimxrt1060_evk samples/synchronization/ -p #you can swap this out for another board
west flash
[/sourcecode]
This loads the binary file (zephyr.bin) onto your board.
Step 2: Load the ELF into SEGGER Ozone
Normally it’s the “binary” version of your program that is loaded onto the board. To use a debugger, we want something called an ELF File instead, which stands for “Executable and Linkable Format”. I think of it as an annotated version of your binary, because it includes the source files and all of the references as you go through your program.
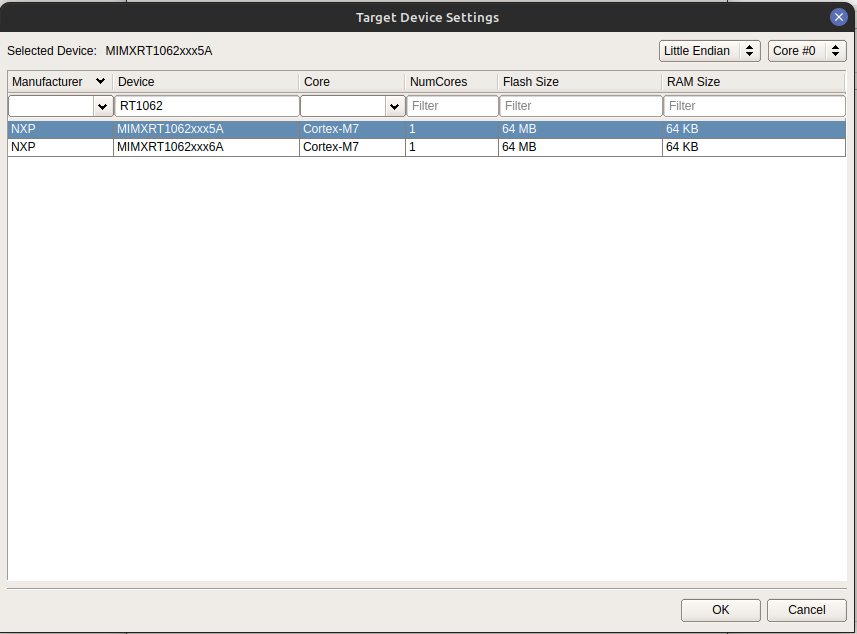
Start a new project using the New Project Wizard, walking through the various dialogs:
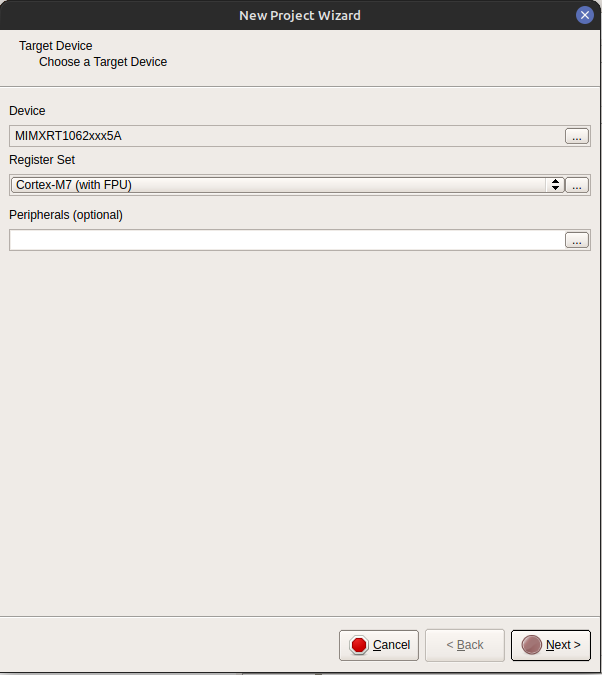
If it’s not already selected, choose your processor (in the case of the mimxrt1060_evkb, the part is actually the rt1062)
Choose your J-Link (required for SEGGER Ozone). On my board it uses Single Wire Debug (SWD) but some boards might use JTAG.

Load the ELF file from your build directory. This will be located at <zephyr_install_directory>/zephyr/build/zephyr, using the instructions above.

The most critical piece!
I wanted to call this out because it took me so long to find how to enable the “thread aware” debugging part of Ozone. You need to run the following command in the Console:
Project.SetOSPlugin ("ZephyrPlugin")
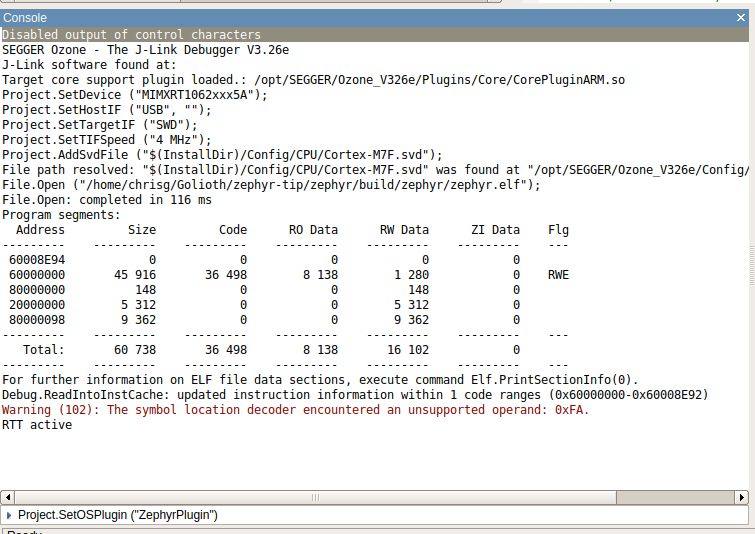
This tells SEGGER to run a built-in script and enable a new window in the “View” menu. Select the newly available “Zephyr” option or hit Alt + Shift + O to enable it. You should now see a new window pop up on your screen.
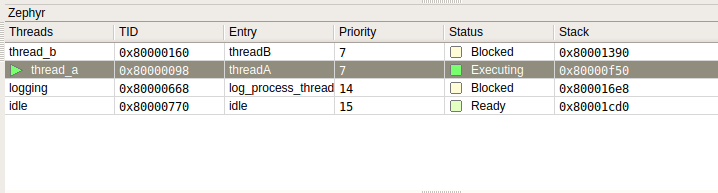
This window shows the two threads that are available in the “Synchronize” program.
I set a breakpoint on the printk command that is writing to the terminal (click the gray button next to the line where you want to set a breakpoint). Then I start debugging from the menu Debug -> Start Debug Session -> Attach to Running Program. This should start the debugger and then halt where you set a breakpoint:
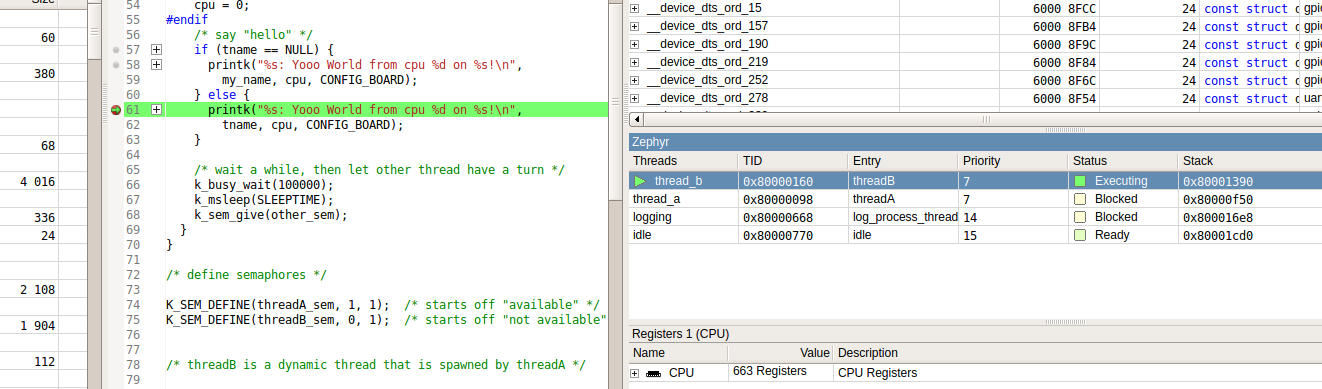
Click the Resume button or hit F5 and you will see the Zephyr window switching between Thread A and Thread B.
SEGGER SystemView
SystemView is something I first became aware of in Brian Amos’s book “Hands-On RTOS with Microcontrollers”. I was reading it to learn more about the pieces of Real Time Operating Systems and he uses SystemView to help analyze where an RTOS is spending the majority of time. This is critical because operating systems rely on the concept of a “scheduler”, which relinquishes control over precisely what is happening when in a program.
SystemView is a separate piece of software from Ozone and is licensed differently. It is free to use as a trial, but extended usage by commercial operations will need to purchase a license. You can download the software from SEGGER for trial usage.
Using SystemView with Zephyr
There are some additional steps required to get a program working with SystemView on Zephyr.
The most critical piece(s)!
There are two critical pieces to get a Zephyr program running with SystemView:
- You must be doing your logging using RTT.
- Using only UART logging of messages will not work. SystemView requires an “RTT Control Block” in your code and if it’s not there, SystemView will timeout while trying to capture events.
- The message I kept receiving was “Could not find SystemView Buffer”.
- You must log traces using RAM instead of UART (default)
- This allows the debugger to extract trace information from memory. Some other OSes can pull in UART trace messages but this is not enabled on Zephyr yet.
You can enable RTT and other required settings in the prj.conf file (these can also be set through Zephyr’s menuconfig):
[sourcecode title=”prj.conf”]
CONFIG_THREAD_NAME=y
CONFIG_SEGGER_SYSTEMVIEW=y
CONFIG_USE_SEGGER_RTT=y #see point 1 above
CONFIG_TRACING=y
CONFIG_TRACING_BACKEND_RAM=y # see point 2 above
[/sourcecode]
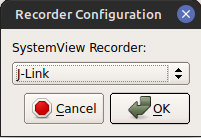
Recompile the program and flash to your board. You should now be able to open SystemView and get started. Upon opening the program, you’ll need to configure for your J-Link:
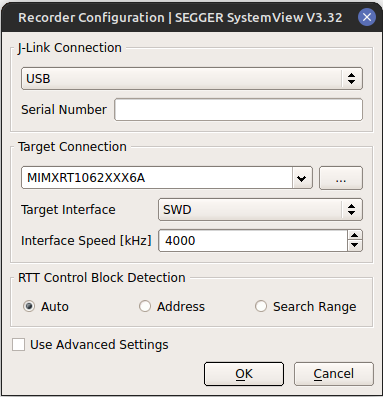
And your board settings:
Finally when you hit the “Play” button (green arrow) or hit F5, it should start to capture events on your device.
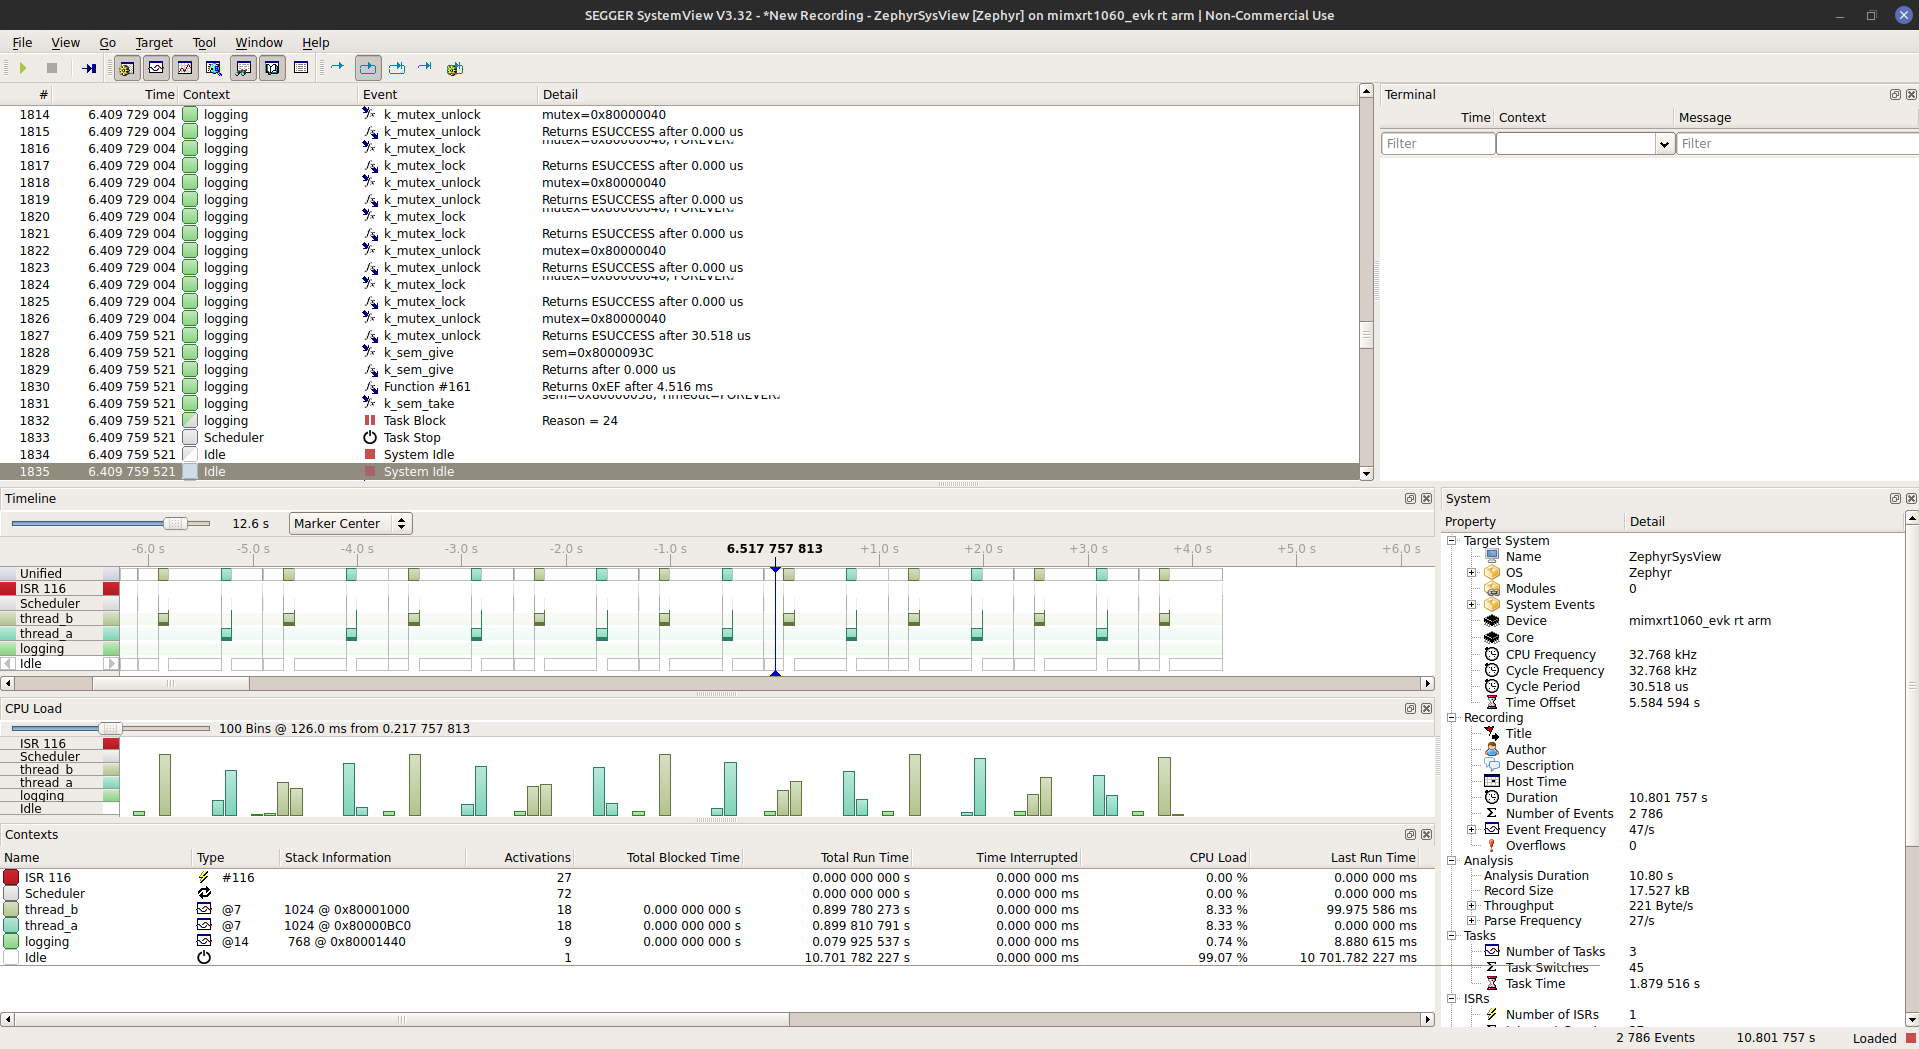
As you can see below in the “Timeline” window, control is bouncing back and forth between “Thread A” and “Thread B”.
Using Ozone and SystemView together
These are two different tools using the same interface. The cool thing is that you can use them together at the same time. This is especially useful because SystemView will capture all events, which can quickly become overwhelming. You might instead only want to see a small subset of events. You can set a breakpoint in Ozone, start recording in SystemView, and then get a targeted look at the program execution right where the breakpoint is happening. You can target smaller subsections of your code to really pinpoint and optimize your functions.
Giant Leaps in Debugging
These are just some of the tools that will help to give you more insight into your Zephyr programs as you dig deeper into the ecosystem and the Golioth Zephyr SDK. Once you start adding more capabilities, you will be able to visualize the finest details of what is happening and develop better software for your customers.
If you need help getting started with the tools described here, you can always join us on the Golioth Discord or check out the Golioth Forums for assistance. Happy debugging!
